Among Asian Americans, U.S.-born children of immigrants are most likely to have hidden part of their heritage

Noteworthy. Also of interest is that it sharply declines in the third or higher generations, along with being highest in the second generation, where many of the integration and identity struggles are:

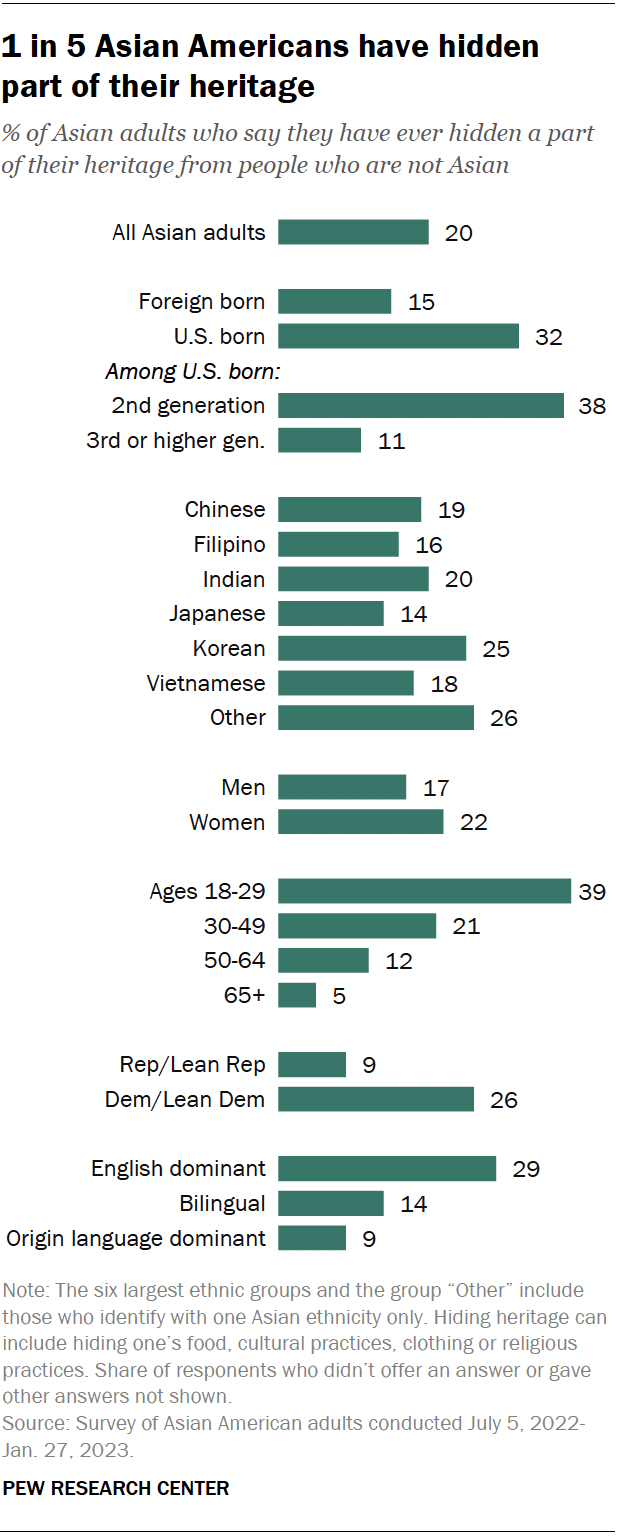
One-in-five Asian American adults say they have hidden a part of their heritage – cultural customs, food, clothing or religious practices – from non-Asians at some point in their lives. Fear of ridicule and a desire to fit in are common reasons they give for doing this, according to a Pew Research Center survey of Asian adults in the United States conducted from July 2022 to January 2023.

How we did this

A bar chart showing that 1 in 5 Asian Americans have hidden
part of their heritage.

Birthplace and immigrant roots play a role in who is most likely to hide their heritage: 32% of U.S.-born Asian adults have done this, compared with 15% of immigrants. Among those born in the U.S., second-generation Asian adults (in other words, those with at least one immigrant parent) are more likely than third- or higher-generation Asian Americans (those with U.S.-born parents) to have hidden their culture from non-Asians (38% vs. 11%).

Second-generation Asian Americans make up 34% of the U.S. Asian population, at approximately 7.9 million people, according to a Center analysis of the 2022 Current Population Survey. The majority of this group (66%) is under age 30. And according to our survey, they also primarily speak English.

Aside from generational differences, here are other survey findings about who is most likely to have hidden their heritage from non-Asians:

  • Korean Americans are more likely than some other Asian origin groups to say they have hidden part of their heritage. One-in-four Korean adults (25%) say they have done this, compared with smaller shares of Chinese (19%), Vietnamese (18%), Filipino (16%) and Japanese (14%) adults.
  • Asian Americans ages 18 to 29 are about twice as likely as older Asian adults to have hidden their culture. About 39% of Asian adults under 30 have hidden their culture, food, religion or clothing from non-Asians. About one-in-five Asians ages 30 to 49 (21%) have done this, as have 12% of Asians 50 to 64 and 5% of those 65 and older.
  • Asian adults who are Democrats or lean Democratic are much more likely than those who identify with or lean toward the Republican Party to have hidden their identity. Among Asian adults, 29% of Democrats have hidden their culture from others, compared with 9% of Republicans.
  • Asian Americans who primarily speak English are more likely than those who primarily speak the language of their Asian origin country to have hidden part of their heritage. Some 29% of English-dominant Asian adults have hidden their heritage, versus 14% of those who are bilingual and 9% who primarily speak their Asian origin language.

Why some Asian Americans hide their heritage

Asian Americans who said they have hidden part of their heritage also shared why they did so. Some of the most common reasons were a feeling of embarrassment or a lack of understanding from others.

However, different immigrant generations also cited various other reasons for hiding their culture:

  • Many recent Asian immigrants said they have tried to fit into the U.S. and fear that others may judge them negatively for sharing their heritage.
  • U.S.-born Asian Americans with immigrant parents often said they hid their heritage when they were growing up to fit into a predominantly White society. Some in this generation mentioned wanting to avoid reinforcing stereotypes about Asians.
  • Some multiracial Asian Americans and those with more distant immigrant roots (third generation or higher) said they had at times hidden their heritage to pass as White.

What U.S.-born Asian Americans say about growing up in the U.S.

In 2021, the Center conducted 17 focus groups in which Asian Americans born in the U.S. answered questions about their experiences growing up. Some second-generation Asian Americans shared distinct examples of hiding their heritage and having to balance their family’s cultural practices with the culture of broader American society:

“[It] was kind of that stigma when you were little, a teen, or you were younger that [you] don’t want to speak Chinese … because people would think that you’re a FOB [fresh off the boat] or an immigrant.” – Early 30s man with Chinese immigrant parents

“I remember in elementary school, I don’t even know what my mom brought me, [but] it was some Taiwanese dish. I guess it just had a more pungent smell to it. The kids would just be like, ‘Oh, what is that smell? You guys smell that?’ I would just cover my lid and be like, ‘Okay, I’m not going to eat my lunch.’” – Early 20s woman with Taiwanese immigrant parents

“[I] used to roll as Asian/Hispanic because I was too scared of my identity to say I was Pakistani. I remember 2011 or 2012, when [U.S. special operations forces] killed [al-Qaida leader Osama] bin Laden in Pakistan, after that happened, I was like, ‘Yeah, I’m definitely not saying I’m Pakistani,’ because people were coming up to me and they’re like, ‘Oh my God, they killed your uncle. They found him in your homeland.’” – Early 20s man with Pakistani immigrant parents

Alongside these struggles, many second-generation Asian Americans talked about being proud of their cultural background and wanting to share it with non-Asians:

“[W]hen I go to Cambodia and speak the language, it’s like connecting with an old friend … or meeting somebody from my past because so many of those ideas of what love is, of what it is to be part of a community, and even to live by example comes from having that language still alive within me.” –Early 30s man with Cambodian immigrant parents

“[T]here are going to be ups and downs. Definitely one of the downs is being labeled by other people for our differences. But one of our ups is that we have culture and language that we can always rely on; we have some diversity in customs and cultures that we could go back to. And if people are willing to experience these new differences, we can definitely pass it on and spread awareness of different cultures.” –Early 20s man with Korean immigrant parents

Source: Among Asian Americans, U.S.-born children of immigrants are most likely to have hidden part of their heritage

Survey: Religiously, Congress doesn’t reflect America

Of interest. Haven’t seen a comparable analysis of Canadian MPs but in general Canadian MPs are relatively more diverse than their American counterparts:

Religiously speaking, the incoming 118th Congress looks like America — that is, the America of decades past, rather than today.

Congress is far more Christian, and religious overall, than today’s general population.

Even though nearly three in 10 Americans claim no religious affiliation — a rate that has steadily risen in recent years — only two of the 534 incoming members of Congress will admit to as much.

Those are among the conclusions of an analysis by Pew Research Center of the 118th Congress, which was expected to start this week pending a House leadership vote.

The Congress “remains largely untouched by two trends that have long marked religious life in the United States: a decades-long decline in the share of Americans who identify as Christian, and a corresponding increase in the percentage who say they have no religious affiliation,” said the Pew report, released Tuesday. It was based on a CQ Roll Call survey of members of Congress.

Nearly 88% of members of Congress identify as Christian, compared with only 63% of U.S. adults overall. That includes 57% of congresspersons who identify as Protestant and 28% as Catholic, both higher than national rates. Also, 6% of members of Congress identify as Jewish, compared with 2% of the overall population.

While 29% Americans claim no religious affiliation, they’d have to squint to see themselves reflected in Congress. The only overtly non-religious members are U.S. Rep. Jared Huffman, D-Calif., who identifies as humanist, and Sen. Kyrsten Sinema, independent of Arizona, who says she’s religiously unaffiliated.

Pew listed 20 other members of Congress as having unknown religious affiliations, either because they declined to answer CQ Roll Call’s query or because the answers are otherwise muddled (such as in the case of New York Republican George Santos, along with much else in his background).

Historically, lacking a religious identity was seen as a political liability.

Only 60% of Americans told a Gallup survey in 2019 that they’d be willing to vote for an atheist — fewer than would vote for gays or lesbians or various religious or ethnic groups.

But Huffman said he experienced no political blowback.

“If anything, there’s a political upside,” he said. “People appreciate the fact that I’m just being honest.”

He said many colleagues in Congress find religion to be politically useful, “particularly across the aisle, how so many of them exploit and weaponize religion but seem to be totally divorced from any authentic connection to the religion they’re weaponizing.”

The ranks of Christians in Congress has dipped only slightly over the decades, though it’s a different story with the general population. Since 2007, Christians have gone from 78% to 63% of the population, while the non-affiliated rose from 16% to 29%, according to Pew. The trend line is even more dramatic when looking back to 1990, when nearly nine in 10 Americans identified as Christian, while less than one in 10 identified as non-religious, according to researchers at Trinity College in Connecticut.

In some ways, the two political parties conform to perception.

The Republican congressional delegation is a staggering 99% Christian, with the rest Jewish or unknown. Republicans — who have long embraced Christian expressions in their political functions and where an aggressive form of Christian nationalism has become more mainstream — include 69% Protestants, 25% Catholics and 5% other Christians (such as Mormon and Orthodox).

Democrats have more religious diversity, at about 76% Christian (including 44% Protestant, 31% Catholic and 1.5% Orthodox) and 12% Jewish. They have about 1% each of Buddhist, Hindu, Muslim and Unitarian Universalist representation.

But Democrats’ paucity of openly non-affiliated members contrasts starkly with a constituency to which it owes much.

Religiously unaffiliated voters opted overwhelmingly for Democrats candidates in the 2022 midterms. They voted for Democrats over Republicans by more than a 2 to 1 margin in House races, according to AP VoteCast, an expansive survey of more than 94,000 voters nationwide. And in some bellwether races, the unaffiliated went as high as 4 to 1 for Democrats.

“The fact that the (Democratic) leadership doesn’t reflect an open, secular identity is paradoxical, but I think it’s the nature of realpolitik,” said Phil Zuckerman, professor of sociology and secular studies at Pitzer College in Claremont, California. He said Democrats know that non-religious voters align with them on the issues, but party leaders also don’t want to alienate other, more religious parts of the party’s base, particularly Black Protestants.

Party leaders “speak to the politics of secular people but don’t want to take on the identity,” he said.

Zuckerman added that conservative Christians face the “branding problem” similar to what atheists once faced. Many voters, he said, have reacted against Christian nationalism, and young voters in particular are alienated by conservative Christian stances against LGBTQ people, while many voters of all ages have reacted against Christian nationalism.

He cited a prominent incident in 2020 when authorities forcibly cleared Black Lives Matter protesters in Lafayette Park in Washington, after which President Donald Trump walked to a nearby church and held up a Bible.

“When Trump held up that Bible in front of that church in D.C., he did more damage to the Christian brand than Hitchens and Dawkins and Harris combined,” Zuckerman said, referring to popular atheist authors.

In 2018, Huffman helped found the Congressional Freethought Caucus. It had a roster of about 15 members in the previous Congress.

“It’s people of different religious perspectives, but what brings us together is a common belief that there should be a bright line of separation between church and state and that we should make public policy based on facts and reason and science, and not religion,” he said.

He predicted that in time, more members of Congress would identify with secular values.

“It’s going to be a trailing reflection of this change that has been happening for a couple of decades now,” he said. ”It takes a while for politicians to figure out that it’s OK to do things like this.”

The Pew report analyzed one short of Congress’ capacity of 535 because one member, Rep. A. Donald McEachin, D-Va., died in November after being re-elected

Source: Survey: Religiously, Congress doesn’t reflect America

Public Opinions on Immigrants and Refugees: Does the Data Inform or Misinform Us?

Good, interesting and informative conversation:
Liberty Vittert: Hello, and welcome to the Harvard Data Science Review podcast. I’m Liberty Vittert, feature editor. And I, along with my co-host and editor-in-chief Xiao-Li Meng, are diving into a highly controversial topic today: refugees and immigration. American public opinion seems very divided on these issues, but is it really? Is America more or less welcoming to refugees and immigrants than other parts of the world? And how will the Southern border, Ukraine — name a crisis — affect the upcoming American political elections?

We bring in two experts to discuss. Scott Tranter currently leads data science and engineering efforts at Dynata. He’s also the co-founder of Optimist Analytics, which was acquired by Dynata in 2021, and is an investor in Decision Desk HQ, which provides election results data to news outlets, political campaigns, and businesses. We also have with us professor Katharine Donato, who holds the Donald G. Herzberg chair in international migration at Georgetown University, and is the director of the Institute for the study of International Migration in the Walsh School of Foreign Service at Georgetown University.

Xiao-Li Meng: Katherine and Scott, thank you so much for joining us. Since this is a data science podcast, the first question is about data. What are the current reliable opinion polls available out there about the general American public sentiment toward refugees and migrants, and how do we know these opinion polls are reliable?

Scott Tranter: Let me break that down into two questions: What are good ones, and how do we know they’re reliable? I still think Pew is probably the best resource for what I would call unbiased research on the American public opinion. They do a very good international public opinion as well on immigration issues and things like that. One of the reasons is that it’s very longitudinal. They have some questions on immigration going back 30, 40, 50 years now, probably even longer than that. And they’re very good and well-funded. They don’t miss quarters. They don’t miss reportings. And so we can look back at the 90s, of what people thought about cross-border immigration between U.S. and Mexico, and see how it’s evolved over the last 20 years as debate. How do we know it’s reliable? That’s the ever-pressing question with polling: Is it reliable?

And I think, Xiao-Li — you and I have talked many times. It’s statistics. We’re getting close, but we’re probably wrong somewhere. And the key is to know where we’re wrong. That’s a long way of me saying I think Pew does a good job because they’re consistent. They may be wrong, but they’re looking at attitudinal shifts and if they’re off by five, they’ve been off by five for 30 years and they get us right directionally, which I think is the important part when people look at polls. Don’t look at the numbers and look for precision, look at the numbers and look for trends. And I think that’s what everyone should take away from stuff like that.

Xiao-Li Meng: And this is a question for both of you. You both talk about this, the importance of thinking about things over time. As we know, the public tends to pay particular attention to issues like refugee migrants during times of crisis. Whether it’s Syria, Venezuela, now it’s Ukraine. How have things changed over time?

Scott Tranter: I think when we look at some of the polling in and around some of these countries before they become in the news — you mentioned Syria, you mentioned Ukraine. The southern border, while it is persistent in U.S. politics, has times of spiking and not spiking. It’s largely changed when we look at the U.S.-based stuff, it’s largely revolved around political party lines. And the messaging has roughly been the same over the last 10 or 15 years. It’s not necessarily about the specific reason it popped up. During the 2020 election, it was around some of these migrant caravans coming from South America up through Mexico, across the border. It really wasn’t about that specific caravan, while that’s what the news covered. That was symbolic of the larger immigration issue as a whole. Whereas we see internationally when it’s about Syria, or Ukraine, it’s usually not about that specific instance.

It’s about, what do we think about foreign aid? All of a sudden the public remembers that we spend billions of dollars on foreign aid. It’s not hundreds of millions of dollars, things like that. That’s been primarily how the public has been viewing it over the last 10 or 15 years, mostly because of how they are consuming their news and where they get their news from. I think what’s interesting or what I’ve noticed has changed is there isn’t a whole lot of movement, and I’d be curious to see what Katharine thinks on this in general — feelings about, should we support refugees overseas or by and large, should we support change to our immigration policy in the U.S.? The opinion lines have been pretty solidified, which is interesting because we do know from public opinion research and sociology and political science that you can change people’s opinions.

These things happen quite a bit. And I think there’s an opportunity here for people who want to push their side to change up the messaging a little bit to get what they want, because we do see that in small-scale tests, whether it be message testing, ad testing, or focus groups. There’s quite a bit of consistency. There’s not a whole lot of change over the last 10 or 12 years in the messaging or what we’ve noticed in opinion, but it doesn’t mean it can’t change in the future.

Katharine Donato: I do think you bring up an important point, which is that as we think about countries to the south of our border at this point, really not Mexico, as much as northern, central America. The story that’s told in the U.S. is very politicized. And actually, that goes back 30 years. Thirty years of one party viewing the border and viewing the issue in one way versus another. But that view is very different than what’s believed with respect to Ukraine, with respect to Syria, with respect to Afghanistan. And because that story of refugees who come from those places come from a situation of international import, international aid and international relationships. The entire country was following the Afghan evacuation in August. I think primarily because we had been — we as a country and so many Americans had made relationships and understood the real life experience in Afghanistan and understood people and said, “We really have to do something. We have spent decades in this country and we really need to get these people out.”

We, in theory, could have that same opinion about Honduras, but we don’t, and that’s partly because the politics and the messaging around the countries south of the border has never been the same kind of messaging that recently we’ve seen with Afghanistan and Ukraine. And you could argue that kind of messaging doesn’t exist for smaller scale movements of people who are forced to move.

Think about the Rohingya in Bangladesh. That was certainly forced movement, but it wasn’t about international relationships between the United States and other countries. It wasn’t about international aid. And there still are over 700,000 people from Myanmar living in Bangladesh with I don’t know what kind of future there and more and more kids being born stateless because Bangladesh isn’t giving them birth certificates. These sorts of situations when they’re not part of foreign aid and foreign assistance really just sit and fuel other issues that are problematic over time.

Liberty Vittert: I do have a question about these movements of people. Something like the Afghanistan crisis. It was a very easy thing for someone to wrap their head around. These people helped us. The Taliban’s now coming to kill them. If we don’t get them out, they’re going to be killed. That’s a very easy thing for me to understand. Whereas with something like the southern border, when I was recently there, I met people who had been forced out of Honduras because the government was trying to kill them, but I also met a family who was coming up because the father simply couldn’t find a job, but it wasn’t like the government was coming to try to kill him. I can understand how there’s confusion between those two types of people specifically for Americans. Is there real data on how many people are coming from our southern border that are what you would normally think of as a refugee, like the Afghanistan crisis versus people who are coming for other valid reasons, but not necessarily for refugee status?

Katharine Donato: Let me say this: Reasons and motives are messy. Every time I go to either border — the U.S. southern border, the Mexican southern border, doesn’t matter — people tell you all kinds of things. Let me step back by saying, in response, that you can wrap your head around the idea — and most Americans did that. We worked with these people for 20 years in Afghanistan. And so many of them now, as the Taliban takes over, are going to be at risk and we owe it to them and our country to move these people out and give them a place for them to raise their children in a peaceful way. But migration from northern central American countries started growing in the late 80s. It took off in the 1990s. There was essentially no migration from northern central America before the mid-1980s.

And then 20 years later, we’re wondering why there are so many children at the border. Those kids are trying to reunite with their parents who are in the U.S.

What I don’t understand is why we can’t wrap our heads around the fact that we, the United States, has been relying on the labor of immigrants from northern central America and from Mexico for decades. And then we’re surprised that when the kids get to be 13, 14, 15, they want to live with their parents?

Back in 2014, I was saying this. Why aren’t we helping evacuate those kids to go to the U.S. in a legal, safe way versus what has happened?

Which is they hire smugglers and come up to the border. To me, that’s a very simple thing that people could get their heads around, but there’s a lot of resistance to recognizing how much we in the U.S., our lives are subsidized by the lives of immigrant laborers. We do as a nation and as an economy rely on immigrant labor and yet we can’t wrap our arms around the fact that there could be kids and grandkids who want to reunify after years of living without their parents. These kids want to reunify with them here.

Liberty Vittert: It’s funny, I wrote an article using a lot of data about how we need to increase immigration or risk economic disaster for the United States, but I’m totally with you. And it makes so much sense. I can’t help but wonder though, is there a difference in the way Americans feel versus Europeans? Scott, is there any data on this: Are Europeans more willing to accept immigrants or is the U.S. more willing to accept immigrants? I think with news messaging, I always imagine that America’s the most closed off, but maybe it’s not. Do we have any feelings about this or knowledge about this?

Scott Tranter: It’s funny you bring that up, because I always talk about it. Let me bring up one extreme example. You look at the country of India and how much immigration they allow. Naturalized immigration. I think it’s in the low four digits. A country with over —

Liberty Vittert: What? You mean like 1,000 people?

Scott Tranter: Yes. Naturalized. They allow guest workers and things like that, but they’re just like, “No, we’re not going to naturalize someone from Canada who wants to move to India.” And I think we see that a lot. I’m using an extreme example there, but let’s take a look at the Syria refugee crisis. And a lot of those folks were moving through Eastern and Western Europe. And you would see in places like France, especially the suburbs of Paris, lots of riots, lots of opinions and lots of, to be honest, racism against Syrian immigrants as they came through. You see this in Germany, you see this in Hungary. You see this in Poland. You saw this in Ukraine, too. Immigration is a huge issue in Europe and it’s highly polarizing. And I would argue in some instances more polarizing than it is in the U.S. because I think they have a little bit more in-your-face protests about it and things like that.

But the U.S. is by no means the worst and by no means the best if your measurement in worst and best is acceptance of immigrants. It’s a big issue everywhere. What’s interesting is the rhetoric and some of the opinion and messaging around it. In the U.S. in the early 2000s, the messaging was always, we don’t need immigration because we’d like the Americans in the job. Over the last five or six years with unemployment sitting somewhere between 3 and 5 percent, which is historically low, that’s a harder message to do. But in places like France, where you will see unemployment, especially in regions, at 10 to 15 percent, that’s still a pretty potent argument. And it’s one of those things I think internationally is an issue. Enlightened might be the wrong word, but I don’t necessarily think our European friends are looking at immigration any better or worse than we are. They’re looking at it with similar problems and on similar scale.

Katharine Donato: I totally agree that it’s not the worst here. We do have a system to naturalize and you can set yourself up to naturalize after getting permanent residency. It takes time. It’s an investment, but it can be done. And in many parts of the world, no one can be naturalized, or as Scott said, very, very few people can be naturalized. There’s a long history of many European countries not allowing citizens to be foreign nationals. But even during periods of tight restrictions, there are still foreign nationals who are permitted to live in the U.S. permanently and to be naturalized. I talk about all the problems in the U.S. system and at the same time recognize that we are in one of the nations that along the lines of citizenship and some other factors has a pretty good track record. I’d love to hear Scott talk about the border for people who don’t know much about the border and many people in the U.S. — and if we just think about the southern border, many people in the U.S. and in Mexico really know very little about the border.

The border is a really unique, specific place, physically, and economically with respect to the movement of people. And yet when it comes to the politics around the border and the political opinion around the border, in the minds of many, they equate the border to migration. When in fact the border is so much more than that. I think if we were able — we, the big broader U.S. — if we were able to see the border as more than migration, we actually could do some really good things that would strengthen that regional border place, which for me is typically 20 to 40 miles from the border north and south. And we could strengthen it in so many ways that would make it a better place for everyone there.

Scott Tranter: I know we’re on the data podcast, so I will bring in a qualitative focus group I was in. It was interesting. We’re in Minnesota and you’re asking people about what the border meant to them. So Minnesota, right, they have the Canadian border, but they’re pretty far away from the southern border. And they had some pretty strong opinions about how the border affected their day-to-day life. Think about that. They think the U.S. southern border affects their day-to-day life and they might make an argument… They might say, “We need a strong southern border because I want trucks to pass through freely so I get goods better.” They might make an economic argument, or et cetera, et cetera, et cetera. But no, they were making a safety and fairness argument.

And the safety and fairness argument was — first, they’re like, “An unprotected border lets in a lot of people we may or may not like, whether they be criminals or terrorists” or whatever it is. So there’s an aspect there. And a fairness is, “it’s not that we don’t like them, it’s just why do they get to cut the line?” And for them, the border is symbolic of those two things. And if we sat in focus groups, and I’m sure there have been some poll questions constructed, although they’d probably be pretty poorly constructed poll questions that ask at that… Generally speaking, I would say if you’re asking it within 30 or 40 miles of the border, you’ll probably get a better answer. But if you’re asking it anywhere in America, the border pretty much is equated with fairness and safety and things like that, whether that’s true or not.

And I think that is just the easy answer for folks. And that’s what has been drilled in for the last 15 or 20 years with 30-second ads and 10-second flashes and 10-minute fiery speeches. And it’s one of those things I think we need to get off the sound bites — and a little bit that’s the public. I blame the public for this — we’re just people of convenience, and I don’t really want to think about this much longer than the 15 seconds that’s in front of me. That’s the answer in all public opinion. If we are doing this on climate change and how to educate people on that, it really boils down to, we have got to stop speaking in 15-second increments. If we ask the border question of some very staunch Republicans who own hundreds of acres on the U.S.-Mexican border, they’re actually fairly pro-immigration as far as it goes in the political spectrum. They vote Republican every single time and they own property on the border and they own guns and all the other things.

But they’re like, “Look, unless you’re going to put a hundred-foot fence up and then man someone every 10 feet, the wall isn’t an answer. We have to have a comprehensive… We have to have a way to get it. And oh, by the way, I want some of these workers to work on my farm and they want to work on my farm and then they want to go work somewhere else.” And I think, the closer you get to the issue, the more educated people get. It’s just because they have to spend more than two minutes on it.

Liberty Vittert: We can say, what is the general American public feeling or we can say, what is the general international feeling towards the refugees or immigrant movements, but how does it break down? If we’re actually trying… If political parties either direction, or if organizations — nonprofits — are trying to sway American public opinion one way or the other in terms of how they feel about refugees and migrants, who is it that they need to sway? Who feels which way? And what is the kind of messaging that works? What can actually make someone feel better? Scott, I remember USA for UNHCR did some work. And there were things that surprised me that actually swayed people negatively, gave people less affinity for the cause. That surprised me. How do we figure those things out?

Scott Tranter: I think public opinion polling is important, but I think we also need to go upstream with some of the message testing and how we present this information. And let me give you a parallel. When looking at trying to convince people about climate change, what a lot of organizations found was that we don’t talk about the scary parts of climate change, we talk about if the sea is going to rise, then your flood insurance is going to get higher. That actually happened to convince a lot of people who are like, “I don’t know, climate change may be a thing, may not be a thing, but if you’re telling me my home insurance is going to go up, my flood insurance is going to go up, I’m going to start paying attention to this.” If we take that example to immigration, maybe we don’t talk about some of the hard… It could go either way. Maybe we don’t talk about some of the hard economic choices. We talk about the moral choices. And then we see things like the Catholic church specifically in the U.S., they’re considered relatively pro-immigration and that’s the angle they go, and they seem to have some efficacy there. Or on the flip side, I’ve seen some testing on some ads where people crossing the border, they’re going to be here, whether or not you think they should be here or not. So they should be in the system so they can be contributors and they can not be in the shadows of society. That’s reason and logic. And that’s a long way of me saying there are a lot of different ways to do it and different pockets of people respond differently but what we really need to do is take the one step beyond the public opinion and really start message testing this and seeing what different groups it goes against.

Katharine Donato: And I would say the message testing has to be not done at one point in time only because we do live in this very dynamic political landscape at the moment. A dynamic, let’s say, just in the last 10 years, if we think about politics. We need to be able to do that message testing, make a commitment to do it over a period of years and different months in a year so that we can really figure out whether or not something is specific to a particular time and place, or whether it truly can make a difference across, let’s say, much of one country over a period of a few years.

Xiao-Li Meng: Speaking of informing the public and educating the public, having longer conversations to make sure everybody understands what things really are… There’s one thing that has changed over the time and is increasing becoming a concern for all of us — and Katharine, thank you for your wonderful article for Harvard Data Science Review about misinformation, that you wrote about how the trigger is misinformation about a set of announcements about entry and exit restriction at the Venezuela and the Columbian border. My general question here is, first, what do we know about the impact of this misinformation? As Scott just said, a 15-second ad can influence people’s thinking and 15 seconds of misinformation can probably do quite a bit of damage. And my second question probably is even a little bit harder: How do we make sure that particularly for the data science community itself, that when we study those issues, that we make sure we don’t fall into the trap — for example, select or study something that supports our ideology, because that can distort the information?

Katharine Donato: Let me say that the piece that I wrote for the journal, we looked at certain announcements and certain events, and then tried to… We used Twitter data to look at the conversation before and after those events and those announcements. And on the one hand, there is a lot of concern and we need to be concerned about misinformation and all the information that is not empirically supported, but on the other hand — and one of the events that we focused on was the president of Venezuela when he announced that there is a miracle drops cure to COVID. We were interested in seeing after that day, how much that messaging sustained itself. And for the first few days we saw in terms of frequency a lot of messaging, but the key finding is that messaging drops down to almost zero within the first two weeks of that announcement.

It wasn’t successful from Maduro’s point of view, I assume, or his people, because I’m assuming that they had hoped to make this announcement because they wanted other things to happen. And that the announcement itself just has no salience on Twitter by a month afterward. That gives me some hope that some forms of misinformation will not have the saliency that I would worry about. That I would worry about. And you can measure that by — in this case, we use Twitter, but you could also look at other forms of organic data that would help you, let’s say, from online newspapers and different languages. And you could look at any event or any announcement and try to understand whether or not a conversation about that event or announcement shifts over time. That’s interesting. That is something that before this age of social media, we couldn’t do. We did look at the conversation, but we didn’t have the same data. We didn’t have the same amount of data. We didn’t have all of the data analytics we have now.

On the one hand, we’re moving forward. On the other hand with all of the social media, we have certainly evidence of — I don’t know if it’s more or less; I fear that it’s more — misinformation and the ability for computers to create more of that misinformation on their own. Increasingly, in all areas of the social sciences, we move toward using these data more, absolutely. If we have a fabulously important question, we also have to prioritize the misinformation piece. What are we going to do to answer the question, to me now, is only half of the question that ultimately needs to be asked and answered because the other half has to be, how do we know what we’re seeing is real? And how do we understand the various forms of manipulating the messaging or the conversation that we’re studying?

Liberty Vittert: Professor, is there a specific example over the past X amount of years of a trend that really surprised you or that you think that people wouldn’t know about when it comes to sentiment?

Katharine Donato: I don’t know how much people know about it because you can’t really tell in this politicized environment we’re living in. I think a lot of people know this, but they don’t own it as knowledge that’s important, at least that’s my sense. I’m not a politician, but the fact that you have 80 percent or so, give or take, of the American public supporting DACA and supporting a way of making DACA become more permanent as a status — that’s the program that President Obama through executive action started in 2012. It just actually had its 10 year anniversary. DACA stands for Deferred Action for Childhood Arrivals and I think estimates are about 700,000+ people in the United States have DACA. It is not a legal status. It is a status and it’s temporary, but it does allow people who came in either with their parents or without their parents, as children, to move their status toward regularizing it so that they can work in the U.S. and they can be above the table versus below.

When you look at public opinion about DACA recipients, you just see very high numbers, a lot of support. And yet it’s 10 years old and we still have 700,000 or more people without a formal regularized status. And when I talk and I tell people about the support for DACA, sometimes people know. People on both sides of the political spectrum or on all sides will know there’s a lot of support for the DACA recipients. And yet at the same time, there’s been no change, no ability in Congress to move it forward. That’s just one of several examples I think. Generally, the U.S. public is in support of immigration and yet we hear so much more in the media about, let’s say, the problems on the immigration side. I don’t know if it’s just that people don’t know some of the findings about public opinion nationwide or they just don’t then own it to move some change forward.

Liberty Vittert: Given all of this misinformation, given all these conversations about refugees and migrants, Scott, you are the caller of the elections coming up in 2022 and 2024. How much will these conversations be affecting ‘22 and ‘24?

Scott Tranter: That’s always my favorite question, especially when we’re four months out. What I have been amazed about is the public’s ability to not have any attention span. And what I mean by that is whatever we’re talking about today, if we’re talking about it in the final four to two weeks, then maybe, but if we know what we’re going to be talking about in the final two to four weeks in October, we should all go start a political consultancy, because we will all be bajillionaires and pick the winner.

Liberty Vittert: We’ll go to Vegas and bet on the winner.

Scott Tranter: Vegas or the UK where you can actually bet on this stuff. The answer is that it’s possible, but politics doesn’t drive the news. Politics reacts to the news. And what does the news do? The news is very, what can I get attention on? If you tell me what we’re going to be talking about in October, I’ll tell you what the issues are, but I don’t think anyone can do that.

That’s a long way of me saying immigration is always going to be an issue on people’s radar if it’s polled. It is consistently polled on the top five of issues. It’s usually not the number one. Occasionally it gets number one. For instance, in 2008, it was number one in Arizona for the presidential. Why? Because John McCain ran on those types of things, but it is usually top five. And when I say top five, everyone could probably guess it’s big broad issues like immigration, healthcare, jobs, and economy. Sometimes you separate those out and then there’s usually some foreign affairs aspect or something like that. But those generally are what they are. Today, the number one issue, by and large, is inflation, which is a proxy for the economy.

Liberty Vittert: It’s the economy, stupid. Isn’t that the quote?

Scott Tranter: It’s the economy stupid. Yeah, James Carville and Paul Begala used to say that. It’s one of those things, and why is that important? It’s because gas in California is above seven bucks a gallon. That’s what they care about and that’s what’s on the news. And I don’t know if this will be an issue this fall. I do know that border issues, immigration issues are fundraising issues for both the Democrats and the Republicans. Even though it’s not maybe talked about in the news, it’s what a significant amount of Republican candidates use to their position on what they think should do with the border. They will raise millions if not tens of millions of dollars on their position. And so will Democrats, by the way. Democrats will also, off their immigration positioning, raise millions, if not tens of millions of dollars. It is an issue that resonates. Whether it’s an issue that moves the middle or moves the sway-able voters, that’s a different question. And I don’t have an answer for that, but it does move money among the opinion hardened left and right.

Xiao-Li Meng: Thank you, Katharine and Scott, for this really both informative and thought-provoking conversation. Unfortunately, we have to wrap up. But we always end with this magical wand question, and today’s question is, what data do you want? If you can wave your magical wand, what data do you want about refugees that you don’t have?

Katharine Donato: What I really want are detailed movement histories. And when I say detailed I don’t just want to know if you’ve moved because you were forced to move. I want to know when you moved, how long it took you to get to wherever you’ve gone, what’s happened in the place that you’ve been received and, importantly, if you’ve moved beyond that first move. We know very, very little about secondary and tertiary movements among forced migrants, whether they’re formally refugees embedded by the UNHCR or not. Remember that less than 1 percent of refugees get resettled. UNHCR vets people, gives people the refugee label following global protocols, and then most refugees remain refugees and can’t really leave where they are, but we don’t really know that. We just know that only 1 percent get resettled. What happens to everyone else and what happens even after you get resettled?

I would like to see migration history data that are timed that would allow us to understand the first, second, third moves of people. And then we could really tie such data, if they’re tied to time and place. We can then integrate other traditional data sources with them. We could certainly understand climate-induced migration and environmentally induced migration in a much deeper way than we have. We have some survey data that offer those kinds of detailed migration histories, but they’re very specific to place and certain migration circuits around the world. And none of the global multilateral organizations collect such data because they’re in the business of providing relief as well as some other things. They’re too busy, but I think we could make a really significant move forward if we had such data about people who were forced to move.

Xiao-Li Meng: Thank you. Scott?

Scott Tranter: In my answer, it’s going to be a little more specific. I would love… Specifically in the U.S., economic migration history. What I always wondered is if you’re a person who crosses the border, you walked 10, 15, 20, 30, 40 miles in an area I would never walk to a place where you’re not sure how you’re going to feed or shelter yourself. And then a lot of these people, by and large, are getting jobs and then they are working themselves up to pay for shelter or send their kids to school and things like that.

And I think if we had good economic data on what happens to these immigrants, especially in the U.S., on how they integrate themselves into society, I think that’d be much more enlightening and move us away from the anecdotes of, “They’re just coming here so they can rob a 7/11 or they’re just coming here so that they can walk into an emergency room and glum off healthcare.” I think if we had hard data, irrefutable data on what these people did once they came across — and not just 30 days after, but years after — I think we’d do away with the anecdotes and really bring some hard data to it.

Xiao-Li Meng: Wonderful. And both of you, I’ll just remind the whole data science community how hard it is in this humanitarian study to collect data. And I really want to thank both of you, but I also want to just again, make a plea to the general data science community through this podcast, that there is so much more can be done, should be done. And the data science community can help. And I think I keep using the words data science here in a broadest sense because lots of things here are really about even how to ask the question, what to measure, and in this geo-space, one of the hardest things about collecting data is that you will have countries, regimes that will actively conceal their data. This is another level of complication that I think really the whole data science community can help to work on. And, again, thanks to both of you for such a thought-provoking conversation, and thank you again for your time.

Liberty Vittert: Thank you both so much.
Source: Public Opinions on Immigrants and Refugees: Does the Data Inform or Misinform Us?

Legal US immigration rebounds somewhat after plunging with COVID pandemic

Useful analysis by Pew:

The number of immigrants receiving green cards as new lawful U.S. permanent residents bounced back last year to pre-pandemic levels after plunging during the coronavirus outbreak, according to a new Pew Research Center analysis of recently available government data. Green cards issued to immigrants already in the United States seeking to adjust their temporary status rebounded above pre-pandemic levels, while the number of green cards for new arrivals also grew but did not reach earlier totals.

About 282,000 people received green cards in July-September 2021, the final quarter of the fiscal year, according to quarterly admissions data from the federal Office of Immigration Statistics. That number was higher than in any quarter since April-June 2017, and slightly higher than the quarterly average for the period from October 2015 to March 2020. During the pandemic, new green card issuances fell to a quarterly low of 79,000 in mid-2020.

Arrivals of foreign tourists, business visitors, guest workers, foreign students and other temporary lawful migrants also rebounded somewhat, according to data for the final quarter of fiscal 2021, which ended Sept. 30. For the most part, however, arrivals of these lawful temporary migrants are still well below their pre-pandemic averages.

How we did this

Beginning in early 2020, the coronavirus pandemic had a big impact on migration worldwide. The U.S. closed land borders with Canada and Mexico to nonessential travel through late 2021, and air travel between countries also was severely restricted. Three-quarters of U.S. consulates globally, which issue visas, remained closed through June 2021. U.S. Citizenship and Immigration Services, which processes applications for immigrants already in the U.S., suspended in-person interviews as well as other services during the height of the pandemic. Other countries – both sources of immigrants and transit corridors for them – closed their borders early on in the pandemic, bringing international migration nearly to a halt.

Fewer green cards issued

A line graph showing that green card totals for legal U.S. immigrants have rebounded to  pre-pandemic levels

During the pandemic, green card issuances for newly arriving immigrants dropped more sharply than issuances for immigrants already in the United States on temporary visas. Issuances for newly arriving immigrants also have not recovered as much ground as issuances for immigrants already in the U.S. when compared with pre-pandemic levels.

At the low point for visa and legal permanent status issuances at the start of the pandemic – the April-June 2020 period that was the third quarter of the fiscal year – roughly 19,000 green cards were issued to new arrivals to the U.S., compared with an average of about 134,000 each quarter for the period from October 2015 to March 2020. In the last quarter of fiscal 2021, in June to September of that year, about 105,000 green cards were issued to immigrants newly arriving in the U.S., or about 78% of the pre-pandemic quarterly average.

The number of green cards granted to immigrants already in the U.S. on temporary visas, called an “adjustment of status,” did not fall as steeply. During the 2020 pandemic low point for lawful immigration, about 60,000 green cards were issued to immigrants adjusting their status, compared with a quarterly average of 141,000 for fiscal 2016 onward. By the final quarter of fiscal 2021, roughly 177,000 green cards were issued for adjustments of status, more than in any quarter recorded since at least fiscal 2016.

Legal admission of temporary migrants partially rebounds

Arrivals of legally admitted temporary migrants, which averaged 19.6 million per quarter from fiscal 2016 through March 2020, dove to about 600,000 during April-June 2020, the third quarter of the fiscal year. That was only 3% of the pre-pandemic average.

A line graph showing that tourist arrivals to the U.S. have not recovered from a pandemic-era drop

About 80% of these arrivals before the pandemic were tourists, and most of the rest were business travelers, temporary workers and their families, and students.

While the numbers have gone up from the low point in April-June 2020, the number of arrivals of tourists and business travelers are still well below pre-pandemic levels. However, the number of arrivals for temporary worker and student visas have risen closer to average levels in comparable quarters for October 2016-March 2020 than have the number of arrivals by business or tourist visas.

Hardest hit by the border closures were arrivals of tourists, which dropped to only 1% of earlier levels in April-June 2020 – about 185,000 arrivals, compared with a quarterly average of 15.6 million for the period beginning October 2015. These arrivals have since risen considerably, but the latest data (from July to September 2021) shows that quarterly tourism has reached only 22% of the average level of the period from late 2015 until the pandemic hit in March 2020.

A line graph showing that U.S. arrivals of temporary migrants, especially business travelers, are below pre-pandemic levels

The number of foreign visitors attending conferences or otherwise traveling on business also declined dramatically, to only 6% of pre-pandemic levels. Even with sizable increases since then, business visitor visas only reached 21% of pre-pandemic levels, roughly 461,000, in the final quarter of fiscal 2021.

In April-June 2020, only about 11,000 foreign students arrived in the United States, representing 4% of average arrivals during similar quarters since 2016. The numbers increased substantially but remained well below pre-pandemic levels until the fourth quarter of 2021, when about 501,000 foreign students arrived in the U.S., reaching two-thirds (67%) of the average number of fourth-quarter arrivals prior to the pandemic’s start.

Arrivals of temporary workers and their families dropped somewhat less during the pandemic than those of others with temporary status. The roughly 226,000 arrivals of temporary workers in April-June 2020 represented 23% of average quarterly arrivals from October 2015 to March 2020. By July-September 2021, arrivals of temporary workers had more than doubled from the 2020 low, to about 542,000, but still remained at only slightly above half the pre-pandemic level (54%).

The somewhat smaller drop in temporary workers was in large part a function of the continued arrival of agricultural workers (issued H-2A visas) to cross the border to pick crops. In a Federal Register notice, the Department of Homeland Security deemed these jobs “critical to the U.S. public health and safety and economy.” About 100,000 H-2A workers were admitted in April-June 2020, only 4,000 fewer than were admitted in the same quarter the year before and 12% more than the average number admitted for the third quarters of 2016-2019. Excluding H-2A visa arrivals, the number of arrivals of temporary workers during April-June 2020 fell to 14% of pre-pandemic averages.

Source: Legal US immigration rebounds somewhat after plunging with COVID pandemic

Pew: The Changing Political Geography of COVID-19 Over the Last Two Years

Interesting trends regarding how COVID has progressed in different counties with the general correlation between higher COVID rates and support for Trump:

Over the past two years, the official count of coronavirus deaths in the United States has risen and is now approaching 1 million lives. Large majorities of Americans say they personally know someone who has been hospitalized or died of the coronavirus, and it has impacted – in varying degrees – nearly every aspect of life.

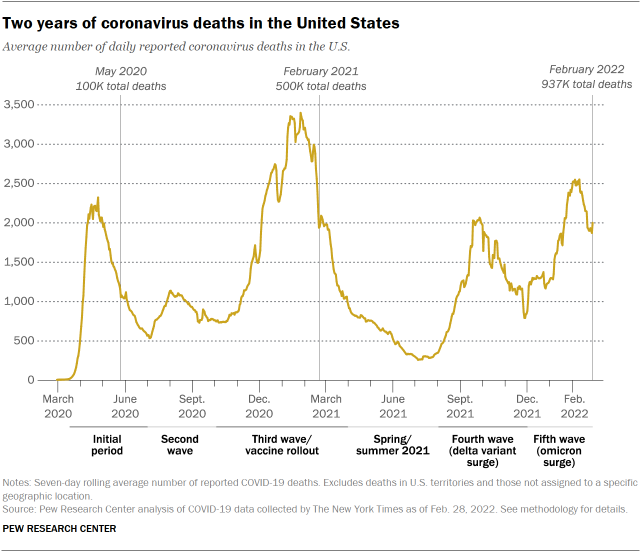
Chart shows two years of coronavirus deaths in the United States

A new Pew Research Center analysis of official reports of COVID-19-related deaths across the country, based on mortality data collected by The New York Times, shows how the dynamics of the pandemic have shifted over the past two years.

A timeline of the shifting geography of the pandemic

The pandemic has rolled across the U.S. unevenly and in waves. Today, the death toll of the pandemic looks very different from how it looked in the early part of 2020. The first wave (roughly the first 125,000 deaths from March 2020 through June 2020) was largely geographically concentrated in the Northeast and in particular the New York City region. During the summer of 2020, the largest share of the roughly 80,000 deaths that occurred during the pandemic’s second wave were in the southern parts of the country.

The fall and winter months of 2020 and early 2021 were the deadliest of the pandemic to date. More than 370,000 Americans died of COVID-19 between October 2020 and April 2021; the geographic distinctions that characterized the earlier waves became much less pronounced.

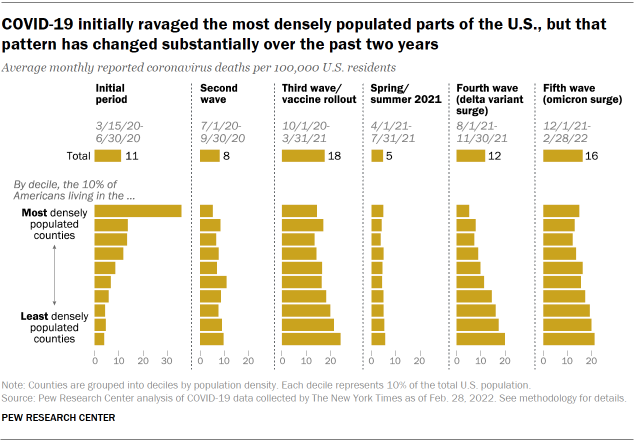
Chart shows COVID-19 initially ravaged the most densely populated parts of the U.S., but that pattern has changed substantially over the past two years

By the spring and summer of 2021, the nationwide death rate had slowed significantly, and vaccines were widely available to all adults who wanted them. But starting at the end of the summer, the fourth and fifth waves (marked by new variants of the virus, delta and then omicron) came in quick succession and claimed more than 300,000 lives.

In many cases, the characteristics of communities that were associated with higher death rates at the beginning of the pandemic are now associated with lower death rates (and vice versa). Early in the pandemic, urban areas were disproportionately impacted. During the first wave, the coronavirus death rate in the 10% of the country that lives in the most densely populated counties was more than nine times that of the death rate among the 10% of the population living in the least densely populated counties. In each subsequent wave, however, the nation’s least dense counties have registered higher death rates than the most densely populated places.

Despite the staggering death toll in densely populated urban areas during the first months of the pandemic (an average 36 monthly deaths per 100,000 residents), the overall death rate over the course of the pandemic is slightly higher in the least populated parts of the country (an average monthly 15 deaths per 100,000 among the 10% living in the least densely populated counties vs. 13 per 100,000 among the 10% in the most densely populated counties).

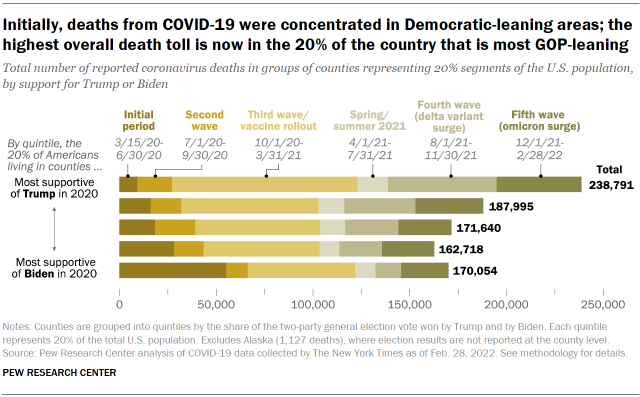
Chart shows initially, deaths from COVID-19 were concentrated in Democratic-leaning areas; the highest overall death toll is now in the 20% of the country that is most GOP-leaning

As the relationship between population density and coronavirus death rates has changed over the course of the pandemic, so too has the relationship between counties’ voting patterns and their death rates from COVID-19.

In the spring of 2020, the areas recording the greatest numbers of deaths were much more likely to vote Democratic than Republican. But by the third wave of the pandemic, which began in fall 2020, the pattern had reversed: Counties that voted for Donald Trump over Joe Biden were suffering substantially more deaths from the coronavirus pandemic than those that voted for Biden over Trump. This reversal is likely a result of several factors including differences in mitigation efforts and vaccine uptake, demographic differences, and other differences that are correlated with partisanship at the county level.

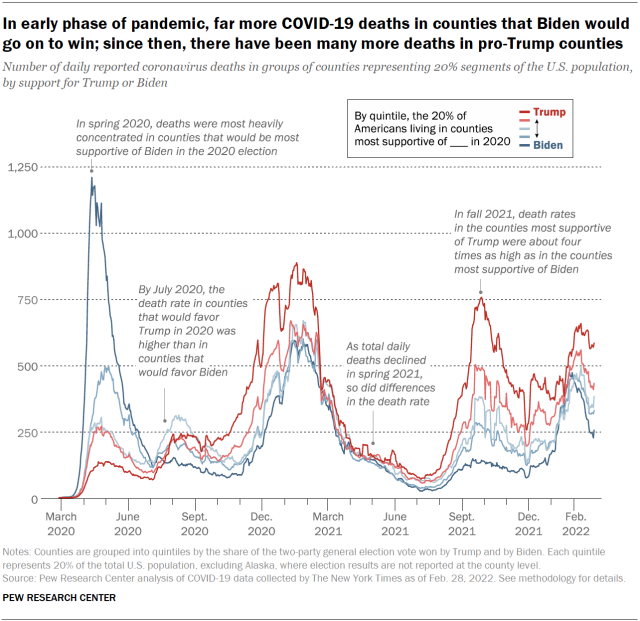
Chart shows in early phase of pandemic, far more COVID-19 deaths in counties that Biden would go on to win; since then, there have been many more deaths in pro-Trump counties

During this third wave – which continued into early 2021 – the coronavirus death rate among the 20% of Americans living in counties that supported Trump by the highest margins in 2020 was about 170% of the death rate among the one-in-five Americans living in counties that supported Biden by the largest margins.

As vaccines became more widely available, this discrepancy between “blue” and “red” counties became even larger as the virulent delta strain of the pandemic spread across the country during the summer and fall of 2021, even as the totalnumber of deaths fell somewhat from its third wave peak.

During the fourth wave of the pandemic, death rates in the most pro-Trump counties were about four times what they were in the most pro-Biden counties. When the highly transmissible omicron variant began to spread in the U.S. in late 2021, these differences narrowed substantially. However, death rates in the most pro-Trump counties were still about 180% of what they were in the most pro-Biden counties throughout late 2021 and early 2022.

The cumulative impact of these divergent death rates is a wide difference in total deaths from COVID-19 between the most pro-Trump and most pro-Biden parts of the country. Since the pandemic began, counties representing the 20% of the population where Trump ran up his highest margins in 2020 have experienced nearly 70,000 more deaths from COVID-19 than have the counties representing the 20% of population where Biden performed best. Overall, the COVID-19 death rate in all counties Trump won in 2020 is substantially higher than it is in counties Biden won (as of the end of February 2022, 326 per 100,000 in Trump counties and 258 per 100,000 in Biden counties).

Partisan divide in COVID-19 deaths widened as more vaccines became available

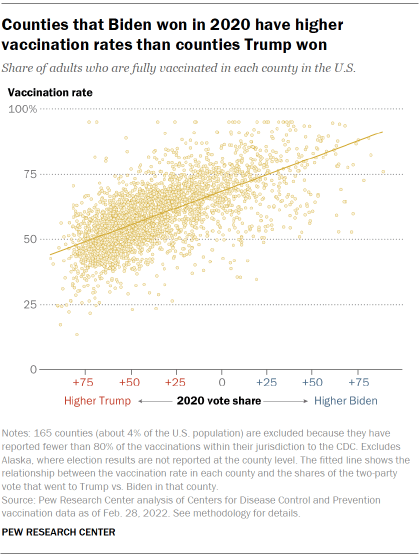
Partisan differences in COVID-19 death rates expanded dramatically after the availability of vaccines increased. Unvaccinated people are at far higher risk of death and hospitalization from COVID-19, according to the Centers for Disease Control and Prevention, and vaccination decisions are strongly associated with partisanship. Among the large majority of counties for which reliable vaccination data exists, counties that supported Trump at higher margins have substantially lower vaccination rates than those that supported Biden at higher margins.

Counties with lower rates of vaccination registered substantially greater death rates during each wave in which vaccines were widely available.

Chart shows counties that Biden won in 2020 have higher vaccination rates than counties Trump won

During the fall of 2021 (roughly corresponding to the delta wave), about 10% of Americans lived in counties with adult vaccination rates lower than 40% as of July 2021. Death rates in these low-vaccination counties were about six times as high as death rates in counties where 70% or more of the adult population was vaccinated.

More Americans were vaccinated heading into the winter of 2021 and 2022 (roughly corresponding to the omicron wave), but nearly 10% of the country lived in areas where less than half of the adult population was vaccinated as of November 2021. Death rates in these low-vaccination counties were roughly twice what they were in counties that had 80% or more of their population vaccinated. (Note: The statistics here reflect the death rates in the county as a whole, not rates for vaccinated and unvaccinated individuals, though individual-level data finds that death rates among unvaccinated people are far higher than among vaccinated people.)

Source: The Changing Political Geography of COVID-19 Over the Last Two Years

One in 10 Black people living in the U.S. are immigrants, new study shows

By way of comparison, the percent of Blacks in Canada who are immigrants is 52 percent:

The demographics of America’s Black population are in the middle of a major shift, with 1 in 10 having been born outside the United States. That’s 4.6 million Americans, a figure that is projected to grow to 9.5 million by 2060, according to the findings of a Pew Research Center study published Thursday.

“When we talk about the nation’s Black population, we have to understand it is one that is changing and becoming even more diverse than it already was, and immigrants are a big part of that story and so the immigrant experience is a growing part of the experience of Black Americans today,” said Mark Lopez, Pew’s director of race and ethnicity research.

Black immigrants and their American-born children make up 21 percent of the nation’s Black population, with an increasing number of migrants coming from Africa, according to the report. Lopez said it’s a group that often is overlooked in discussions about immigration.

Source: One in 10 Black people living in the U.S. are immigrants, new study shows

Diversity and Division in Advanced Economies

Another informative survey by Pew. Canada tends to have lower perceptions of conflict than the median (as one would expect) except for urban/rural:

Wide majorities in most of the 17 advanced economies surveyed by Pew Research Center say having people of many different backgrounds improves their society. Outside of Japan and Greece, around six-in-ten or more hold this view, and in many places – including Singapore, New Zealand, the United States, Canada, the United Kingdom, Australia and Taiwan – at least eight-in-ten describe where they live as benefiting from people of different ethnic groups, religions and races.

Chart showing increasing shares see diversity positively

Even in Japan and Greece, the share who think diversity makes their country better has increased by double digits since the question was last asked four years ago, and significant increases have also taken place in most other nations where trends are available.

Alongside this growing openness to diversity, however, is a recognition that societies may not be living up to these ideals: In fact, most people say racial or ethnic discrimination is a problem in their society. Half or more in almost every place surveyed describe discrimination as at least a somewhat serious problem – including around three-quarters or more who have this view in Italy, France, Sweden, the U.S. and Germany. And, in eight surveyed publics, at least half describe their society as one with conflicts between people of different racial or ethnic groups. The U.S. is the country with the largest share of the public saying there is racial or ethnic conflict.

Chart showing perceptions of conflict between groups much higher in South Korea and U.S., especially between those who support different political parties

Notably, however, in most societies racial and ethnic divisions are not seen as the most salient cleavage. Rather, in the majority of places surveyed, more people identify conflicts between people who support different political parties than conflicts between people with different ethnic or racial backgrounds. Political divisions are also seen as greater than the other two dimensions tested: between those with different religions and between urban and rural residents. (For more on the actual composition of each public surveyed on each of these dimensions, see Appendix A.)

In the U.S. and South Korea, 90% say there are at least strong conflicts between those who support different parties – including around half or more in each country who say these conflicts are very strong. In Taiwan, France and Italy, around two-thirds say the political conflicts in their society are strong. Still, in around half of the surveyed publics, fewer than 50% say the same.

Chart showing around half or more in several publics say people do not agree on basic facts

In some places, this acrimony has risen to the level that people think their fellow citizens no longer disagree simply over policies, but also over basic facts. In France, the U.S., Italy, Spain and Belgium, half or more think that most people in their country disagree on basic facts more than they agree. Across most societies surveyed, those who see conflict among partisans are more likely to say people disagree on the basic facts than those who do not see such conflicts.

Views on the topic are also closely related to views of the governing party or parties in nearly every society (for more on how governing party is defined, see Appendix B). In every place but the U.S. and Italy, those with unfavorable views of the governing coalition are more likely to say most people disagree on the basic facts than those with favorable views of the government.

Chart showing views of COVID-19’s effect on unity factor into views of political conflict

Although divisions between racial and ethnic groups as well as between partisans are palpable for many, other types of conflicts are less commonly perceived. For example, in no place surveyed does a majority think there are strong conflicts between people who live in cities and people who live in rural areas. Similarly, only a minority in most countries say there are divisions between people who practice different religions – though around half or more do sense such conflicts in South Korea, France and the U.S.

Beyond divisions between specific groups, there is also a widespread – and growing – sense that societies are more divided now than they were before the COVID-19 pandemic. A median of 61% across the 17 advanced economies say they are now more divided than before the outbreak, and in all but one of the 13 countries also polled in summer 2020, the sense that societies are more divided than united has risen significantly since last year. Those who describe their society as more divided than before the global health emergency are also significantly more likely to see conflicts between different groups in society and to say their fellow citizens disagree over basic facts.

Source: Diversity and Division in Advanced Economies

Pew Research: Views of Muslims in the US, 20 years after 9/11

Of interest:

An unprecedented amount of public attention focused on Muslim Americans in the wake of the terrorist attacks of Sept. 11, 2001. The U.S. Muslim population has grown in the two decades since, but it is still the case that many Americans know little about Islam or Muslims, and views toward Muslims have become increasingly polarized along political lines.

There were about 2.35 million Muslim adults and children living in the United States in 2007 – accounting for 0.8% of the U.S. population – when Pew Research Center began measuring this group’s size, demographic characteristics and views. Since then, growth has been driven primarily by two factors: the continued flow of Muslim immigrants into the U.S., and Muslims’ tendency to have more children than Americans of other faiths.

In 2015, the Center projected that Muslims could number 3.85 million in the U.S. by 2020 – roughly 1.1% of the total population. However, Muslim population growth from immigration may have slowed recently due to changes in federal immigration policy.

The number of Muslim houses of worship in the U.S. also has increased over the last 20 years. A study conducted in 2000 by the Cooperative Congregational Studies Partnership identified 1,209 mosques in the U.S. that year. Their follow-up study in 2011 found that the number of mosques had grown to 2,106, and the 2020 version found 2,769 mosques – more than double the number from two decades earlier.

How we did this

Alongside their population growth, Muslims have gained a larger presence in the public sphere. For example, in 2007, the 110th Congress included the first Muslim member, Rep. Keith Ellison, D-Minn. Later in that term, Congress seated a second Muslim representative, Rep. Andre Carson, D-Ind. The current 117th Congress has two more Muslims alongside Carson, the first Muslim women to hold such office: Reps. Ilhan Omar, D-Minn., and Rashida Tlaib, D-Mich., first elected in 2018.

As their numbers have increased, Muslims have also reported encountering more discrimination. In 2017, during the first few months of the Trump administration, about half of Muslim American adults (48%) said they had personally experienced some form of discrimination because of their religion in the previous year. This included a range of experiences, from people acting suspicious of them to being physically threatened or attacked. In 2011, by comparison, 43% of Muslim adults said they had at least one of these experiences, and 40% said this in 2007.

A bar chart showing that Americans are more likely to say Muslims face discrimination than to say this about other religions

In a March 2021 survey, U.S. adults were asked how much discrimination they think a number of religious groups face in society. Americans were more likely to say they believe Muslims face “a lot” of discrimination than to say the same about the other religious groups included in the survey, including Jews and evangelical Christians. A similar pattern appeared in previous surveys going back to 2009, when Americans were more likely to say that there was a lot of discrimination against Muslims than to say the same about Jews, evangelical Christians, Mormons or atheists.

A series of Pew Research Center surveys conducted in 2014, 2017, and 2019 separately asked Americans to rate religious groups on a scale ranging from 0 to 100, with 0 representing the coldest, most negative possible view and 100 representing the warmest, most positive view. In these surveys, Muslims were consistently ranked among the coolest, along with atheists.

Over the last 20 years, the American public has been divided on whether Islam is more likely than other religions to encourage violence, and a notable partisan divide on this question has emerged. When the Center first asked this question on a telephone survey in 2002, Republicans and Republican-leaning independents were only moderately more likely than Democrats and Democratic leaners to say that Islam encourages violence more than other religions – and this was a minority viewpoint in both partisan groups. Within a few years, however, Republicans began to grow more likely to believe that Islam encourages violence. Democrats, in contrast, have become more likely to say Islam does not encourage violence. Now, Republicans are far more likely than Democrats to say they believe Islam encourages violence more than other religions.

Though many Americans have negative views toward Muslims and Islam, 53% say they don’t personally know anyone who is Muslim, and a similar share (52%) say they know “not much” or “nothing at all” about Islam. Americans who are not Muslim and who personally know someone who is Muslim are more likely to have a positive view of Muslims, and they are less likely to believe that Islam encourages violence more than other religions.

Source: Views of Muslims in the US, 20 years after 9/11

Key facts about the changing U.S. unauthorized immigrant population

Useful information and context:

Border Patrol apprehensions of migrants at the U.S.-Mexico border are on the rise again. Although the majority of people attempting to enter the United States illegally are stopped, this trend could foreshadow an increase in the U.S. unauthorized immigrant population after years of relative stability. Yet the activity at the southwestern U.S. border is only one part of the overall story of unauthorized immigration, as a growing share of this population came from regions other than Mexico or Central America and entered the U.S. legally but overstayed their visas.

The unauthorized immigrant population is always changing and churning. The total number in the country can remain stable or decline even as new immigrants enter illegally or overstay a visa, because some voluntarily leave the country, are deported, die or become lawful residents. In short, the dynamic nature and pace of migration patterns has resulted in an unauthorized immigrant population whose size and composition has ebbed and flowed significantly over the past 30 years.

Here are key facts about this population and its dynamics.

How we did this
Number of unauthorized immigrants in the U.S. has declined since 2007

The U.S. unauthorized immigrant population rose rapidly from 1990 to 2007 before declining sharply for two years and stabilizing at 10.5 million in 2017.Pew Research Center’s most recent estimate is well below a peak of 12.2 million in 2007, but roughly triple the estimated 3.5 million in 1990. The estimate includes 1.5 million or more people who have temporary permission to stay in the U.S. through programs such as Deferred Action for Childhood Arrivals (DACA) and Temporary Protected Status (TPS), as well as people awaiting decisions on their asylum applications; most could be subject to deportation if government policy changed.

U.S. unauthorized immigrant populations declined or held steady for most regions of birth since 2007

Mexican unauthorized immigrants are no longer the majority of those living illegally in the U.S. As of 2017, 4.9 million unauthorized immigrants in the U.S. were born in Mexico, while 5.5 million were from other countries, the first time since at least 1990 that those from Mexico (47% in 2017) were not a majority of the total. In 2007, an estimated 6.9 million unauthorized immigrants were Mexican, and 5.3 million were born in other countries. The population of Mexican-born unauthorized immigrants declined after 2007 because the number of newly arrived unauthorized immigrants from Mexico fell dramatically – and as a result, more left the U.S. than arrived.

The number of unauthorized immigrants from nations other than Mexico ticked up between 2007 and 2017, from 5.3 million to 5.5 million. The population of unauthorized immigrants born in Central America and Asia increased during this time, while birth regions of South America and Europe saw declines. There was not a statistically significant change among other large regions, including the Caribbean, Middle East-North Africa and sub-Saharan Africa.

A rising share of U.S. unauthorized immigrants apparently arrived in the country legally but overstayed their visas. Nearly all people apprehended while attempting to enter the country illegally at the U.S.-Mexico border are from either Mexico or Central America. This stands in contrast to the origins of visa overstays.

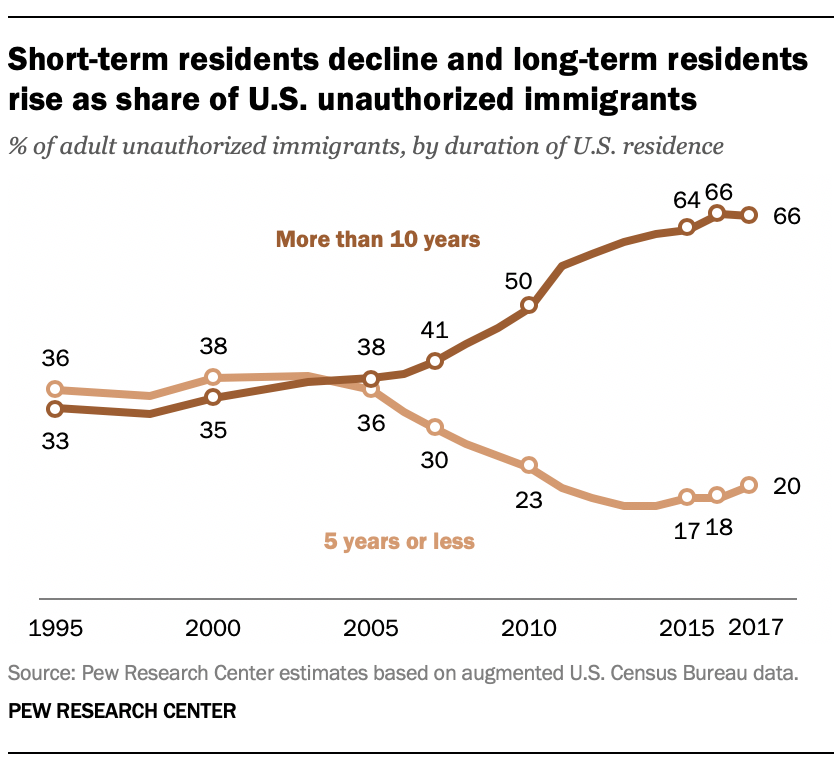
In recent years, immigrants from countries outside of Mexico and Central America accounted for almost 90% of overstays, and in 2017, there were more than 30 overstays for every border apprehension for these countries. Although the Census Bureau data Pew Research Center uses to estimate the size of the unauthorized immigrant population does not indicate directly whether someone arrived with legal status, the origin countries of immigrants in these sources provide indirect evidence. From 2007 to 2017, the share of newly arrived unauthorized immigrants (those in the U.S. five years or less) from regions other than Central America and Mexico – the vast majority of whom are overstays – increased from 37% to 63%. At the same time, the share of new unauthorized immigrants from Mexico fell from 52% to 20%.

Short-term residents decline and long-term residents rise as share of U.S. unauthorized immigrants

The decline in the arrival of new unauthorized immigrants in recent years has resulted in a population that is increasingly settled in the U.S. About two-thirds of unauthorized immigrants (66%) had lived in the U.S. for more than 10 years as of 2017, up from 41% 10 years earlier. Conversely, newly arrived unauthorized immigrants (those in the U.S. five years or less) accounted for 20% of the unauthorized immigrant population in 2017 versus 30% in 2007. For Mexicans, the pattern is even more pronounced. The vast majority (83%) of unauthorized immigrants from Mexico have been in the country more than 10 years, while only 8% have lived in the U.S. for five years or less.

Source: Key facts about the changing U.S. unauthorized immigrant population

How Hispanics see themselves varies by number of generations in US

Interesting how identity changes over generations, not atypical for many with immigrant ancestry:

The terms Hispanics in the United States use to describe themselves can provide a direct look at how they view their identity and how the strength of immigrant ties influences the ways they see themselves. About half of Hispanic adults say they most often describe themselves by their family’s country of origin or heritage, using terms such as Mexican, Cuban, Puerto Rican or Salvadoran, while another 39% most often describe themselves as “Hispanic” or “Latino,” the pan-ethnic terms used most often to describe this group in the U.S.

The terms Latinos use to describe their identity differ across immigrant generations

Meanwhile, 14% say they most often call themselves American, according to a national Pew Research Center survey of Hispanic adults conducted in December 2019.

The use of these terms varies across immigrant generations and reflects their diverse experiences. More than half (56%) of foreign-born Latinos most often use the name of their origin country to describe themselves, a share that falls to 39% among the U.S.-born adult children of immigrant parents (i.e., the second generation) and 33% among third- or higher-generation Latinos.

How we did this

Meanwhile, the share who say they most often use the term “American” to describe themselves rises from 4% among immigrant Latinos to 22% among the second generation and 33% among third- or higher-generation Latinos. (Only 3% of Hispanic adults use the recent gender-neutral pan-ethnic term Latinx to describe themselves. In general, the more traditional terms Hispanic or Latino are preferred to Latinx to refer to the ethnic group.)

The U.S. Hispanic population reached 60.6 million in 2019. About one-third (36%) of Hispanics are immigrants, according to a Pew Research Center analysis of U.S. Census Bureau data. Another third of Hispanics are second generation (34%) – they are U.S. born with at least one immigrant parent. The remaining 30% of Hispanics belong to the third or higher generations, that is, they are U.S. born to U.S.-born parents.

A large majority of Hispanics who are third or higher generation see themselves as typical Americans

The December 2019 survey also finds U.S. Hispanics are divided on how much of a common identity they share with other Americans, though views vary widely by immigrant generation. About half (53%) consider themselves to be a typical American, while 44% say they are very different from a typical American. By contrast, only 37% of immigrant Hispanics consider themselves a typical American. This share rises to 67% among second-generation Hispanics and to 79% among third-or-higher-generation Hispanics – views that partially reflect their birth in the U.S. and their experiences as lifelong residents of this country.

Speaking Spanish seen as a key part of Hispanic identity

What it means to be Hispanic can vary across the group. Hispanics most often say speaking Spanish is an essential part of what being Hispanic means to them, with 45% saying so. Other top elements considered to be part of Hispanic identity include having both parents of Hispanic ancestry (32%) and socializing with other Hispanics (29%). Meanwhile, about a quarter say having a Spanish last name (26%) or participating in or attending Hispanic cultural celebrations (24%) are an essential part of Hispanic identity. Lower shares say being Catholic (16%) is an essential part of Hispanic identity. (A declining share of U.S. Hispanic adults say they are Catholic.) Just 9% say wearing attire that represents their Hispanic origin is essential to Hispanic identity.

The importance of most of these elements to Hispanic identity decreases across generations. For example, 54% of foreign-born Hispanics say speaking Spanish is an essential part of what being Hispanic means to them, compared with 44% of second-generation Hispanics and 20% of third- or higher-generation Hispanics.

For U.S. Hispanics, speaking Spanish is the most important part of Hispanic identity across immigrant generations

Most Latinos feel at least somewhat connected to a broader Hispanic community in the U.S.

About six-in-ten Hispanic adults say what happens to other Hispanics affects what happens in their own lives

For U.S. Latinos, the question of identity is complex due to the group’s diverse cultural traditions and countries of origin. Asked to choose between two statements, Latinos say their group has many different cultures rather than one common culture by more than three-to-one (77% vs. 21%). There are virtually no differences on this question by immigrant generation among Latinos.

Few Hispanics report a strong sense of connectedness with other Hispanics, with only 18% saying what happens to other Hispanics in the U.S. impacts them a lot and another 40% saying it impacts them some. Immigrant Hispanics (62%) are as likely as those in the second generation (60%) to express a sense of linked fate with other Hispanics. This share decreases to 44% among the third or higher generation.

Note: Here are the questions used for this report, along with responses, and its methodology.

Source: How Hispanics see themselves varies by number of generations in US