Have forthcoming analysis of the 2024-25 EE desegregated data, representation, hirings, separations, promotions that demonstrates that no negative impact compared to the previous year. So warnings may be overstated and public service may already considering equity impact:
As the public service moves to shed thousands of jobs, unions and a newly formed national coalition say equity gains may be more fragile than they appear, and warn leaving departments to monitor representation creates a “serious gap” in tracking where the cuts fall.
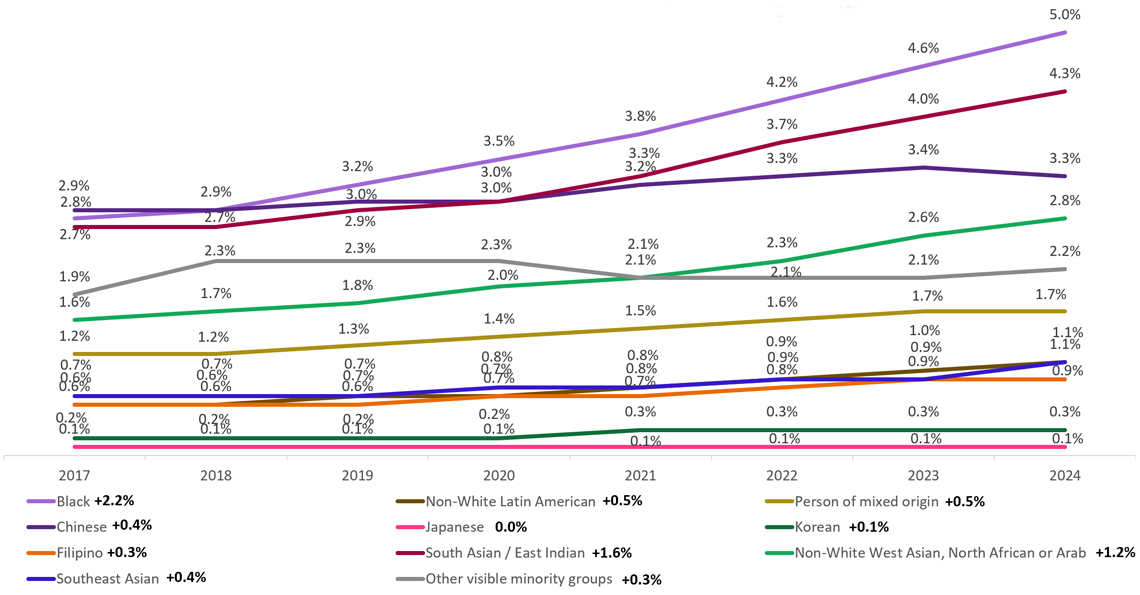
The federal public service entered 2026 looking more representative than it did a decade ago, according to the government’s latest Employment Equity Annual Report. The March report showed racialized workers made up 23.9 per cent of the core public administration in 2024-25, slightly above the 22.7 per cent workforce-availability benchmark. Black employees accounted for 5.1 per cent of the public service, up from 2.8 per cent in 2016-17.
Unions and advocates say the latest report can offer a useful snapshot, but it may not fully capture if employment equity efforts have been damaged. Their concern is less about whether the public service still looks representative on paper than about which workers are most exposed as job cuts deepen.
A newly formed group, the National Employment Equity Council, is calling on the government to require mandatory equity impact assessments before any further staffing decisions. Nicholas Marcus Thompson, its co-chair, warns the government’s current approach means signs of inequities tied to job losses may arrive “too late.”
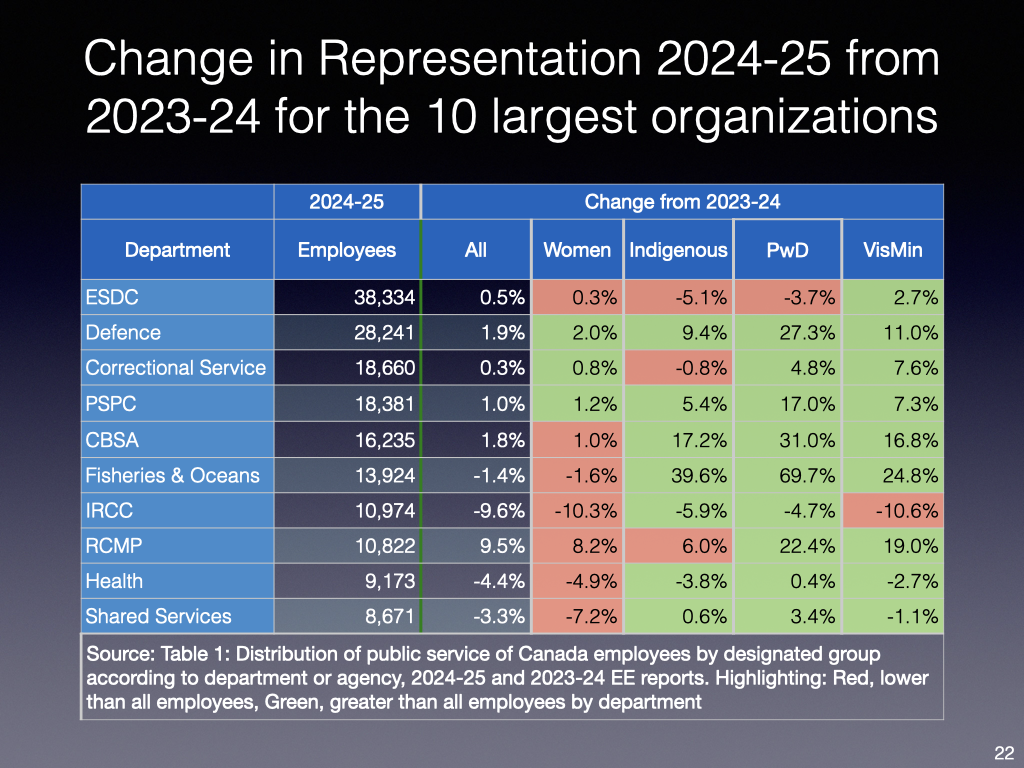
Andrew Griffith, a former senior federal official who has analyzed Treasury Board employment equity data for years, said the latest data does not support the conclusion that racialized public servants are being disproportionately harmed.
Representation of visible minorities rose slightly in 2024–25, while hiring rates for visible minorities and Indigenous staff remained above their internal representation.
Still, advocates say the TBS response to The Hill Times suggests a worrying approach.
“This doesn’t address the concern,” Thompson said by email.
“It leaves departments to monitor themselves, with no central tracking, under a law the government has acknowledged is outdated. That’s how inequities continue, and by the time we see it, it’s too late.”…
The council’s central demand is implementation of the 2023 Employment Equity Act Task Force report, including formal recognition of Black workers and 2SLGBTQI+ people as distinct designated groups under the law.
For Thompson, one of the most urgent unresolved issues is how Black workers remain folded into the broader visible minorities category. Under that approach, the government can meet aggregate targets while leaving subgroup disparities untouched, he argued.
“When it is lumped in with everyone else, Black people almost always get left behind,” Thompson said.
Due to ongoing cuts, Thompson said Black workers contacting the council have described fear, declining trust in internal systems, and frustration with what they see as a lack of clarity and transparency in how restructuring decisions are being made….
The most recent report on diversity in the public service says hiring dipped by 40 per cent last year as the bureaucracy began reversing course on a decade of significant growth. But this appears to have had limited impact on equity efforts.
New data on employment equity in the federal public service shows initial attempts to shrink the population had a limited effect on the proportions of equity-seeking groups. But one expert on public policy and governance says coming job cuts are “agnostic” to these efforts, and a large public-sector union says the government isn’t doing enough to ensure diversity is maintained amid sweeping job cuts.
“I can’t see evidence that minority groups are being penalized compared to majority groups,” said Andrew Griffith, a former public servant who was a director general of citizenship and multiculturalism at then-Citizenship and Immigration Canada….
Griffith noted concerns about job cuts in the public service hampering progress in employment equity, but so far that doesn’t seem to be the case.
“Now, it might change in the current year, given the cutbacks are more significant this year,” said Griffith, referring to the approximately 24,000 public servants who have already received notice that their jobs might be at risk, and the some 9,000 jobs expected to be cut….
“The numbers don’t tell the whole story”: Turnbull
Lori Turnbull is a political science professor at Dalhousie University, a senior adviser at the Institute on Governance, and worked in the Privy Council Office from 2015 until 2017.
Speaking to The Hill Times, she said the high percentage of women “really makes it look like the public service is doing well,” in terms of equity among its ranks, but “that doesn’t really speak to what’s going on for other groups,” she said.
“I don’t think anybody would come away from that and think, ‘Oh, we better be worried because the share of women [being hired] decreased by three points,” Turnbull said, noting the high number of women in executive positions as well as the broader public service.
However, she noted the current spending review that is expected to shed thousands of jobs from the public service is “agnostic” to employment equity considerations.
“It just doesn’t really sound like there’s much co-ordination in that,” she said.
“The way they’re measuring [it] is by the numbers, by the money, and not by the function and the specific people,” she said.
“You get the numbers, and it doesn’t tell the whole story.”
Sean O’Reilly, president of the Professional Institute of the Public Service of Canada, one of the largest federal public service unions, said the government isn’t doing enough to protect equity-seeking groups from cuts.
“There are big concerns,” he said. “Some of the correlation we’ve seen in the past with cuts, and we fear that, we do fear that these groups will be unjustly affected by all these cuts.”
The federal public service continued to increase the number of women, Indigenous people, visible minorities, and people with disabilities in its ranks between 2023 and 2024, according to the latest report on employment equity. But as the federal public service now begins to shrink for the first time in over 10 years, some have raised concerns that job cuts will hamper progress for equity-seeking groups….
Of note and very likely (employment equity excerpt):
…Mr. Poilievre said he wanted to live in a country where people pay lower taxes and are burdened by fewer rules, but also where they “have freedom of speech, where they’re judged on their merits, not their ethnicity, gender, sexuality, etc., where parents have ultimate authority over what their kids learn about sexuality and gender, where we go after criminals not after hunters and sport shooters, where we rebuild our military to have strong standing in the world.”
The Liberal agenda of promoting diversity within the public service – gone. Protections for gender-diverse youth – gone. Efforts to combat discrimination in the criminal justice system – gone.
Pretty much every major element of the Liberal environmental, social and justice agenda – gone….
But there is a reason the Conservatives are so far ahead in the polls. Things don’t feel right. Even the most fervent supporter of open immigration (and I am one) is alarmed by the out-of-control flood of people coming into the country. Inflation and high interest rates have lowered the standard of living for millions of people. The regulatory environment has become far too complex. And the Liberals have failed to persuade most of us that they get all this and are working to fix it….
Definitely worth a look, for the richness of the data as well the insights into the government’s diversity and inclusion priorities and how it stitches the narrative together with political and Canadian public priorities.
Intro has the key messages:
“Early Learning and Child Care, which is supporting better economic outcomes for women, by making it possible for more women to participate in the workforce, while securing access to quality child care and learning, thus contributing to positive childhood development and the future well-being of children.
The interim Canada Dental Benefit has helped hundreds of thousands of children get the oral health care they need, and once fully implemented in 2025, the new Canadian Dental Care Plan will improve the long-term health of 9 million Canadians, who may have previously been unable to visit an oral health professional due to the cost.
The National Action Plan to End Gender-Based Violence provides targeted action to protect Canadians who experience or are at risk of experiencing violence because of their sex, gender, gender identity, gender expression, or perceived gender.
The Federal 2SLGBTQI+ Action Plan advances the rights and equality for Two-Spirit, lesbian, gay, bisexual, transgender, queer, intersex, and other sexually and gender diverse people in Canada.
The Implementation of the National Action Plan to End the Tragedy of Missing and Murdered Indigenous Women and Girls is providing targeted, culturally-appropriate supports to Indigenous women, girls, and 2SLGBTQQIA people, while working to address the root causes of the violence they face.
In Budget 2024, the government is making investments to close the divide between generations. For younger Canadians, the government is taking new action to reduce tax advantages that benefit the wealthy, is investing to build more homes, faster, is strengthening Canada’s social safety net, and is boosting productivity and innovation to grow an economy with better-paying opportunities.
These efforts will improve the lives of all younger Canadians, and their impacts will be greatest for lower-income and marginalized younger Canadians, who will benefit from new pathways to unlock a fair chance at building a good middle class life.
This starts with a focus on housing. Resolving Canada’s housing crisis is critical for every generation and the most vulnerable Canadians. The government is building more community housing to make rent more affordable for lower-income Canadians, including through:
The $618.2 million Federal Community Housing Initiative;
The $15 billion Affordable Housing Fund, including a $1 billion top-up in Budget 2024;
The $1.5 billion Co-Operative Housing Development Program; and,
The $4.4 billion Housing Accelerator Fund, including a $400 million top-up in
These investments provide Canadians and younger generations with opportunity ––finding an affordable home to buy or rent; having access to recreational spaces, amenities, and schools to raise families.
Having a place to call home creates a broad range of benefits. When survivors of domestic partner violence can find affordable housing, this creates a safe home base for their children to break cycles of violence and poverty. When Indigenous people can find affordable housing that meets their specific needs that means they can access culturalsupports to help heal from the legacy of colonialism. When persons with disabilities are able to find low-barrier or barrier-free housing, this enables them to utilize the entirety of their homes.
To ensure that young people and future generations benefit from continued actions for sustained and equitable prosperity for all, this budget makes key investments to guarantee access to safe and affordable housing, help Canadians have a good quality of life while dealing with rising costs, and provide economic stability through good-paying jobs and opportunities for upskilling.”
Interestingly, no mention of the employment equity task force and its recommendations, although it is mentioned in the Budget.
Immigration aspects are limited to “continued funding for immigration and refugee legal aid” (but the Budget has significant funding for immigration and reflects the government’s pivot away from unlimited temporary workers and international students and post 2015 ending annual increases).
The Budget also has a reference to “Permit the Financial Transactions and Reports Analysis Centre of Canada (FINTRAC) to disclose financial intelligence to provincial and territorial civil forfeiture offices to support efforts to seize property linked to unlawful activity; and, Immigration, Refugees and Citizenship Canada to strengthen the integrity of Canada’s citizenship process (with little to no detail).”
No surprise, but the 2019 and 2021 election platform commitments to eliminate citizenship fees remain unmet.
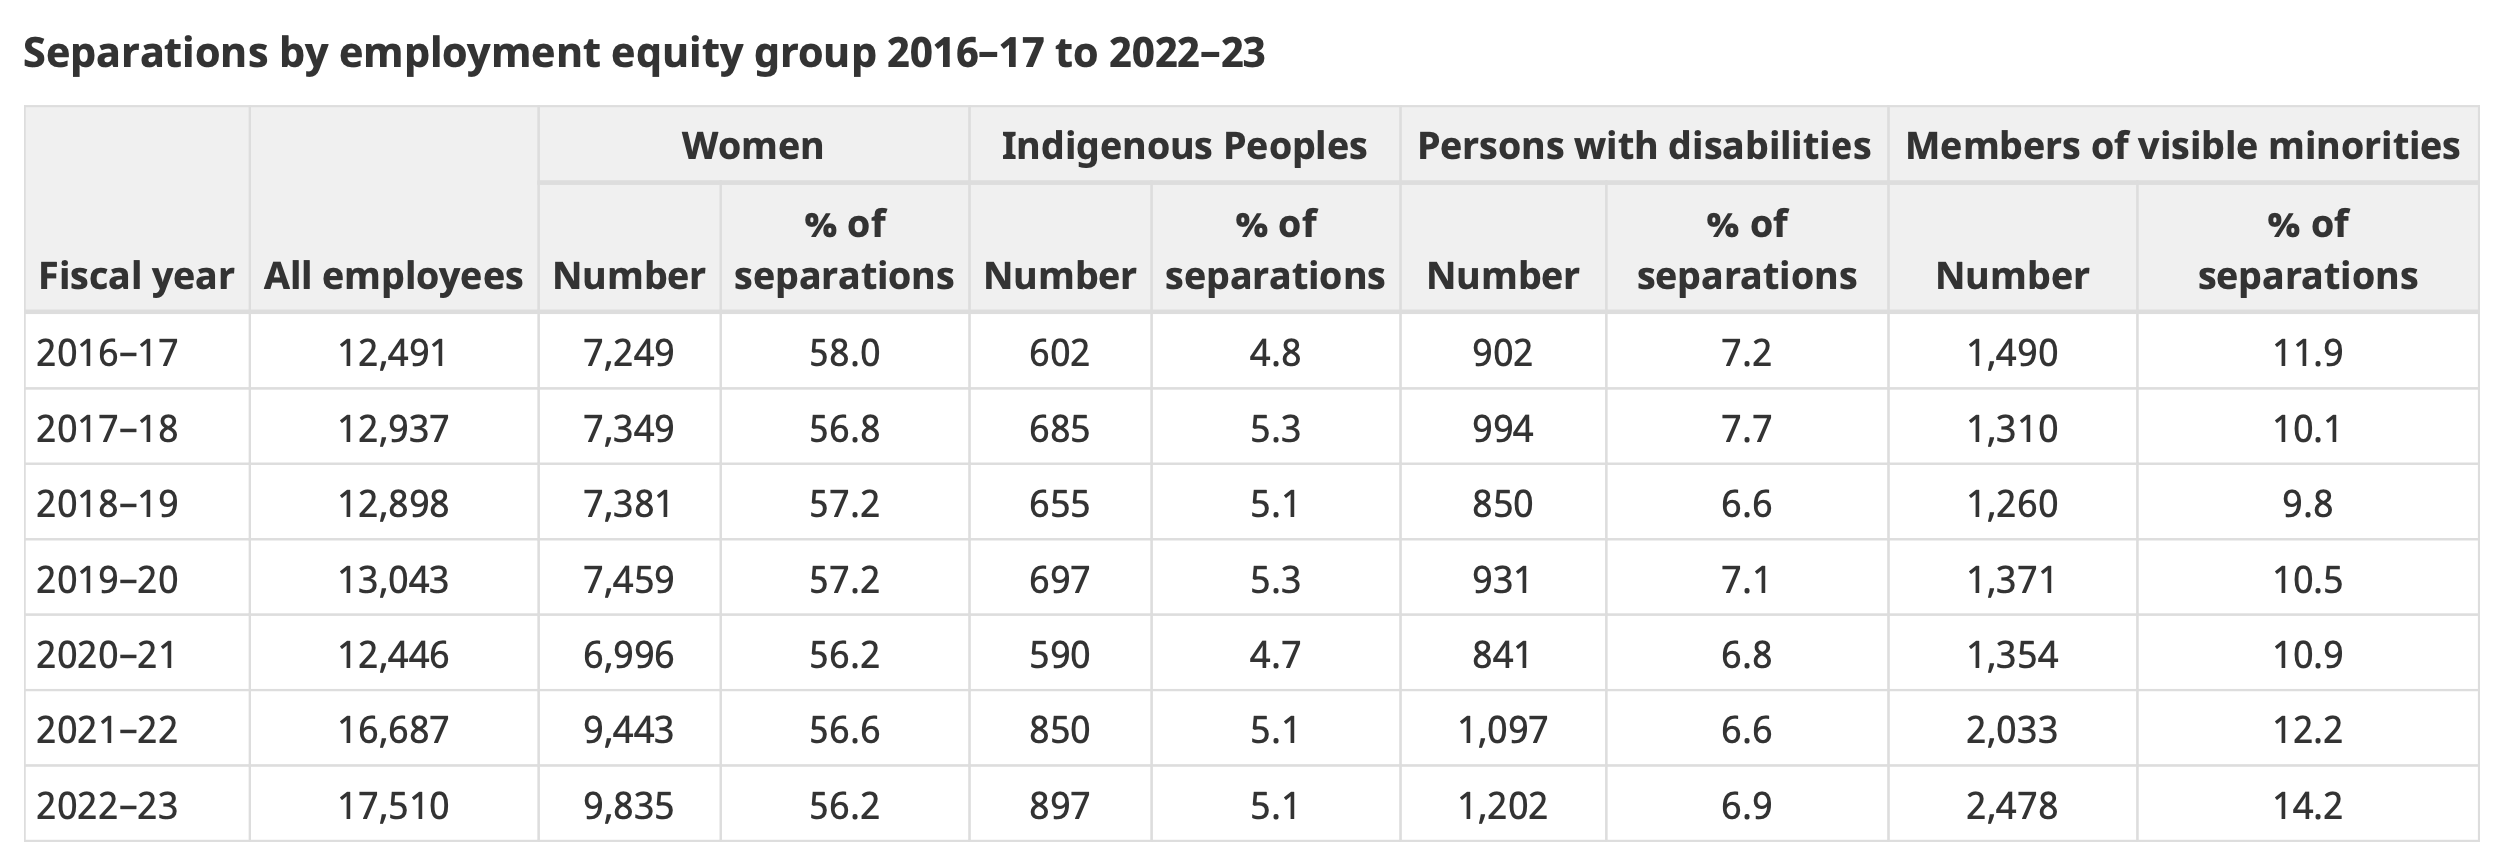
The Government’s proposed reduction in the public service by 5,000 public servants over four years (1,250 per year) is meaningless as the 2022-22 EE report shows annual separations more than 10 times that:
One thought that crossed my mind while browsing this close to 40 page document is whether this level of detail and effort would survive a change in government. Unlikely IMO, given the pressure to reduce spending and the CPC general aversion to excessive employment equity reporting and measures.
The latest report, with a range of additional information compared to previous reports: EX1-5 level breakdowns, more longer-term data sets, summary salary distribution, seven-year hiring, promotion and separation datasets, top five/bottom five occupational group etc. Overwhelming amount of data than needed for more general audiences but wonderful for nerds like myself.
In addition, TBS has implemented, on a provisory basis pending the revision to the EE Act, in this report separate equity group for Black public servants, as recommended by the EE Task Force. However, likely reflecting data issues, it has not done so for LGBTQ as also recommended by the Task Force, giving the impression of being a secondary priority and likely reflecting greater advocacy (Black Class Action class action etc).
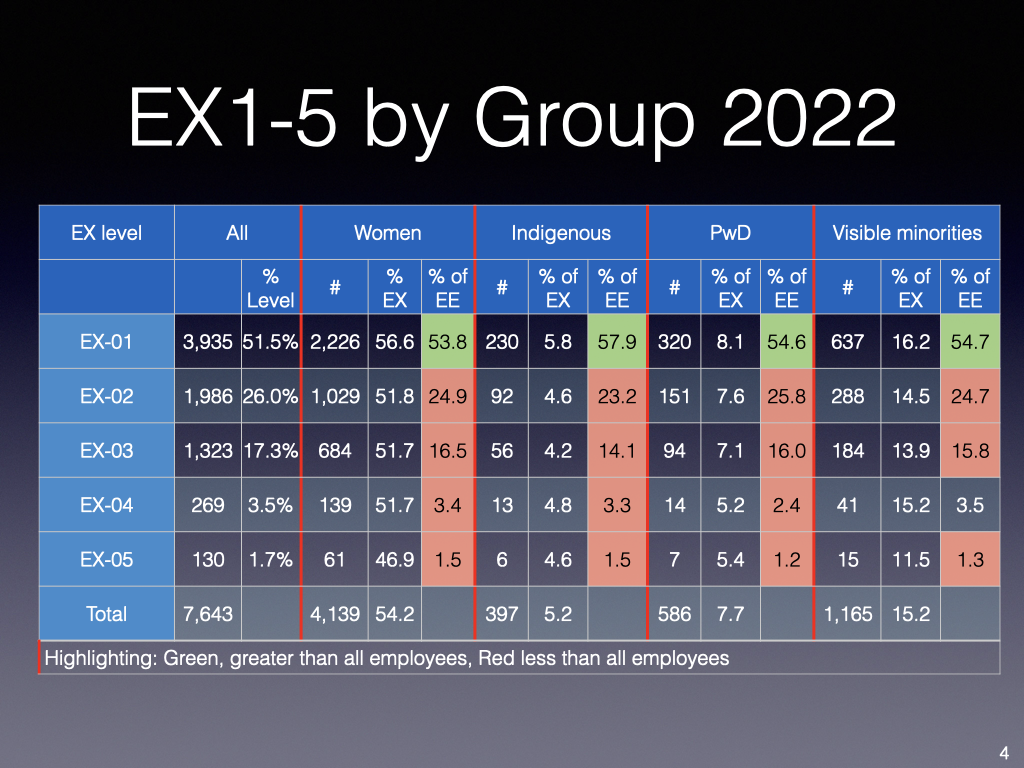
Needless to say, representation by EX level will likely provoke the most interest.
Figure 1 provides the overview numbers, with relatively small variations between the equity groups, with the expected pattern of greater representation at the EX-1 level with the exception of visible minorities at the EX4 level which match the general EX4 population.:
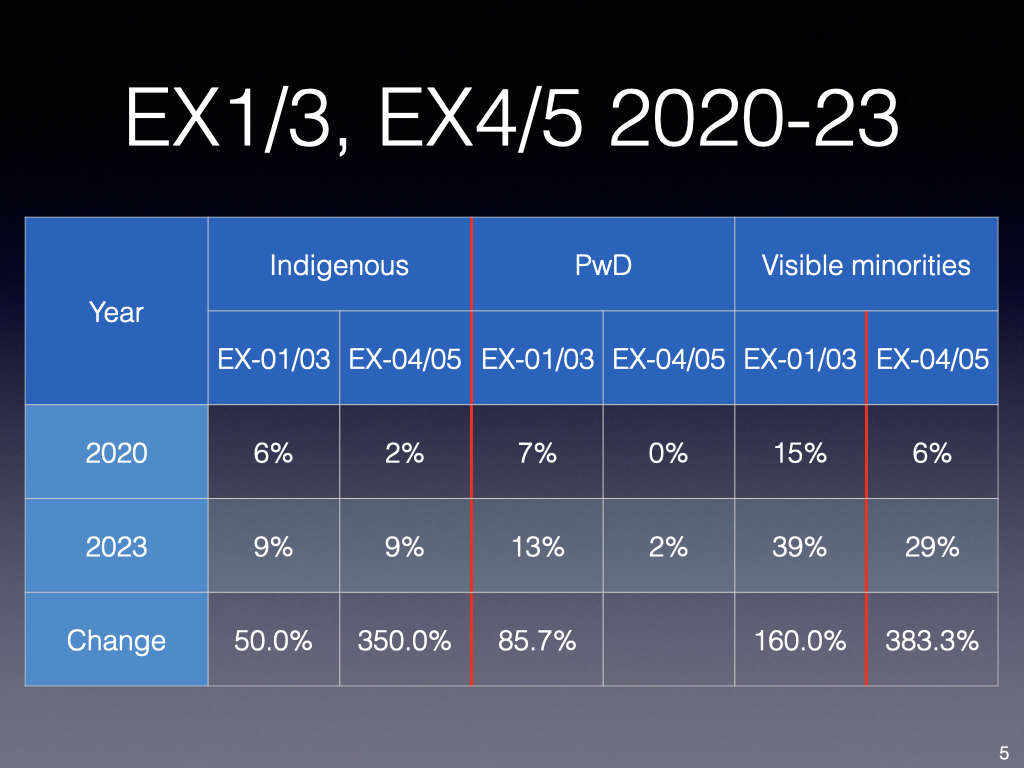
Figure 2 highlights the 2023-2020 comparison between junior and medium level EX (directors and DGs) and senior EX (ADMs), and the percentage increase during this period. The steep increase can likely be interpreted in part to the public service’s overall diversity efforts and the Clerk’s Action call:
Figure 3 compares all employees, all visible minorities, not Black employees, Black employees only and their respective distribution among EX categories, taking advantage of the new section on Black employees. To address the “less than 5” issue, I have collapsed the EX4 and EX5.
Only at the junior EX-01 level, do all three groups exceed the overall distribution. Non-Black visible minorities are more strongly represented than Black employees at all levels save for the EX-01 level, relatively minor but not insignificant.
By including this separate analysis of Black public servants, the report only highlights the limitations of such a carve-out.
My previous analyses of the past 6 years of disaggregated data highlighted the importance of comparisons among all visible minority groups with respect to Black public servants, given than their representation, hiring, promotion and separations are stronger than a number of other groups (How well is the government meeting its diversity targets? An intersectionality analysis). By being selective, this presents the situation of Black public servants as being worse than such comparative data demonstrates. I will be updating this hiring, promotion and separation analysis but do not expect the trend to differ.
On a general level, I was struck by the rapid year-over-year growth of the public service, from 236,133 to 253,411, or 7.3 percent.
Hardly sustainable and should the Conservatives win, as appears likely, the cuts will be deep and painful for the public service. Given that employment equity is unlikely to be a priority for such a government, this may be one of the last extensive and comprehensive reports (they were particularly lean during the Harper years). Should the Liberal government not pass new EE legislation during its mandate, unlikely that a Conservative government would given general ideological aversion, financial pressures and higher priorities.
This is quite an impressive website and analytical tool. Unlikely, IMO, to be of use to most job seekers but likely will be of use to stakeholders, governments and industry associations. Will be interesting in a year of so to get some web metrics on its use:
Every Canadian deserves a real and fair chance at success. Reducing pay gaps and improving representation means knocking down the barriers that hold back marginalized communities in the workplace. In order to do this, we need to know where the gaps are.
Today, Minister of Labour, Seamus O’Regan Jr., launched Equi’Vision, a new website that shines light on the barriers to equity experienced by women, Indigenous peoples, persons with disabilities, and members of visible minorities in federally regulated private sector industries. It provides user-friendly, easily comparable data on workforce representation rates and the pay gaps experienced by members of the four designated groups recognized under the Employment Equity Act. With Equi’Vision, Canada becomes the first country in the world to make this level of information publicly available.
Equi’Vision data is submitted by employers with 100 or more employees as part of their annual reporting to the Labour Program under the Employment Equity Act. Individual employee information, including data related to individual salaries, is not reported or disclosed.
Better information leads to better, more informed decision making. By making this information publicly available, the Government aims to draw attention to the persistent issues in Canadian workplaces that are maintaining pay gaps and preventing representation, so that businesses are encouraged to act upon them.
Reducing pay gaps and improving representation requires all partners – businesses, workers and government – joining together to help create safe and inclusive workplaces for all workers, because that’s where workers are at their best. That’s a good thing for our economy, and for all Canadians.