Visible minorities have difficulty accessing the labour market

While some interesting comparisons between Quebec and the rest of Canada, some of the methodology is odd. Why pick the 15-24 cohort given than many are in college or university rather than the 25-34 cohort which I and others use to avoid that issue.

While the general contrast between visible minorities and not visible minorities is valid, it ignores some of the equally significant differences between visible minority groups.

Still interesting to note the persistence of gaps between Quebec and Canada:

…More and more newcomers to the job market will be members of a visible minority. The case of young Canadian-born visible minorities merits special attention, with the goal of preventing their socioeconomic exclusion and the potential consequences for social cohesion.

In a context where Quebec and the rest of Canada rely on immigration to address the labour shortage, logic would dictate that we first realize the full potential of those already present. The integration into the workforce of Canadian-born individuals from ethnocultural minority groups, particularly the young, must be among the priorities of policymakers so as to avoid a situation where integration difficulties are passed on from one generation to the next. Failing this, a growing share of the population risks being marginalized.

Governments, the business community and all relevant stakeholders must work together on this in order to permanently eliminate the barriers hindering the economic integration of these young individuals and preventing them from fully contributing to the progress of society.

Source: Visible minorities have difficulty accessing the labour market

Immigrant families’ babies are healthier in poor neighbourhoods: study

Interesting findings, on the “healthy immigrant” effect and how that declines over time (a perverse form of integration):

In Ontario’s poorest neighbourhoods, newborns of non-refugee immigrant mothers face a lower risk of serious illness and death than those born to Canadian-born mothers, according to a study published in the Canadian Medical Association Journal on Monday.

Both immigration status and living in a low-income neighbourhood are associated with worse outcomes for newborns, write researchers from the University of Toronto, two Toronto hospitals, the Institute for Clinical Evaluative Sciences and the University of North Carolina-Chapel Hill.

However, while previous research has looked at the risk of adverse outcomes for newborns in low- versus high-income neighbourhoods, the study’s authors said it has overlooked the comparative risks for babies born to immigrant and non-immigrant parents living in similar low-income neighbourhoods.

“Efforts should be aimed at improving the overall health and well-being of all females residing in low-income areas, and at determining if the risk of adverse birth outcomes can be equitably reduced among immigrant and non-immigrant groups,” wrote co-author Jennifer Jairam.

To compare the risk of severe neonatal illness and death in immigrant- and non-immigrant-born infants, researchers looked at data on all live, in-hospital births of single babies from 20 to 42 weeks’ gestation between 2002 and 2019 in Ontario.

Ontario, they wrote, is the landing place for about 53 per cent of all female immigrants who enter Canada.

They measured severe neonatal illness or disease by looking at breathing support, intravenous fluid use, birth before 32 weeks’ gestation, very low birth weight and respiratory distress.

During the study period, there were 414,241 single babies born to 312,124 mothers aged 15 years and older living in low-income urban neighbourhoods. Of all the live births during this period, 148,050 were to mothers who had immigrated to Canada, and 266,191 to Canadian-born mothers. Most of the mothers who immigrated to Canada came from South Asia and the East Asia and Pacific regions and had lived in Ontario for less than 10 years.

Jairam and her team found the risk of severe neonatal illness and death for newborns of mothers who had immigrated to Canada was significantly lower than for newborns of Canadian-born mothers, at 49.7 per 1,000 live births compared with 65.6 per 1,000 live births.

However, they said that risk varied depending on the country of origin, with a higher risk of severe neonatal illness and death in newborns of immigrants from Jamaica and Ghana, and in those who had lived for a greater length of time in Ontario.

THE ‘HEALTHY IMMIGRANT EFFECT’

Rather than suggesting immigrant mothers and their newborns receive better care in Ontario than Canadian-born mothers and babies, the authors believe their findings might be explained by the “healthy immigrant” effect.

“Immigrant females who are healthier and more resilient may be most capable of migration; the immigration policy of a host country may preferentially select healthy immigrants,” wrote Dr. Joel Ray, a physician at St. Michael’s Hospital and one of the study’s co-authors, adding that, paradoxically, immigrants face greater barriers to health care access.

According to the researchers, the “healthy immigrant” effect wanes relative to the length of time an immigrant spends living in a new country.

Another explanation the researchers suggested is some immigrants have greater net income, educational achievement and health literacy than the average for a low-income neighbourhood.

Either way, Jairam, Ray and their co-authors said the study underscores the importance of paying attention to trends at the neighbourhood level so pregnant parents and babies in low-income communities can hope for better health outcomes.

Source: Immigrant families’ babies are healthier in poor neighbourhoods: study

Why the Children of Immigrants Are the Ones Getting Ahead in America

Good read, similar pattern in Canada for some visible minority groups. Likely explains in part the rise of populism:

In April 2020, the New York Times ran a special feature called “I Am the Portrait of Downward Mobility.” “It used to be a given that each American generation would do better than the last,” the piece began, “but social mobility has been slowing over time.”

In paging through the profiles, we couldn’t help noticing one group of Americans who defies this trend: the children of immigrants. Sonya Poe was born in a suburb of Dallas, Texas to parents who immigrated from Mexico. “My dad worked for a hotel,” Sonya recalled. “Their goal for us was always: Go to school, go to college, so that you can get a job that doesn’t require you to work late at night, so that you can choose what you get to do and take care of your family. We’re fortunate to be able to do that.”
[time-brightcove not-tgx=”true”]

The dream that propels many immigrants to America’s shores is the possibility of offering a better future for their children. Using millions of records of immigrant families from 1880 to 1940 and then again from 1980 to today, we find that the in past and still today children of immigrants surpass their parents and move up the economic ladder. If this is the American Dream, then immigrants achieve it—big time.

One pattern that is particularly striking in the data is that the children of immigrants raised in households earning below the median income make substantial progress by the time they reach adulthood, both for the Ellis Island generation a century ago and for immigrants today. The children of first-generation immigrants growing up close to the bottom of the income distribution (say, at the 25th percentile) are more likely to reach the middle of the income distribution than are children of similarly poor U.S.-born parents.

What’s more, no matter which country their parents came from, children of immigrants are more likely than the children of the U.S.-born to surpass their parents’ incomes when they are adults. This pattern holds both in the past and today, despite major changes in U.S. immigration policy over the past century, from a regime of nearly open borders for European immigrants in 1900 to one of substantial restrictions in recent decades. Children of immigrants from Mexico and the Dominican Republic today are just as likely to move up from their parents’ circumstances as were children of poor Swedes and Finns a hundred years ago.

Not only does upward mobility define the horizons of people’s lives, but it also has implications for the economy as a whole. Even immigrants who come to the U.S. with few resources or skills bring an asset that is hugely beneficial to the U.S. economy: their children. The rapid success of immigrants’ children more than pays for the debts of their parents.

To conduct our analysis, we needed data that links children to parents. For the historical data, we used historical census records to link sons living in their childhood homes to census data collected 30 years later when these young men had jobs of their own.

Think of us like curious grandchildren searching branches of their family tree online, but a million times over. We started by digging through websites like Ancestry.com that allow the public to search for their relatives. From here, we developed methods to automate these searches so we could follow millions of immigrants and their children in the records.

Our modern data is based on federal income tax records instead. The tax records allow researchers to link children to their parents as tax dependents, and then observe these children in the tax data as adults.

When we compiled this data, what do we see?

The first striking takeaway is that, as a group, children of immigrants achieve more upward mobility than the children of U.S.-born fathers. We focus on the children of white U.S.-born fathers because the children of Black fathers tend to have lower rates of upward mobility. So, the mobility advantage that we observe for the children of immigrants would be even larger if we compared this group to the full population.

The second notable takeaway is that even children of parents from very poor countries like Nigeria and Laos outperform the children of the U.S.-born raised in similar households. The children of immigrants from Central American countries—countries like Guatemala, El Salvador and Nicaragua that are often demonized for contributing to the “crisis” at the southern border—move up faster than the children of the U.S.-born, landing in the middle of the pack (right next to children of immigrants from Canada).

Our third finding is that the mobility advantage of the children of immigrants is just as strong today as it was in the past. What’s more, some of the immigrant groups that politicians accused long ago of having little to contribute to the economy—the Irish, Italians, and Portuguese—actually achieved the highest rates of upward mobility. For the past, we are only able to study sons because we cannot link daughters who change their name at marriage. But in the modern data we can see that this pattern applies to daughters as well.

Today, we might not be that surprised to learn that the children of past European immigrants succeeded. We are used to seeing the descendants of poor European immigrants rise to become members of the business and cultural elite. Many prominent leaders, including politicians like President Biden, regularly emphasize pride in their Irish or Italian heritage. But, at the time, these groups were considered the poorest of the poor. In their flight from famine, Irish immigrants are not too dissimilar from immigrants who flee hurricanes, earthquakes, and violent uprisings today.

We often hear concerns about how poor immigrants will fare and whether their children will get trapped in low-paying jobs or dependent on government support. But our data sleuthing should lay these fears to rest. The children of immigrants do typically make it in America. And it most often takes them only one generation to rise up from poverty.

One question that arises with our work is: what about children who arrive without papers? Undocumented children face more barriers to mobility than other children of immigrants. Fortunately, this group is relatively small even in recent years: only 1.5 million (or five percent) of the 32 million children of immigrant parents are undocumented today. Indeed, this number is small because many children of undocumented immigrants are born in the U.S. and thus are granted citizenship at birth.

The children in our data from countries like Mexico and El Salvador are those whose parents benefited from an earlier legalization effort in the mid-1980s. They are doing remarkably well now, and we believe that their counterparts today have this potential, as well. Children who arrive in the U.S. without papers face barriers to mobility—and not because they put in any less effort, but because they encounter obstacles all along their path. With a stroke of a pen, politicians can make that happen but, so far, this legislation has remained out of reach.

What enables the children of immigrants to escape poor circumstances and move up the economic ladder? The answer we hear most often is that immigrants have a better work ethic than the US-born and that immigrant parents put more emphasis on education.

We agree that the special features of immigrant families could be part of the story (although it’s hard to tell in our data). Yet when we crunched the numbers we found something surprising: immigrants tend to move to those locations in the U.S. that offer the best opportunities for upward mobility for their kids, whereas the U.S.-born are more rooted in place.

Generations of social science research has confirmed that where children grow up influences their opportunities in life. We find that immigrant parents are more likely than U.S.-born parents to settle in these high-opportunity areas, which are flush with good jobs and offer better prospects for mobility in the next generation. As striking proof that geography matters, we see that children of immigrants out-earn other children in a broad national comparison, but they do not earn more than other children who grew up in the same area. In terms of economic fortunes, the grown children of immigrants look similar to the children of U.S.-born parents who were raised down the block, or in the same town. This pattern implies that the primary difference between immigrant families and the families of the U.S.-born is in where they choose to live.

One implication of our findings is that it is very likely that U.S.-born families would have achieved the same success had they moved to such high-opportunity places themselves. In fact, we find that the children of U.S.-born parents who moved from one state to another have higher upward mobility than those who stayed put: their level of upward mobility is closer to (but not quite as high as) that of the children of immigrants who moved from abroad. So, you might ask: why don’t US-born families move out of a region when job opportunities dwindle?

Ironically, J.D. Vance (who is now running for Senate in Ohio on an anti-immigration platform) poses this question in his bestseller Hillbilly Elegy,aboutgrowing up in Middletown, Ohio, only 45 minutes from the border with Kentucky, the state where his family had lived for generations. For Vance, moving up the ladder meant moving out of his childhood community, a step that many Americans are unwilling to take. He went on to enlist in the Marines, and then to Ohio State and Yale Law School—“Though we sing the praises of social mobility,” he writes, “it has its downsides. The term necessarily implies a sort of movement—to a theoretically better life, yes, but also away from something.”

Vance is hitting on the cost of attaining upward mobility for children of U.S.-born parents. Many of the children of U.S.-born parents grow up in areas where their families settled long before, so economic mobility for them is often coupled with the costs of leaving home. By contrast, immigrants already took the step of leaving home to move to America, so they may be more willing to go wherever it takes within the country to find opportunity. In other words, U.S.-born families are more rooted in place, while immigrant families are more footloose—and this willingness to move toward opportunity seems to make all the difference.

Adapted from Abramitzky and Boustan’s new book Streets of Gold: America’s Untold Story of Immigrant Success

Source: Why the Children of Immigrants Are the Ones Getting Ahead in America

New research finds that preference for remaining is key to successful immigration: Turkish immigration in Germany study

Of interest:

New research finds that policies granting permanent residency to immigrants conditional on acquiring host country skills—like language—are most likely to generate higher fiscal contributions to the host country through income taxes. In fact, immigrants with a preference for remaining in the host country develop social contacts and other specific skills that allow them to find better paid jobs and stay for a longer time.

As immigration worldwide increases, host countries are faced with crucial policy decisions aimed at maximizing immigrants’ economic contributions. Designing the right policies requires understanding exactly how immigrants make their decision to migrate and return to their country of origin. Bocconi University, Milan, professors Jérôme Adda and Joseph-Simon Goerlach, with co-author Christian Dustmann (University College London), in a forthcoming article in The Review of Economic Studies, develop and estimate a that provides key insights into the decision-making process of immigrants. They find that immigrants’ expectations for the length of their stay and their location preferences can explain their decisions to invest in career improving skills, their acceptance of lower-paying jobs compared to natives, and how they respond to immigration policies on the duration and possibility of permanent residence.

While previous research focused only on productivity differences between immigrants to explain their career profiles, the authors argue that location preferences could be crucial in determining how much immigrants invest in acquiring skills that consequently impact their career profiles. For instance, an who prefers the host country and intends to stay permanently may invest more in learning the local language, familiarizing themselves with the local labor market, and developing social contacts and other host country-specific skills. Alternatively, a migrant with a location for their original country may not invest in these skills as they are likely undervalued back there. The authors model this preference and estimate the impact of location preferences and planned migration duration using data from surveys of Turkish immigrants in Germany over three decades, starting from 1961.

Indeed they find that immigrants who remain are higher-skilled due to their conscious investment in host-country skills. Their model is also able to explain why immigrants may be more willing to accept low-paid jobs compared to natives. They argue that immigrants from countries that have a lower price level and who want to return home would face higher effective wages since their wage allows them to consume more at home over their lifetime. Knowing this may encourage temporary migrants to accept lower-paid jobs.

The authors also use their model to compare three different types of prevalent today that grant permanent residency after 5 years either conditional on:

  1. An earning threshold (like the UK);
  2. Acquiring host-specific skills such as language (like in some countries of the EU);
  3. Granted randomly with 30% probability.

The authors find that scheme 1 selects for high productivity migrants and scheme 2 for those with a high preference for the host country.

Assuming a population of 25-year-olds migrating to Germany in 1970 as an example to estimate on, the earning threshold rule would generate an annual per capita increase in tax payments by €782 compared to if the policy wasn’t there. The host-specific skills rule would generate an average annual tax gain of €789 and fewer tax losses due to fewer individuals leaving the host country. The random lottery instead leads to a decrease in average annual taxes by €633 since the expected returns to investing in host country skills are reduced due to the scheme’s reliance on random chance. Furthermore, schemes 1 and 3, due to the barriers they pose to seeking permanent residency, reduce total immigration by about 26% whereas the host-specific skills rule does so by around 3%.

Thus, the authors show how these schemes could have differential impacts when one accounts for not only immigrants’ productivities but also their location preference / expected duration of stay. As the recent Ukrainian refugee crisis shows, such considerations are crucial for both the host countries’ goals as well as the lives and decisions of the arriving immigrants and their integration and acceptance in societies.

Source: New research finds that preference for remaining is key to successful immigration

U.S. Could Actually Use More Nigerian Immigrants

By way of comparison, there are about 52,000 persons of Nigerian ethnic ancestry in Canada (Census 2016), about 71 percent first generation. In the last 5 years (January 2015 to November 2019, about 37,000 new Nigerian permanent residents have been admitted (IRCC, open data). Average and median incomes are lower than the overall Canadian numbers. While participation levels are stronger, unemployment levels are higher. Like most recent immigrant groups, Nigerians are more highly educated than the Canadian average.

See article for the charts regarding Nigerians in the USA:

This column will not render a verdict on whether the White House decision last week to suspend immigration from Nigeria — the world’s seventh most-populous nation — and five other countries was mainly an expression of bigotry from an administration led by a man who once likened African nations to latrines, or if it was a legitimate reaction to security concerns. It will, however, tell you some things you might not know about Nigerian immigrants in the U.S.

To start, there’s a fair number of them (which is why I’m focusing on Nigeria and not Eritrea, Kyrgyzstan, Myanmar, Sudan or Tanzania, the other five countries hit by the new ban). An estimated 374,311 Nigerian-born people were living in the U.S. in 2018, which put the country in 27th place as a source of foreign-born Americans, behind Pakistan and ahead of Japan. These and a lot of the numbers to follow are based on the American Community Survey that the U.S. Census Bureau sends out to 3.5 million households every year, so they’re subject to margins of error (19,648 for the number cited above), plus the inevitable strengths and limitations of self-reported statistics.

For example, the Census Bureau says there were an estimated 462,708 people of Nigerian ancestry in the U.S. in the 2018, but that’s based on what people put on the survey, not the sort of genealogical investigation that would surely reveal that there are millions of Americans whose forebears were brought across the Atlantic against their will in past centuries from the region of West Africa that is now Nigeria. Still, for our purposes the census survey is probably better, in that it restricts the scope mostly to recent immigrants and their kids. The members of this group have more than doubled in number since 2007, and they are for the most part doing quite well.

Source: U.S. Could Actually Use More Nigerian Immigrants

Why Do Immigrants Outperform Native-Born Americans?

Some similarities in Canada:

Despite the hatred directed at immigrants and refugees coming to the United States and other western nations, a new report suggests that children of migrants are the ones realizing the upward mobility of the American dream, rising out of poverty at higher rates than the children of parents born in the US. Similar trends can be found in other parts of the world too, like Canada.

While the rich continue to get richer, and their offspring enjoy the advantages of an easy start in life, it is the people at the economic bottom where a parent’s migration history makes the real difference. A study by researchers at Stanford, Princeton, and the University of California at Davis is challenging pre-determined bias towards immigrants.

The team used millions of father-son pairs drawn from census data over 100 years of U.S. history to show that the children of immigrants are just as likely today as in the past to move out of poverty and into the middle-class. Further, the researchers report finding that, “both in the past and today, children of immigrants had greater chances of moving up in the income distribution relative to the children of US-born parents with comparable family income or occupation score. Second generation immigrants growing up in the 25th percentile end up 5–8 percentiles higher in the income rank than the children of the US born.”

It is not, as some ill-informed politicians have suggested, immigrants from Nordic countries who are most likely to experience this success. In fact, the sons of immigrants from China, India, and Vietnam are the ones mostly likely to be doing well, with even families that trace their roots back to Mexico, El Salvador and the Philippines showing better and steadier progress up the economic ladder than native-born Americans. Those Norwegians and Swedes are outflanked by their visible-minority peers.

At a time when we hear that the American dream is being threatened, we should celebrate that there are so many people experiencing the opportunities that come with education, strong social networks and parents who push their children to seek a better life. These young people are, if the data is accurate, much like the great grandparents of today’s less upwardly mobile populations who trace their roots back to Italy, Ireland and Portugal, all fair-skinned people that experienced the very same economic advantages of upward mobility decades ago.

What explains the difference? Why do the impoverished children of migrants outperform the impoverished children of native-born parents generation after generation?

The researchers attribute it partly to geography. Immigrants are more likely to settle in areas of their host country where there are more jobs and better educational opportunities. That is really no different than the ancestors of many native-born Americans who went to the coal mines of Virginia, the farms of Nebraska and the oil fields of Texas looking for work, only these days those places are experiencing job losses as a push towards less carbon-intensive industries and automation changes employment patterns. It is now Silicon Valley and the financial districts on the east coast that attract ambition.

While geography is one explanation, it is only one reason for the way immigrants find and exploit resources to enhance both their financial and mental wellbeing. Strong affiliations with other members of their diaspora has always been a way to ensure a cohesive economy where one member of a migrant community helps another find work, housing and navigate the intricacies of college applications and mortgage loans. The tighter the ex-pat community, the more resources are exchanged and the more success everyone enjoys.

Of course, grit, too, plays a role. Immigrants show a great deal of drive to succeed, and far more willingness to sacrifice for their children. While it is well-documented that migrants are often working in jobs where they are under-employed, the same is not true of children who are raised by families that value education and expect their children to study hard and graduate. These value systems distinguish any population that has had to struggle to survive. They are also the same characteristics that would have been found historically in the family trees of many of today’s native-born Americans who are, at least for the moment, securely anchored in the middle-class.

Before we demonize immigrants, it would be best if we looked at the science. As studies elsewhere in the world have shown, such as those by Daniel Hiebert in Canada, after just 20 years, immigrants and their children tend to match median incomes for their host countries and reach levels of home ownership and employment that are equal to, or above, the rates found among native-born populations.

Indeed, western nations like Canada that are now considering dramatic increases in immigration are ensuring that they enjoy the economic benefits of an upwardly mobile population with the personality traits and social skills to keep their GDP growing. Countries that resist immigration are forgetting lessons from the past and the spark of growth and innovation that immigrants brought to their economies. These psychological blinders, based on prejudice and a misunderstanding of economics, ignore the resilience of immigrant populations. If they are succeeding it is because they are adept at exploiting resources and exhibiting the ruggedness needed to rise out of poverty.

Source: Why Do Immigrants Outperform Native-Born Americans?

Greater share of recent immigrants landing jobs even as Canada welcomes more

So far, so good:

The share of recent immigrants of prime working age who had employment reached a new high last year, even though Canada has been opening its doors to more newcomers than ever before, according to an internal federal analysis.

The increase was likely driven in part by the country’s strong job-creation run, which has encouraged companies to hire more people who usually find themselves at the margins of the workforce, says the document prepared for Finance Minister Bill Morneau. Immigrants who arrived less than five years ago fall into that category.

The analysis provides a closer look at the impact of immigration on a labour force that has posted big gains in recent years.

After economic slowdown last winter the unemployment rate has hovered near 40-year lows. As a result, employers have reported challenges when trying to fill job vacancies.

“The performance of recent immigrants on the labour market has markedly improved in recent years, especially when considering the scale of immigrants arriving in Canada every year,” reads the January briefing note, obtained through access-to-information law.

The memo says the employment rate for immigrants aged 25 to 54 who landed less than five years ago, was 71 per cent last year. It was the indicator’s highest level since 2006 — which is as far back as the data goes.

“Similar trends are witnessed for immigrants that landed between five and 10 years ago,” the briefing said.

The labour-force participation and unemployment rates of recent immigrants were better than before the last recession, over a decade ago. Selection criteria have targeted immigrants with better earnings prospects and recent newcomers to Canada are more highly educated, the analysis said.

The share of prime-aged immigrants with post-secondary educations rose from 75 per cent in 2006 to 80 per cent in 2018. That’s nine percentage points higher than the share in the general population in the same age range.

Canada has welcomed more immigrants in recent years — and the government intends to bring in more. It has set targets of nearly 331,000 newcomers this year, 341,000 in 2020 and 350,000 in 2021.

The numbers are rising at a time of growing public debate about some aspects of immigration. It could become an issue in the lead-up to the October federal vote.

A lobby group representing chief executives of Canada biggest companies has urged political parties to avoid aggravating public concerns about immigration during the campaign.

Business leaders made clear the economic case in favour of immigration, especially as baby boomers age and the country seeks workers to help fund social programs, like public health care, through taxes.

The Finance Department document argues that, in general, immigrants in Canada have done well because the country has maintained a positive attitude towards immigration.

“The topic of immigration has become more polarized in a number of countries, which may reflect the poor socio-economic outcomes for immigrants and economic stagnation of the middle class who use immigration as a scapegoat,” it says.

“The economic benefits of immigration are largely dependent on how well newcomers integrate into the labour market. Increasing immigration — or any increase in the population — will drive demand for goods and services, contributing to economic growth.”

The document also noted the strong economic and education outcomes for second-generation Canadians, compared to children of two Canadian-born parents.

Among individuals aged 25 to 44, 95 per cent of second-generation Canadians had completed high school compared to 89 per cent of those whose parents were both Canadian-born. Forty-one per cent of second-generation Canadians had university degrees versus 24 per cent of people with two Canadian-born parents.

In 2017, second-generation Canadians earned average employment incomes of $55,500, versus $51,600 for children of Canadian-born parents.

Source: Greater share of recent immigrants landing jobs even as Canada welcomes more

How Syrian refugees to Canada have fared since 2015

Early indications for Syrian refugees. Given timing of Census (about a year after arrival), too early to draw definite conclusions. However the longer term analysis of refugee economic outcomes, broken down by private sponsorship and government selected, along with country of birth, are more interesting and informative:

The life of a refugee can be many things—dangerous, wearying, heart-rending, boring, nerve-racking, expensive and full of countless unexpected challenges to overcome. It also appears to be quite noisy.

Right now, for instance, the Kitchener, Ont., apartment of Jehad and Baraa Badr is cacophonous—much of it baby noise. Their older son, Hussam, has dropped by with grandson Zain for a playdate with a neighbour’s young child, who is also visiting. Younger son, Adam, makes his own contribution to the din. As do various electronic devices: some reminders for prayer time, others bringing texts and phone calls from friends and family. Rising above all this clamour, however, is Jehad’s exuberant account of the wonders of life in Canada, his gratitude for the help his family has received so far and his many plans for the future.

“I love being here. I love my friends. I love Canada,” he says loudly and with enthusiasm, his expressive body language making up for obvious struggles with language. “Good equality in Canada. Good government. No Syria government. No help.”

After spending three years in Egypt and Turkey—having left war-torn Syria behind in 2012—Jehad, Baraa and nine-year-old Adam arrived in southwestern Ontario in spring 2016 as part of the massive wave of Syrian refugees admitted into Canada following the last federal election. Hussam and his young family arrived a month later. Two other sons, however, will never arrive. Frustrated by the long wait in Egypt, they paid smugglers to take them across the Mediterranean Sea to Italy and then made their way to Austria, where they now live permanently.

This separation of their family is just one of the many tests the Badrs have had to endure since fleeing their homeland. As with the rest of the more than 50,000 Syrian refugees who have arrived in Canada since 2015, settling into Canadian society requires grappling with the many cultural nuances and obligations of their new home. But most significantly, it means mastering a new language and finding employment. “I need a job,” says Jehad, 59, in his halting, declarative style. “I need English. But job and school? Problem.” It is a problem with both personal and political implications.

If there was a single defining issue of the 2015 federal election, it was debate over the proper national response to the Syrian refugee crisis—a question seared into our collective consciousness by that heart-wrenching photo of young Syrian refugee Alan Kurdi’s lifeless body being carried away on a Turkish beach.

Demands for a political response to the humanitarian emergency immediately changed the course of the federal campaign. Prime Minister Stephen Harper said his government would take a total of 10,000 additional Syrian refugees—arguing that to accept any more would create security risks—while maintaining Canada’s military presence in the Middle East as a check on further crises. Liberal Leader Justin Trudeau upped this to 25,000 refugees by the end of the year, and vowed to withdraw our squadron of CF-18s. NDP Leader Thomas Mulcair topped both of his competitors by saying he’d accept 46,000 over several years, as well as end Canada’s military contribution.

In the end, Canadian voters apparently found Trudeau’s offer of 25,000 refugees the most persuasive. And while he failed to make good on his initial deadline, the Prime Minister’s goal was realized by mid-2016. Since then, the flow has slowed but is nowhere near stopping. The most recent count of Syrian refugees admitted into Canada since the election stands at 58,650, exceeding even Mulcair’s highest bid. For this effort, Canada has earned many admirers. “Thank God for Canada!” read a headline in the New York Times this year, lamenting the fact America under President Donald Trump had accepted only 12,000 Syrian refugees.

But taking in large numbers of refugees to widespread international acclaim is one thing. Integrating them successfully for their own happiness and well-being, and to prevent any urgent political or social issue, is quite another. With nativist sentiment rising around the world, and with the emergence of irregular refugees as a new hot-button political issue in the upcoming federal election, it seems both appropriate and necessary to check on the progress of the class of 2015/16. So how are Canada’s Syrian refugees doing?

Statistics Canada recently took a close look at that first cohort of 25,000 Syrian refugees who landed as of May 10, 2016. Employment is the most important metric by which to gauge the integration of refugees into Canadian society. And here the news seems rather disappointing. Only 24 per cent of adult male Syrian refugees were working, according to census data. For government-sponsored male refugees (as opposed to those sponsored by charities, churches or other private organizations), the employment rate was a mere five per cent. These figures are substantially below the 39 per cent average for male refugees from other countries. The gap between female Syrian refugees and those from other countries is equally significant: eight per cent versus 17 per cent.

Such low rates of employment are largely explained by the demographics and timing of the Syrian refugee cohort. In response to the humanitarian crisis, Canada adjusted its acceptance criteria to include more young families with children and fewer working-age males. Standards for language skills and education were also lowered. More than half the Syrian refugees could not speak an official language, compared to just 28 per cent of refugees from other countries. Among adults, less than half had even a high school diploma. (Neither Jehad nor Baraa Badr are high school graduates.)

For Bessma Momani, professor at the Balsillie School of International Affairs and senior fellow at the Centre for International Governance Innovation, the relatively poor performance of the Syrian refugees in finding work is entirely understandable given their profile. “Canada did a good job of targeting the most vulnerable people,” she says. “This group includes semi-skilled and mostly uneducated people. Some were also injured.” It makes sense that a group chosen for humanitarian reasons would take longer to find their footing in a new country than migrants selected for their employability, she says. Plus, it’s still early days. Many of the Syrian refugees had been in Canada for only a few weeks or months when the census was taken. It would be a supreme accomplishment for anyone to have found a job and learned a new language in such a short time.

As for political fears raised during the 2015 election about security risks and the national capacity to absorb such a large influx of refugees, Momani notes time has proven such claims misplaced. “Canada is a big country with a lot of capacity,” she says. “The debate between 10,000 and 25,000 was really just an arbitrary distinction since we have now taken in over 50,000.” And she highlights how popular providing aid to Syrian refugees proved to be among voters. “I think that surprised many Canadian politicians,” she adds.

Syria’s diaspora may no longer be the dominant political topic in Canada, but refugees remain a key election issue—except that now it’s marked by a growing note of skepticism. After years of pressure from federal Conservatives over the influx of more than 40,000 irregular refugees through unauthorized border crossings, mostly in Quebec, the Trudeau government is now adopting a much tougher stance toward these asylum seekers. The 2019 federal budget, for example, proposes to take away their right to a full refugee hearing; it also boosts funding for border measures to “detect and intercept individuals who cross Canadian borders irregularly.” These irregular border-crossers are mostly from Africa and the Caribbean, not the Middle East.

In another recent development signifying a change in mood toward refugees, the 2019 Ontario budget eliminates all legal aid funding for refugee and immigration programs.

As for the long-term consequences of Canada’s mostly generous approach to refugees, another recent StatsCan study looked at all 830,000 refugees who entered Canada between 1980 and 2009 and found their employment and earnings tend to improve slowly over time, but with some significant variations. Refugees who were privately sponsored seem to do better than those sponsored by the federal government, but this difference evaporates after about a decade.

One puzzle that appears permanent, however, is the role played by culture in the integration process. After 15 years in Canada, StatsCan notes that refugees from certain countries (Yugoslavia, Poland, Colombia, Vietnam, Cambodia, Laos and El Salvador) had earnings largely indistinguishable from immigrants accepted on strict economic criteria. But refugees from some other countries (Iraq, Somalia, Afghanistan, Pakistan and China) appear to do noticeably worse, even after accounting for factors such as education, language skills and age. StatsCan admits it has no real answer as to why such differences persist.

It is perhaps too soon to tell which category the Syrian refugees will fall into, but the early figures show those who arrived in late 2015 are already more likely to have a job than those who came a few months later, suggesting a fairly rapid process of integration. “I think we’ll see a lot of new small businesses coming out of this group of Syrian refugees,” says Momani, noting anecdotally that the national shawarma shop sector appears to be undergoing substantial growth. “I suspect by the next census, the numbers [of employed Syrian refugees] will have greatly improved. There is a lot of early success out there.”

Of course the biggest barrier to early success in the job market remains language. And this often requires some difficult choices for newcomers to Canada.

Shortly after arriving in southwestern Ontario, Jehad [Badr] enrolled in an English language school located in the basement of Waterloo’s First United Church, which supported his family’s refugee claim. “First six months, I go to English school. But I need job. I have rent. You need money,” says Jehad, who owned an auto upholstery repair shop back in Syria.

Mounting bills and a gnawing desire for independence eventually convinced him to drop out in favour of a job at a local patio furniture manufacturer. “I wish I go back to school. Maybe when I am old man,” he laughs. Sometimes Jehad answers questions twice, first in Arabic to his son Hussam, who acts as a language coach, and then again in English.

In contrast, Baraa, 49, has stuck with her language training and is now close to graduating. “When I am done, maybe I study more or look for a job,” she says.

Having chosen work over study, Jehad has already weathered two layoffs in the past two years as a result of the seasonal nature of the patio furniture business. A monthly $3,000 stipend from the church has long since run out and now rent consumes more than half his income. But he remains determined to pay his own way. Responsible for reimbursing the federal government for the cost of his family’s flight from Turkey, Jehad declined the option to pay it back at the modest rate of $9 per month.

“The government got $200 every month. Finished. No debt,” he states proudly, wiping his hands together. To supplement his income, he has also been doing small upholstery jobs on the side. And to save on expenses, he has discovered the wonders of Kijiji. “Six chairs and table. Twenty-five dollar!” he exclaims in disbelief, pointing across his small but homey apartment to his family’s “new” dining room set.

Independent, proud, hard-working and frugal. In many ways, Jehad already seems plenty Canadian. Perhaps the fact the enormous influx of Syrian refugees no longer constitutes a federal election issue can be partly ascribed to Jehad’s impressive work ethic and gregarious nature. As well as his family’s determination to fit into Canadian society. (They will be applying for citizenship shortly.) He even claims to love winter.

“In Syria, when winter comes one day, we drive 50 kilometre to see ice and snow. Everyone excited. Here… ” Jehad tails off, searching for the words to explain how Canadians don’t seem to get quite as excited about the cold stuff. But you get the sense he’ll eventually figure it out. A new home always takes some getting used to.

Source: How Syrian refugees to Canada have fared since 2015

Labour market outcomes for college and university graduates, class of 2010 to 2014

Good study on the differences in economic outcomes by gender, coming out just before my presentation at the ACS organized conference, STATISTICS CANADA: 100 YEARS AND COUNTING, looking at visible minorities and outcomes.

Same gender gaps but when one compares  visible minority women, Canadian-born, with not visible minority women, a number of visible minority groups have comparable economic outcomes whereas visible minority men, Canadian-born, do relatively worse compared to not visible minority men.:

Even with the same university degree or college diploma, female graduates earn, on average, less than their male counterparts two years after graduation. Results from a new study, based on administrative data, are focused for the first time on the annual employment income of college and university graduates over time in all provinces and territories.

From 2010 up to 2014, over 900,000 students under 35 years of age graduated from a Canadian public postsecondary institution and entered the labour market. Most of these graduates obtained an undergraduate degree (53%) or a college-level diploma (14%). The median employment income two years after graduation was $43,600 for those with an undergraduate degree and $39,100 for college-level diploma holders.

For all graduating cohorts from 2010 to 2014, men with college-level diplomas or undergraduate degrees had higher median employment income than women with the same credentials. The median employment income was $43,900 for men who graduated with a college-level diploma and $36,200 for women who obtained the same qualification. For those who obtained an undergraduate degree, the median employment income was $47,200 for men and $41,300 for women. Gender differences in employment income are influenced by various factors, such as choice of field of study, occupation, and hours of work. The current study cannot identify whether or not the occupation is related to the field of study of the graduate.

The employment income of graduates varies by educational qualification

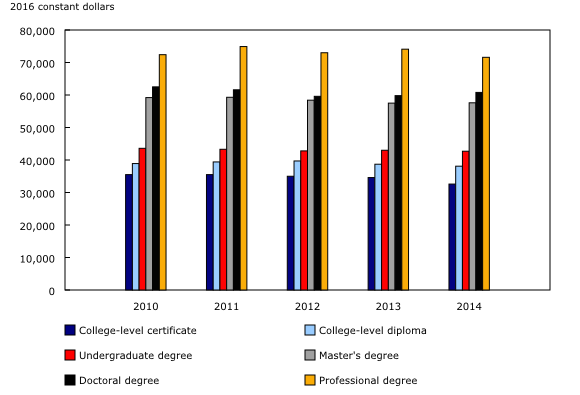
Among graduates who obtained their postsecondary credential from 2010 to 2014, the year of graduation had little impact on their employment income two years after graduation as each cohort of graduates entered a similar labour market environment. However, differences in income were observed by type of qualification for all graduating classes.

Chart 1  Chart 1: Median employment income of postsecondary graduates two years after graduation, by educational qualification, 2010 to 2014 cohorts
Median employment income of postsecondary graduates two years after graduation, by educational qualification, 2010 to 2014 cohorts

Chart 1: Median employment income of postsecondary graduates two years after graduation, by educational qualification, 2010 to 2014 cohorts

For the most recent graduate cohort (students who obtained a credential in 2014), the median employment income two years after graduation ranged from $32,600 for graduates with a college-level certificate to $71,600 for those with a professional degree (which includes graduates from law, medicine, dentistry, veterinary medicine, optometry or pharmacy). The results varied for other qualifications. For example, it was $38,100 for a college-level diploma, $42,700 for those with an undergraduate degree, $57,600 for a master’s degree, and $60,800 for doctoral degree graduates.

Median employment income for men ranged from $35,300 (graduates with a college level-certificate) to $72,800 (graduates with a professional degree). The median employment income for women ranged from $30,400 (college-level certificates) to $70,800 (professional degrees).

Studies in architecture, engineering and related technologies and in health and related fields lead to relatively high median employment income

Graduates from 2014 in architecture, engineering and related technologies, and in health and related fields, had the highest median employment income two years after graduation for college-level diplomas ($47,600 and $44,900, respectively) and undergraduate degrees ($60,000 and $58,200, respectively). Women and men had slightly different results.

For 2014 college-level diploma graduates, the median employment income two years after graduation in health and related fields was $44,000 for women and $50,500 for men. This was followed by architecture, engineering, and related technologies, with women earning $41,100, while men earned $48,900.

Women who obtained an undergraduate degree in health and related fields had the highest median employment income two years after graduation at $60,800, followed by architecture, engineering, and related technologies where the median employment income was $55,900.

Men with an undergraduate degree in architecture, engineering and related technologies had the highest median employment income ($61,000), followed by graduates in mathematics, computer and information sciences ($56,100). Health and related fields programs yielded the seventh highest median employment income for men at $44,100.

Among the 2014 cohort of graduates, women represented 16% of the college-level diplomas and 20% of the undergraduate degrees in the architecture, engineering and related technologies field. In contrast, they accounted for 84% of college-level diplomas and 80% of undergraduate degrees in health and related fields.

For graduates from most provinces, architecture, engineering and related technologies, and health and related fields were also among the top-earning fields of study for both college-level diploma and undergraduate degree graduates.

Employment income increases over time for postsecondary graduates

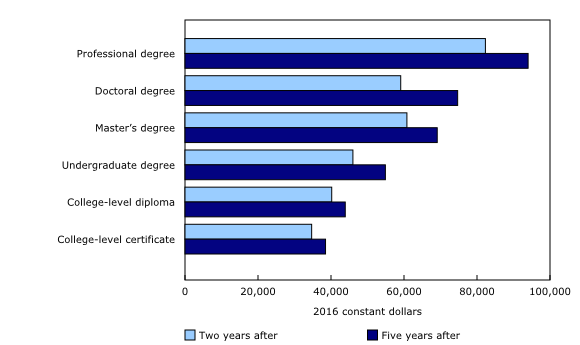
The 2011 graduating class saw their median employment income increase between 9% (for college-level diploma graduates) and 26% (for doctoral degree graduates) when measured first at two years, and then five years after graduation.

Chart 2  Chart 2: Median employment income of postsecondary graduates two and five years after graduation, by educational qualification, both sexes, 2011 longitudinal cohort
Median employment income of postsecondary graduates two and five years after graduation, by educational qualification, both sexes, 2011 longitudinal cohort

Chart 2: Median employment income of postsecondary graduates two and five years after graduation, by educational qualification, both sexes, 2011 longitudinal cohort

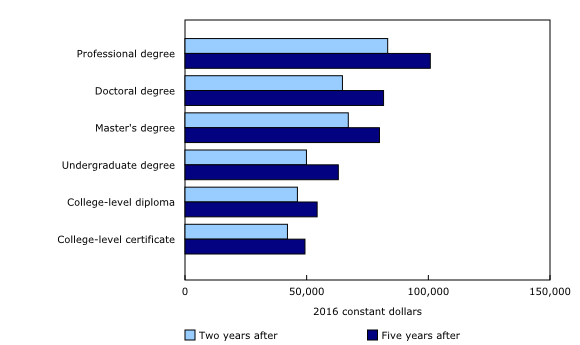
Chart 3  Chart 3: Median employment income of postsecondary graduates two and five years after graduation, by educational qualification, males, 2011 longitudinal cohort
Median employment income of postsecondary graduates two and five years after graduation, by educational qualification, males, 2011 longitudinal cohort

Chart 3: Median employment income of postsecondary graduates two and five years after graduation, by educational qualification, males, 2011 longitudinal cohort

Chart 4  Chart 4: Median employment income of postsecondary graduates two and five years after graduation, by educational qualification, females, 2011 longitudinal cohort
Median employment income of postsecondary graduates two and five years after graduation, by educational qualification, females, 2011 longitudinal cohort

Chart 4: Median employment income of postsecondary graduates two and five years after graduation, by educational qualification, females, 2011 longitudinal cohort

Students who obtained a professional degree in 2011 continued to have the highest median employment income five years after graduation, with an increase of 14% between year two and five. Those with a master’s degree had a slightly higher median employment income two years after graduation than those who earned a doctoral degree, some of whom may have pursued postdoctoral studies. However, five years after graduation, the doctoral degree graduates were earning more.

For graduates who earned a college-level diploma in 2011, the median employment income for males increased by almost 18% between two and five years after graduation. Female graduates, in turn, had a more modest rate of growth of 4% over the same period.

Among male students who earned an undergraduate degree in 2011, overall median employment income increased by almost 26% from years two to five following their graduation. The rate of growth in median employment income for female graduates over the same time period was lower, at 15%.

Median employment income for graduates in health and related fields grows slowly

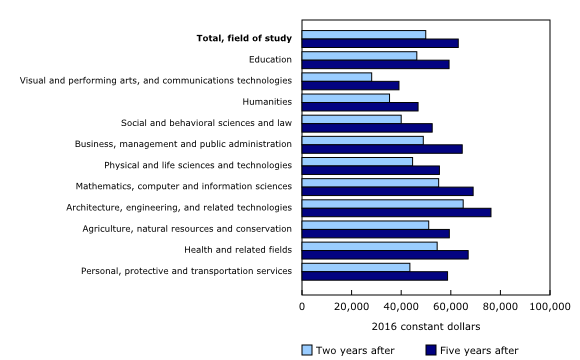
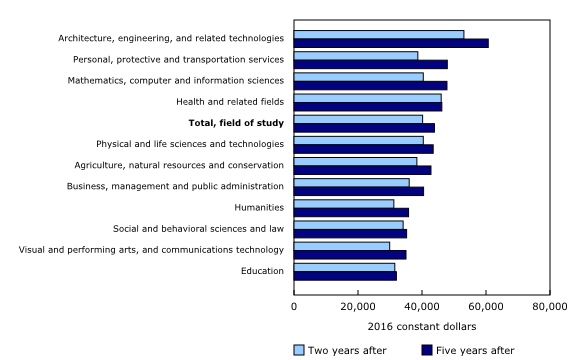
Although median employment incomes in health and related fields had the lowest growth rate among those with an undergraduate degree from years two to five after graduation (at approximately 4%), it was still among the top fields of study in terms of employment income. Graduates from humanities programs had the second highest growth rate of median employment income (28% between year two and five after graduation), however, their income ranked as one of the lowest among graduates from the major fields of study who obtained an undergraduate degree.

Chart 5  Chart 5: Median employment income of undergraduate degree graduates two and five years after graduation, by field of study, both sexes, 2011 longitudinal cohort
Median employment income of undergraduate degree graduates two and five years after graduation, by field of study, both sexes, 2011 longitudinal cohort

Chart 5: Median employment income of undergraduate degree graduates two and five years after graduation, by field of study, both sexes, 2011 longitudinal cohort

Chart 6  Chart 6: Median employment income of undergraduate degree graduates two and five years after graduation, by field of study, males, 2011 longitudinal cohort
Median employment income of undergraduate degree graduates two and five years after graduation, by field of study, males, 2011 longitudinal cohort

Chart 6: Median employment income of undergraduate degree graduates two and five years after graduation, by field of study, males, 2011 longitudinal cohort

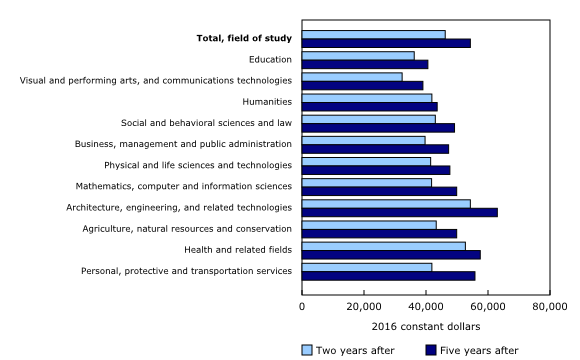
Chart 7  Chart 7: Median employment income of undergraduate degree graduates two and five years after graduation, by field of study, females, 2011 longitudinal cohort
Median employment income of undergraduate degree graduates two and five years after graduation, by field of study, females, 2011 longitudinal cohort

Chart 7: Median employment income of undergraduate degree graduates two and five years after graduation, by field of study, females, 2011 longitudinal cohort

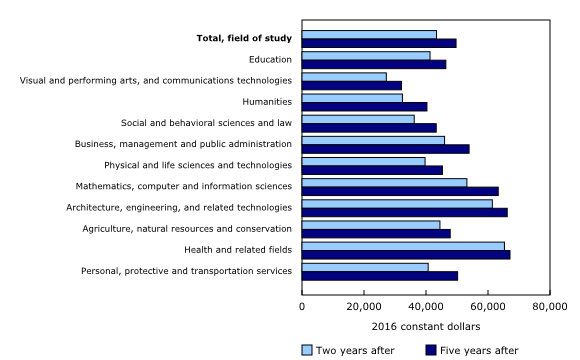
Chart 8  Chart 8: Median employment income of college-level diploma graduates two and five years after graduation, by field of study, both sexes, 2011 longitudinal cohort
Median employment income of college-level diploma graduates two and five years after graduation, by field of study, both sexes, 2011 longitudinal cohort

Chart 8: Median employment income of college-level diploma graduates two and five years after graduation, by field of study, both sexes, 2011 longitudinal cohort

Chart 9  Chart 9: Median employment income of college-level diploma graduates two and five years after graduation, by field of study, males, 2011 longitudinal cohort
Median employment income of college-level diploma graduates two and five years after graduation, by field of study, males, 2011 longitudinal cohort

Chart 9: Median employment income of college-level diploma graduates two and five years after graduation, by field of study, males, 2011 longitudinal cohort

Chart 10  Chart 10: Median employment income of college-level diploma graduates two and five years after graduation, by field of study, females, 2011 longitudinal cohort
Median employment income of college-level diploma graduates two and five years after graduation, by field of study, females, 2011 longitudinal cohort

Chart 10: Median employment income of college-level diploma graduates two and five years after graduation, by field of study, females, 2011 longitudinal cohort

As was the case for students with an undergraduate degree, those with a college-level diploma in health and related fields had the lowest rate of growth (less than 1%) from two to five years after graduation, but started with relatively high median employment income. College-level diploma graduates in visual and performing arts, and communications technologies, had larger income growth between two and five years after graduation at 17%, but started with the lowest median employment income.

Memo to Donald Trump: Canadian immigrants from ‘shithole’ countries are thriving: Arvind Magesan

Good analysis by Magesan (my ongoing analysis of census data has similar results):

Defenders of Donald Trump say his “shithole countries” remark regarding people from Africa, Haiti and other nations was just Trump being Trump — the president may have used salty language, but it’s really just his way of saying the United States should have a merit-based immigration system like Canada’s.

A generous interpretation of Trump’s comments are that immigrants from certain so-called “shithole” countries—African nations, Haiti and El Salvador—are not typically highly skilled or economically self-reliant, and if admitted would need to depend on the state.

In fact, Trump apologists—and the president himself—might be surprised by what the economic data says about immigrants who come to Canada from the “shithole” countries.

John Fredericks, who was Trump’s campaign chair in Virginia, told CNN that immigrants from those countries “come into the United States and they do nothing to increase the prosperity of the American worker. They lower wages or go on welfare and extend our entitlement system …. Australia and Canada have a merit-based system. You know why they do that? Because they want to bring people into their country who are going to enhance the prosperity of their citizens.”

Trump himself tweeted a similar sentiment.

The conclusion we are expected to make, it seems, is that if the United States was to adopt a purely merit-based system, immigrants would not come from these countries—they would come from countries like Norway, and immigrants from these Norway-like countries would not put pressure on blue-collar U.S. workers because they would be highly skilled and, more importantly, they wouldn’t be a drain on the system because they would be economically self-reliant.

A merit-based system

Canada offers an opportunity to take a look at this hypothesis because our points-based immigration system screens immigrants on merit to a large degree. So when we screen immigrants on merit, who do we let in and how do they do?

The first thing to note is that Canada admits many immigrants from the “shithole” countries.

Data from the 2016 census shows over the last five years there have been more than twice as many immigrants from Central America and the Caribbean (which includes Haiti and El Salvador) than there were from the U.S. There were also more immigrants from the African continent than from the U.S. and North and Western Europe combined.

Clearly a merit-based system does not mean we only admit people from the “Norways” of the world—and in fact, the census data shows only 230 people immigrated from Norway over the five-year period.

https://datawrapper.dwcdn.net/vLx64/2/

The next question is how do these immigrants fare?

To look more closely at this, I used individual 2011 Canadian census data (detailed 2016 data isn’t yet available) to look at three groups: Canadians whose families have been here for three generations or longer; immigrants from the “Norways” of the world (Northern and Western Europe, including the U.K., Germany, and Scandinavia) and immigrants from Trump’s “shithole” countries (Central America, the Caribbean, Africa).

I looked at the skill levels of the different groups, as measured by their education level, and then at their economic self-sufficiency: employment, wages and how much they receive in transfers and employment benefits from the government.

https://datawrapper.dwcdn.net/7ATin/2/

Let’s start with skill level.

Forty per cent of Canadians who have been here for three generations or longer have at least some post-secondary education, and 18 per cent have a bachelor’s degree. By comparison, a much larger percentage of immigrants of either type (53 per cent) have some post-secondary, and 27 per cent of immigrants from “Shitholes” have a bachelor’s degree. So by this standard measure of skill, immigrants from “Shitholes” have a slightly higher skill level than do immigrants from “Norways,” and a much higher skill level on average than Canadians who have been here for generations.

What about self-sufficiency?

It is commonly argued that immigrants, particularly from poorer countries, are “expensive” because they receive a disproportionate amount of government transfers and unemployment benefits. The truth is, though Canadians who have been here for generations are more likely to be employed and earn (slightly) more on average than either immigrant group, immigrants from the “Shitholes” are far more likely to be employed than immigrants from the “Norways.”

Fewer transfer payments

Perhaps more interestingly, immigrants from the “Shitholes” receive fewer transfer payments from all levels of government than “Norwegian” immigrants.

Finally, looking at employment insurance benefits alone, Canadians who have been here for generations receive more than either group.

What can we say about these numbers?

Firstly, immigrants from the “Shithole” countries are not typically low skill and in principle, should not be putting pressure on employment or wages of blue-collar workers in Canada. Then why is this such a common perception?

It’s likely due to a different issue, that high-skilled immigrants are unable to get high-skill jobs for other reasons (discrimination in the labour market, an inability of employers to recognize or evaluate credentials, or even language issues) and then do end up competing with lower-skilled Canadian workers.

Secondly, immigrants from the “Shithole” countries are generally no more dependent on the state than other Canadians. Though they earn less than those from the “Norway” countries, they are more likely to be employed and they receive less total government transfer payments.

Many differences

As an economist, it’s important to state that we shouldn’t interpret these relationships between country of origin and economic outcomes as causal—workers from different countries are different for many reasons (demographics like age, as well as occupation, etc).

But that doesn’t at all affect the main point—Trump’s perception of the differences in the average immigrant from countries like Haiti and Norway is at the very least a consequence ignorance, or as many have suggested, racism.

One thing that can’t be rationalized by the raw numbers here: The course of history and the current plight of many of the “shithole” countries is at least partly a consequence of U.S. foreign policies, that the position of relative economic superiority of the U.S. is partly an outcome of these policies, and that this above all might imply a moral obligation on the part of the U.S. when deciding who to let in and from where.

via Memo to Donald Trump: Canadian immigrants from ‘shithole’ countries are thriving – Macleans.ca

x