UK: Say one thing, do another? The government’s record rise in net migration

Highlights the difficulties and how parties get captured by their political promises, and then later pay the political price:

Think back to the 2019 election campaign. Quite reasonably, you may not remember every detail of the Conservatives’ manifesto – but perhaps you do recall one promise: to reduce immigration.

Think back further, to 2016 and the Brexit referendum. Then there was a promise to “take back control” of the UK immigration system. And since it left the EU in 2020, the UK does have more control.

But the numbers of people who’ve moved here didn’t go down, they went up.

Since the Brexit vote and the Conservatives’ victory in 2019, the 12 months to June 2022 saw the fastest population growth since the 1960s. Current projections from the Office for National Statistics put the UK on course for 74 million people by 2036 – six million more than there are today.

You’d be well within your rights to ask how that could be? The answer, according to the ONS, is largely immigration.

And one aspect of immigration has received huge amounts of attention from the government and the media. Statement after statement, story after story, has focused on migrants crossing the Channel in small boats – and the government’s efforts to stop them.

Indeed you’d be forgiven for thinking small boats are a major part of why immigration is up. But they aren’t.

No doubt, small boats are an important issue – on a human and national level. Prime Minister Rishi Sunak has made “stopping the boats” one of his five priorities.

His government’s flagship Rwanda plan aims to send some asylum seekers who arrive on small boats there – and Mr Sunak is still trying to get the bill through parliament.

But it’s not small boats that are driving an increase in immigration – it’s choices made by the government.

Almost 30,000 people arrived in the UK on small boats last year – something the prime minister has vowed to crack down on

There are a number of ways to measure immigration.

Let’s start with one: net migration. That’s the difference between the number of people arriving and leaving the UK each year.

In 2022, it’s estimated to have reached an all-time record of 745,000.

Then, there’s the number of visas issued to people relocating to the UK. Last year there were more than 1.4 million.

For context, last year almost 30,000 people arrived by small boat.

After the UK left the European Union, the government launched a new visa scheme for most people who don’t have a UK passport.

The government decides the criteria for the different visas it issues – these can be for studying, for working, for humanitarian reasons – and other purposes too.

In the words of Prof Brian Bell, who chairs the government’s independent Migration Advisory Committee, the rise in immigration is “the inevitable consequence of government policy”.

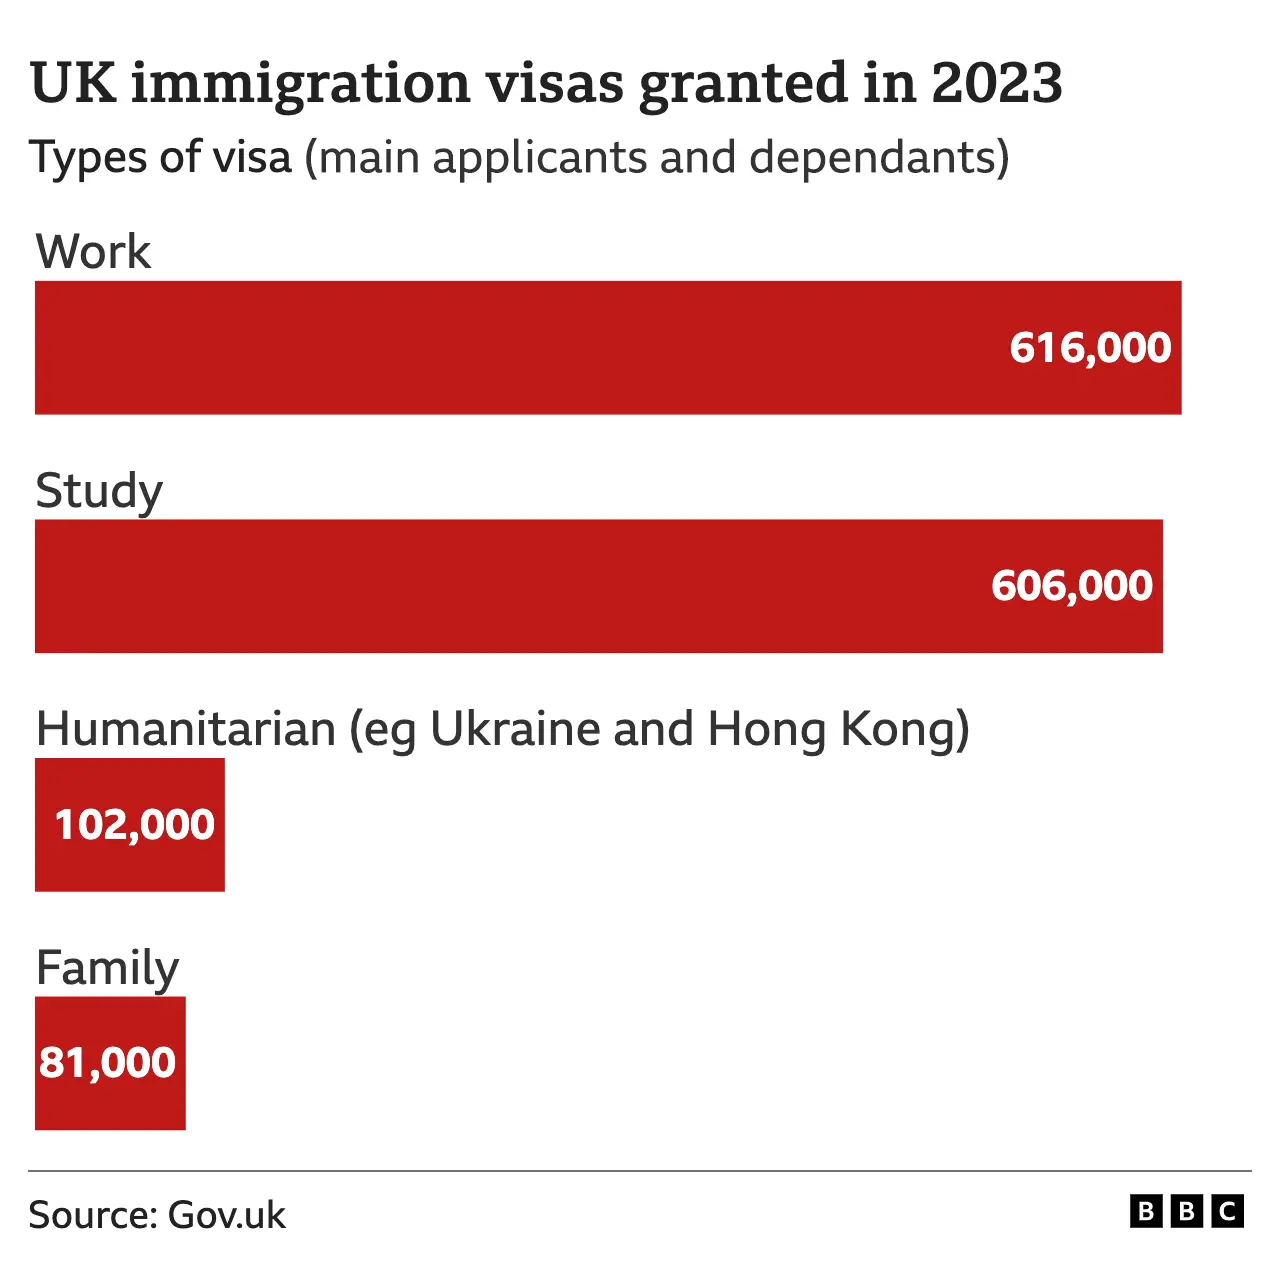
We can see how this is the case by breaking down that 1.4 million figure.

UK immigration visas granted in 2023

In 2022, the government issued almost 300,000 humanitarian visas. But last year the number was 102,000 – that’s just 7% of the 1.4 million visas issued.

The government has been consistent in its response when asked about the record levels of net migration.

Tom Pursglove MP, the Legal Migration Minister, told me: “We’ve seen incredible generosity in our country to people from Ukraine, people from Afghanistan, people from Syria, and other conflict zones. That is an important part of why we’ve seen the figures as they are.”

It is important, no doubt. And there was political consensus that issuing visas to people from Hong Kong, Ukraine and elsewhere was the right thing to do.

But the numbers show that this isn’t the full story.

The government has made other choices that have pushed up immigration.

Brexit and the pandemic added to existing recruitment problems in the social care sector. Care home owners responded by asking the government to make it easier to employ overseas care workers.

Those calls were echoed by the Migration Advisory Committee, which also suggested the government should fund higher wages to attract more British workers into the sector.

The Westminster government agreed more visas could be issued but did not raise wages.

A number of consequences followed.

For care home owners like Raj Sehgal, the changes helped. He filled almost all vacancies in his five Norfolk care homes, with 40% of staff coming from abroad.

“If we didn’t have international recruitment, I think we would probably be closed by now,” he told me.

More overseas staff arrived to work across the sector. But more may be needed. Last year, there were around 150,000 vacancies in England, and recruiting British workers remains difficult.

Let’s look at that 1.4 million figure again. Of all of those visas, more than 146,000 went to health and social care workers, another 203,000 went to their dependants.

This month, the government stopped overseas care workers from bringing dependants, describing the numbers as “disproportionate”. Mr Sehgal says this has already reduced the number of applications he is receiving.

This seems certain to reduce net migration numbers, but it’s not certain how the care sector will find the staff it needs.

If the government’s decisions on social care have driven up immigration, then so have its decisions on overseas students.

First of all, let’s consider the context here.

Tuition fees for domestic undergraduates at English universities are capped at £9,250 a year. That hasn’t risen for seven years – but during the same period, costs have. That has left universities facing financial challenges.

Some of them, like Coventry University, have targeted higher-paying overseas students to help cross-subsidise UK undergraduates. Forty per cent of the students at its campuses across the UK are from overseas.

If domestic tuition fees were raised, it could reduce the need for overseas students. But that would cost a lot. And it hasn’t happened.

Prof Brian Bell argues “that’s a choice of the government not to fund education in a particular way. The inevitable consequence is more immigration.”

The government couldn’t have been clearer about its ambition to attract more overseas students.

In 2019, it even set a target to increase the UK’s overseas student population to 600,000 – by 2030. It achieved that goal nine years early.

On top of that, in 2021, the government reintroduced a post-study work visa which allows overseas postgraduate students to work for two years after their courses finish – or three years if studying for a PhD.

It took the decision despite the Migration Advisory Committee suggesting that it shouldn’t.

All of this did what it was designed to do – attract lots more students. Last year the government issued almost 458,000 sponsored study visas. And almost 144,000 for dependants of postgraduate students.

Together, they made up almost 42% of the more than 1.4 million visas issued last year.

Again, the government was choosing immigration.

Now at this point, we should emphasise that while the government was putting in place policies that promoted immigration, knowing their precise impact was hard.

Dr Madeleine Sumption leads the Oxford Migration Observatory at the University of Oxford. She also sits on the Migration Advisory Committee that advises the government.

Predicting immigration numbers is “incredibly difficult”, Dr Sumption says. “Sometimes it’s much larger than the government expects.”

As the consequences of the government’s own policies became clear, it slammed on the brakes.

In May last year it announced that, from January 2024, most overseas postgraduate students would no longer be able to bring dependants.

This March, the government took further action – it ordered a review of the visa that allows overseas students to stay on and work. This, let’s remember, is the scheme the government had introduced only three years ago.

Legal Migration Minister Tom Pursglove explains: “The government took a view that we thought that that was the right thing to do to support the university sector. But when you consider the dependant numbers that have come with students, that has been very, very challenging.”

The government’s measures appear to be making a difference already. According to Universities UK, some universities are seeing a sharp drop in applications from overseas students for postgraduate courses.

But there’s a risk that as applications go down, so does the income of some universities.

A British Future poll suggests 69% of respondents are dissatisfied with the government on immigration

All of these government decisions have contributed to the record rise in net migration, and along with the rise we’re also seeing a shift in public opinion.

The think tank British Future, which tracks UK attitudes to immigration and describes itself as non-partisan, has shared its latest opinion poll with Panorama.

For the first time in four years, the poll suggests a majority of 3,000 respondents – 52% – want overall immigration to fall.

On top of that, 69% of those polled say they are dissatisfied with the government on immigration – that’s the highest since its polling began in 2015.

And this is where we come back to where we started – to the government’s emphasis on the issue of small boats.

The opinion poll also suggests that a little over half of those who say they are dissatisfied with the government’s handling of immigration pointed to small boats – and those concerns are coinciding with concerns about overall immigration.

Dr Sumption told me the media’s focus on small boats has probably created the impression that almost all migration comes that way, “which obviously it doesn’t”.

To reiterate – almost 30,000 people came by small boats last year and 1.4 million visas were issued by the government for people to come to the UK legally.

Some argue that the government has overemphasised the issue of small boats.

When I put that to Tom Pursglove, he countered that the government has a “moral imperative” to “grip that issue”. But he said that shouldn’t stop them, “delivering on the mission around legal migration, which is to get a better balance to bring those numbers down”.

At the moment, by the prime minister’s admission, that balance is off. In November, Rishi Sunak acknowledged, “immigration is too high and needs to come down”.

But his former Home Secretary Suella Braverman made a series of striking claims when I talked to her about Mr Sunak’s approach.

“I think the prime minister has not necessarily assumed that it’s an important issue for the British people,” Ms Braverman says.

“‘I struggled myself as home secretary, even to have a meaningful conversation with him about it. I was left to written correspondence on several occasions throughout a period of 12 months, putting forward policy proposals. But he refused to talk to me.”

I was taken aback by this. I know there is little political love lost since Mr Sunak sacked Ms Braverman last year – but this is the home secretary during the time of one of the sharpest rises in net migration in the UK’s history – claiming the prime minister wouldn’t talk to her about it – at all – for a year.

I double-checked I had heard right. I had.

“We talked about the boats every week, twice a week. We talked to each other a lot about policing and security. On legal migration, I was unable to get a hearing with the prime minister for 12 months.”

Given the importance of this issue to so many people, it is an extraordinary claim.

When we asked No 10 about this, it did not comment.

At the end of last year, the government announced plans to cut net migration by reducing the number of people coming to the UK by 300,000.

Remember, the latest estimate for net migration is 672,000 for the year to June 2023.

The estimate published just before the Brexit referendum – and which, at the time, Boris Johnson called “scandalous” – was 333,000. That estimate has now been revised down to 303,000.

So if the government meets its new target, that would take the numbers back towards where they were… just before the Brexit vote.

The government emphasises that Brexit has given the UK greater control and flexibility to adapt immigration policy to circumstance

Some observers watching the government’s statements and actions on immigration are gently raising their eyebrows.

Prof Anand Menon, who leads the independent think-tank UK in a Changing Europe, told us: “I think there is an element of dishonesty in the government at one and the same time implementing these policies and bemoaning them. Or bemoaning their impact.”

There seems little doubt the government’s latest measures will make a difference. Net migration is expected to fall. But if it does, the longer-term challenges that immigration has been easing may come into sharper focus.

Paul Johnson of the Institute for Fiscal Studies, which says it operates on a “non-political basis”, has an uncompromising message on this.

“If you want universities to have as much money as they have at the moment without these foreign students, you need to find some money from British students or the British taxpayer. If you want care homes to be staffed without bringing people in from elsewhere, you’re going to have to pay more. You have to make choices here.”

I’d hoped to ask Labour some questions about how it would approach these choices, but it declined.

This month, the Shadow Home Secretary Yvette Cooper said, “We are very clear that net migration needs to come down” and that a practical plan to tackle skills shortages in the UK is needed.

But are politicians of all parties being straight with us about what these choices involve?

For this government, for any government, these choices will involve difficult and sometimes expensive trade-offs.

Legal Migration Minister Tom Pursglove argues “issues have arisen” and it has “responded to those issues”. It emphasises that Brexit has given the UK greater control and flexibility to adapt immigration policy to circumstance.

Others point to recent data showing that one in five working-age adults are off work in the long-term, with record numbers recorded with long-term sickness.

In the Spring Budget, the Chancellor Jeremy Hunt said it would be easy to fill the 900,000 job vacancies with higher migration, but with 10 million adults not in work, it would be “economically and morally wrong”.

It’s inescapable though, that while the UK now has more control of its immigration system, the government has used that control to allow more people to come to the UK.

To come back to the question I posed earlier: how did that happen?

We can answer that by listing the government’s decisions and by acknowledging that there are powerful long-term factors that appear to encourage higher immigration. Our population is ageing, our birth rate is falling and our economy is struggling to grow.

The government though still insists the numbers will and must come down.

However, despite all the promises, this government chose more immigration. It is unlikely to be the last to do so.

Source: Say one thing, do another? The government’s record rise in net migration

African Migration to the U.S. Soars as Europe Cracks Down – The New York Times

Have seen some other similar commentary from Black Americans as well as tension between Black immigrants and African Americans:

The young men from Guinea had decided it was time to leave their impoverished homeland in West Africa. But instead of seeking a new life in Europe, where so many African migrants have settled, they set out for what has become a far safer bet of late: the United States.

“Getting into the United States is certain compared to European countries, and so I came,” said Sekuba Keita, 30, who was at a migrant center in San Diego on a recent afternoon after an odyssey that took him by plane to Turkey, Colombia, El Salvador and Nicaragua, then by land to the Mexico-U.S. border.

Mr. Keita, who spoke in French, was at a cellphone charging station at the center among dozens more Africans, from Angola, Mauritania, Senegal and elsewhere, who had made the same calculus.

While migrants from African nations still represent a small share of the people crossing the southern border, their numbers have been surging, as smuggling networks in the Americas open new markets and capitalize on intensifying anti-immigrant sentiment in some corners of Europe.

Historically, the number of migrants from Africa’s 54 countries has been so low that U.S. authorities classified them as “other,” a category that has grown exponentially, driven recently, officials say, by fast-rising numbers from the continent.

According to government data obtained by The Times, the number of Africans apprehended at the southern border jumped to 58,462 in the fiscal year 2023 from 13,406 in 2022. The top African countries in 2023 were Mauritania, at 15,263; Senegal, at 13,526; and Angola and Guinea, which each had more than 4,000.

Nonprofits that work on the border said that the trend has continued, with the absolute number and share of migrants from Africa climbing in recent months as potential destinations in Europe narrow.

“You have countries that are less and less welcoming,” said Camille Le Coz, a senior policy analyst at Migration Policy Institute Europe. “When new routes open up, people are going to migrate because economic opportunities at home are insufficient.”

The African migrants continue through Honduras, Guatemala and Mexico until they arrive at the southern U.S. border. Between January and September, nearly 28,000 Africans passed through Honduras, a sixfold increase over the corresponding period in 2022, according to the Honduran government. Guinea, Senegal and Mauritania are among the top 10 countries of those migrants; only a couple dozen people from each of those countries traveled through Honduras in 2020….

Source: African Migration to the U.S. Soars as Europe Cracks Down – The New York Times

The Decline of Legal Immigration | Cato at Liberty Blog

Useful stats. MPI had a very good webinar assessing the Biden administration immigration policy and program changes. Lot more happening through executive orders (close to 300 in the past year, about 100 related to reversing Trump administration measures) than the high level debates would indicate:

Legal immigration collapsed in the last year of the Trump administration. The number of green cards issued abroad were declining prior to the pandemic, partly for policy and other reasons, but the American government’s overreaction to COVID-19 caused immigration to collapse as we’ve detailed here, here, here, here, and here.

Since President Biden took office in January 2021, the recovery of legal immigration has been much slower than we anticipated. The new vaccine mandate for immigrants (as we’re seeing in other countries with the Novak Djokovic scandal), the remaining closure of many embassies and consulates that reduce interviews for visas and their subsequent issuance, the delayed release of extra visas approved by Congress, and additional haphazardly imposed travel restrictions have greatly reduced the scope of legal immigration.

Despite those restrictions, the number of legal immigrant visas issued abroad has partly recovered from a low of 697 (that’s not a typo) in May 2020 to 35,647 in November 2021 (Figure 1). That’s 16 percent below the average of 42,390 immigrant visas issued monthly from January 2017 through February 2020, during Trump’s presidency but prior to COVID-19. December 2021 and January 2022 will likely show lower numbers.

As bad as the numbers for immigrant visas are, the number of non‐​immigrant visas issued abroad every month is even worse. Non‐​immigrant visas are for students, temporary workers, tourists, and others who can temporarily travel to the United States or reside here for a specific time and purpose. Figure 2 shows that 40,939 were issued in May 2020, the low point of the series, down from a monthly average of 738,642 from January 2017 through February 2020 – a 95 percent decline. The numbers have since climbed to a paltry 391,022 in November 2021 – far shy of their pre‐​pandemic numbers.

The Biden administration needs to rapidly reverse this situation, recover the lost visas through legislation, and go even further or the U.S. economy will suffer long run drags on its growth.

Source: The Decline of Legal Immigration | Cato at Liberty Blog

Who’s Afraid of Big Numbers? Pretty much everyone. But it doesn’t have to be that way, two mathematicians contend.

Some interesting thoughts on how to communicate numbers. For immigration examples, 400,000 (current target) in seconds is the equivalent of 4.6 days. In terms of immigrants, just under 1,100 per day:

“Billions” and “trillions” seem to be an inescapable part of our conversations these days, whether the subject is Jeff Bezos’s net worth or President Biden’s proposed budget. Yet nearly everyone has trouble making sense of such big numbers. Is there any way to get a feel for them? As it turns out, there is. If we can relate big numbers to something familiar, they start to feel much more tangible, almost palpable.

For example, consider Senator Bernie Sanders’s signature reference to “millionaires and billionaires.” Politics aside, are these levels of wealth really comparable? Intellectually, we all know that billionaires have a lot more money than millionaires do, but intuitively it’s hard to feel the difference, because most of us haven’t experienced what it’s like to have that much money.

In contrast, everyone knows what the passage of time feels like. So consider how long it would take for a million seconds to tick by. Do the math, and you’ll find that a million seconds is about 12 days. And a billion seconds? That’s about 32 years. Suddenly the vastness of the gulf between a million and a billion becomes obvious. A million seconds is a brief vacation; a billion seconds is a major fraction of a lifetime.

Comparisons to ordinary distances provide another way to make sense of big numbers. Here in Ithaca, we have a scale model of the solar system known as the Sagan Walk, in which all the planets and the gaps between them are reduced by a factor of five billion. At that scale, the sun becomes the size of a serving plate, Earth is a small pea and Jupiter is a brussels sprout. To walk from Earth to the sun takes just a few dozen footsteps, whereas Pluto is a 15-minute hike across town. Strolling through the solar system, you gain a visceral understanding of astronomical distances that you don’t get from looking at a book or visiting a planetarium. Your body grasps it even if your mind cannot.

Likewise, vast sums of money become more comprehensible if they are reframed in terms of more familiar amounts. In a 2009 blog post, the mathematician Terry Tao rescaled the entire United States federal budget to the annual household spending for a hypothetical family of four. In Dr. Tao’s rescaling, a $100 million line item in the budget became equivalent to a $3 expenditure for the family.

Research in psychology and science education supports Dr. Tao’s strategy. In 2017, cognitive scientists found that students could grasp extremely long time periods — say, between the extinction of dinosaurs and emergence of humans — more readily if they created a personal timeline of the most significant events in their lives and rescaled it to progressively longer time spans: all of American history, all of recorded history and so on. These students were also better than controls at estimating numbers in the billions, an ability that is vital to understanding geological time, astronomical distances or the bewildering sums in the federal budget.

To that end, we thought it could be instructive to update Dr. Tao’s exercise, this time using the numbers in Mr. Biden’s proposed 2022 budget. For simplicity, the total money entering the federal budget — call it “income” — has been scaled to be $100,000. Meanwhile, as the graphic shows, this hypothetical nation-family spends about $144,000 a year, exceeding the budget by about $44,000. Most of the expenditure goes to four big-ticket items: about $29,000 to pay for Social Security, $18,000 for Medicare, the same for Defense and around $14,000 for Medicaid.

Scaling the Budget

Taken together, these four items add up to almost $80,000 in expenses for our nation-family. In addition, we must still pay off the interest on the national debt, for another $7,000, plus $36,000 on other assorted mandatory programs. So exceeding the budget by as much as Mr. Biden is proposing leaves only about $22,000 to spend on the other things we care about, the so-called nondefense discretionary spending.

When the numbers are reframed this way, the trade-offs become clearer. Want to increase funding to historically Black colleges and universities? Mr. Biden does, and he is asking the nation-family to chip in 36 cents (in these rescaled terms) to that end. What about former President Donald J. Trump’s border wall? Our nation-family spent about $388 on it in 2021. In comparison, Mr. Biden is proposing to spend $255 next year to ensure clean, safe drinking water in all communities and $5 to expand school meal programs. These choices are political ones, but at least now we can wrap our minds around how much money we’re talking about.

Why not employ a more typical diagraming strategy, like a bar chart? Well, a bar chart would reduce most items to barely visible slivers. Sometimes such large numbers are recast as percentages of the whole, but that approach suffers from the same drawback, generating confusingly small figures, like 0.01 percent. As Dr. Tao recognized, $100,000 trades on a scale with which most people are intimately familiar. Few among us, alas, will ever be a billionaire, much less a trillionaire. But we can all reasonably budget like one.

Aiyana Green is an undergraduate majoring in policy analysis and management in the College of Human Ecology at Cornell University. Steven Strogatz is a professor of mathematics at Cornell University and the author, most recently, of “Infinite Powers: How Calculus Reveals the Secrets of the Universe.”

Source: https://www.nytimes.com/2021/06/17/science/math-numbers-federal-budget-tao.html

Immigrant share in U.S. nears record high but remains below that of many other countries

Good recap of comparative statistics:

Nearly 14% of the U.S. population was born in another country, numbering more than 44 million people in 2017, according to a Pew Research Center analysis of the U.S. Census Bureau’s American Community Survey.

Immigrant share of U.S. population approaches historic highThis was the highest share of foreign-born people in the United States since 1910, when immigrants accounted for 14.7% of the American population. The record share was 14.8% in 1890, when 9.2 million immigrants lived in the United States.

The foreign-born population in the U.S. grew substantially during the late 1800s, when immigration from Europe and elsewhere brought millions of new residents to the nation’s shores. In the 1920s, the U.S. adopted a series of more restrictive immigration laws, eventually leading to the establishment of a national-origin quota system in 1924 and a subsequent decline in the foreign-born share of the nation’s population. That immigration system was not changed until 1965, when the Immigration and Nationality Act created the same overarching immigration laws that the U.S. still uses today. Since 1965, at least 59 million immigrants have come to the United States.

Immigrant share in U.S. is lower than in many other countriesEven though the U.S. has more immigrants than any other country, the foreign-born share of its population is far from the highest in the world. In 2017, 25 countries and territories had higher shares of foreign-born people than the U.S., according to United Nations data.

In 2017, large majorities of populations in some Persian Gulf nations, such as the United Arab Emirates (88%) and Kuwait (76%), were born in other countries. (Most foreign-born persons living in Persian Gulf nations are labor migrants and live in the region temporarily.)

Foreign-born people also accounted for a substantial share of the population in Australia (29%), New Zealand (23%) and Canada (21%), as well as in several European countries, such as Switzerland (30%), Austria (19%) and Sweden (18%).

Explore detailed tables on the number and share of immigrants and emigrants by country.

The share of foreign-born people has changed over time in many nations, just as it has in the U.S. Several European countries, as well as other immigrant destinations (Canada and Australia, for example), have seen steady increases in recent decades. But some nations have seen their immigrant shares drop. In several Central and Eastern European countries – such as Latvia and Estonia – more people are leaving than entering, and remaining immigrants are getting older and dying, all leading to a decreasing share of foreign-born people.

In several immigrant destination countries, larger shares of publics want fewer or no immigrants to move to their country, according to a Pew Research Center survey conducted in the spring of 2018. However, support for taking in high-skilled immigrants and refugees fleeing war remains high in some destination countries.

Worldwide, most people do not move across international borders. In all, only 3.4% of the world’s population lives in a country they were not born in, according to data from the UN. This share has ticked up over time, but marginally so: In 1990, 2.9% of the world’s population did not live in their country of birth.

Source: Immigrant share in U.S. nears record high but remains below that of many other countries

One year later, Citizenship Act improvements lead to more new citizens – The numbers

Almost one year after the changes to residency requirements (from 4 to 3 years) and fewer applicants having to be tested for language and knowledge (from 14-64 to 18-54), the number of applications has increased.

As noted before, the residency requirement change is a one time impact, with this year being a “double year” with 3 and 4 year cohorts combined. The reduced testing requirements, primarily the 55-64 year olds, has both a one-time impact (those who put off getting citizenship) as well as ongoing.

The new “normal” will be known with the 2019 numbers:

This year, Citizenship Week (October 8 to 14, 2018) will be celebrated with 72 special citizenship ceremonies across the country. Citizenship Week also marks the 1 year anniversary of Bill C 6, which brought in important changes to the Citizenship Act, helping qualified applicants get citizenship faster.

The changes from Bill C 6 came into effect on October 11, 2017, and provided those wanting to become Canadian citizens with greater flexibility to meet the requirements. In particular, the changes reduced the time permanent residents must be physically present in Canada before applying for citizenship from 4 out of 6 years to 3 out of 5 years.

By the end of October 2018, an estimated 152,000 people will have obtained Canadian citizenship since the changes came into effect, an increase of 40%, compared to the 108,000 people who obtained citizenship in the same period the year before.

Bill C 6 has allowed more permanent residents to apply for citizenship. In the 9 month period from October 2017 to June 2018, Immigration, Refugees and Citizenship Canada (IRCC) received 242,680 applications, more than double the 102,261 applications that were received in the same period the year before. Despite the increase in applications, processing times for routine citizenship applications remain under 12 months.

Source: Taking Canadian Citizenship to New Heights This Citizenship Week

Nine things everyone should know how to do with a spreadsheet | Macworld

As I am starting to use spreadsheets to analyze demographic and related data, my basic knowledge of spreadsheets is being challenged. Another primer from Macworld (but applies to Excel and Google’s Sheets as well).

As I have been only using sum and average functions, these examples of other functions caught my eye:

=MAXRANGE and =MINRANGE: Return the largest and smallest values in a range. Related to these two, I also often use =RANKCELL,RANGE, which returns the rank of a given cell within the specified range.

=NOW: Inserts the current date and time, which is then updated each time the spreadsheet recalculates. In both Excel and Sheets, you need to add a set of parentheses: =NOW.

=TRIMCELL: If you work with text that you copy and paste from other sources, there’s a good chance you’ll find extra spaces at the beginning or end of some lines of text. The TRIM function removes all those leading and trailing spaces but leaves the spaces between words.

Nine things everyone should know how to do with a spreadsheet | Macworld.