Public Services and Administration: What does the Census Say?
2019/05/27 Leave a comment
To what extent do public services and administration reflect and represent the population they serve?
To start with, representation matters. The degree to which visible minority populations see themselves in public institutions both fosters and reflects integration, and facilitates how these institutions serve their citizens. This article uses census 2016 data to review how effectively education, healthcare, social services, police services and public administration at the national and provincial levels reflect diversity. Police services and public administration are also reviewed at the municipal level.
Overall, the analysis presents a mixed picture of visible minority representation, whether by area or government:
- Significant under-representation at the elementary and secondary levels of education in contrast to comparable representation at the university level. Given that visible minorities are less likely to have degrees in education (only 7 percent of all 25-34 year olds are Canadian-born visible minority education graduates), this trend is unlikely to change quickly.
- Healthcare and social services are broadly representative of the populations they serve. While median income data indicates most groups are reasonable well-represented at the professional level, with the exception of Filipinos, Blacks and Latin Americans, Canadian-born 25-34 year old visible minorities form 16.6 percent of those having healthcare degrees in this age cohort.
- There is serious under-representation in the police of visible minorities among junior and senior officers, particularly of note in our largest cities. Of particular concern is the low level of “except commissioned” officers in Montreal, Edmonton, Calgary and Ottawa-Gatineau, indicating that under-representation is unlikely to be addressed soon. This under-representation likely contributes to some of the tensions between communities (i.e., Black Canadians) and police. The lack of effective employment equity reporting by most police forces is symptomatic of a lack of attention to this issue.
- The federal public service is reasonably representative of the number of visible minorities who are also citizens, while the provinces and municipalities are less so in most provinces. Median income data shows considerable variation by level of government and visible minority group, particularly for Blacks, Filipinos and Arabs.
Charts and analysis

Chart 1
Chart 1 provides the gender breakdown in education, healthcare and social services using the North American Industry Classification System (NAICS). The percentage of women declines as the level of education increases; the percentage of women is similar in ambulatory services (doctors and dentist offices) and hospitals, and somewhat greater in nursing homes. For social services (individual and family services), the percentage of women is similar to healthcare but childcare is 92 percent women.

Chart 2
Chart 2 illustrates the median employment incomes for all generations of visible minorities working in these sectors. Given standard public sector pay scales, the variation reflects a combination of whether visible minorities are professionals or in support positions along with seniority (ambulatory excepted). The relatively low median inco mes of visible minorities compared to not visible minority (NVM) in all levels of education is striking, as is the higher median incomes in hospitals and nursing homes in healthcare. Median income of visible minorities in social services is largely comparable to NVM, likely reflecting relatively low salary bands and classification levels.
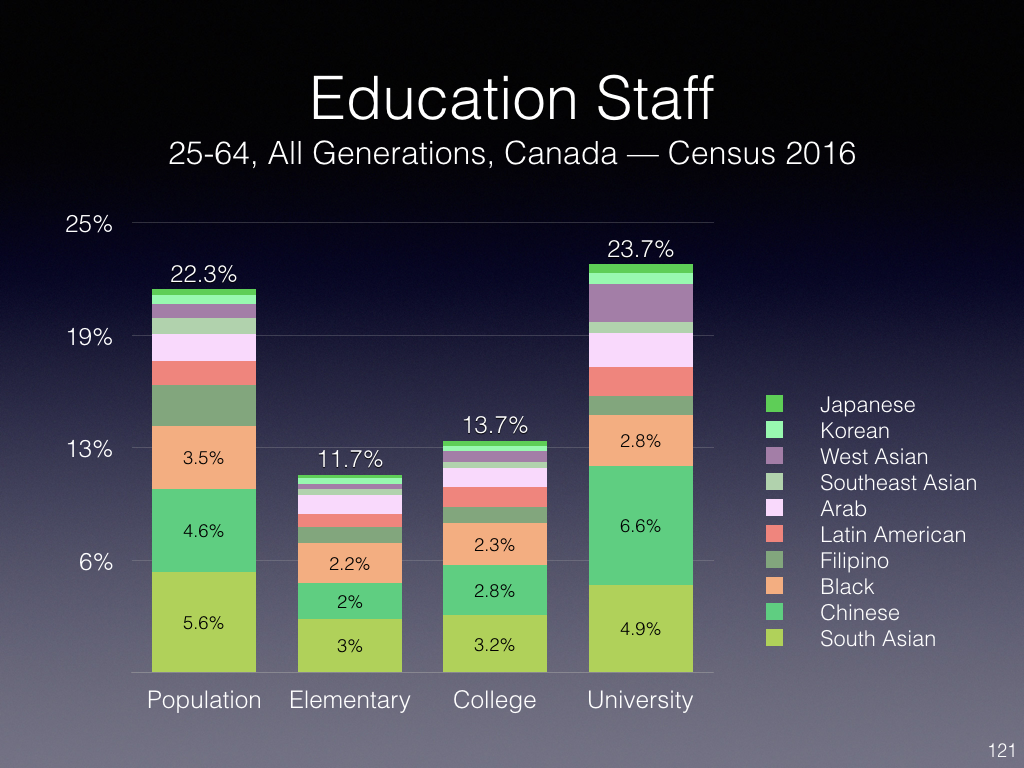
Chart 3
Chart 3 takes a closer look at visible minority representation in the education sector, contrasted with the overall diversity of the population. 792,000 persons work in elementary and high schools, by far the largest area (11.7 percent visible minority), 92,000 in community colleges and CEGEPS (13.7 percent visible minority), and 224,000 in universities (23.7 percent visible minority). Women comprise the majority at all three levels: elementary and secondary schools (73.6%), community colleges and CEGEPs (57.9%) and universities (54.1%).
In essence, students at the elementary and college levels are less likely to be taught by visible minority educators. In all provinces, the higher the level of education, the greater the number of visible minorities, with Canada-wide university representation (professors and support staff) reflecting the overall population levels.
Median income data provides insights on the extent to which visible minority groups are in professional or support positions. For elementary and secondary schools, all groups, save Chinese (8% lower) and Japanese Canadians (8 percent higher), have a disproportionate share of support positions and/or lower seniority (10 percent difference) compared to not visible minority (NVM). For community colleges and CEGEPs, all groups have significantly lower median incomes than NVM with Japanese Canadians having the least difference (6 percent). For universities, despite the overall greater diversity, median income data suggest that visible minorities are concentrated in more junior positions and support staff.

Chart 4
Chart 4 provides the provincial breakdown, once again contrasting provincial populations with representation in the education sector where the overall pattern of greater university level representation and relative under-representation at the elementary and secondary levels can be seen. In the largest provinces, university representation is broadly reflective of the population; in smaller provinces, university representation is significantly greater than the population.

Chart 5
Chart 5 compares the overall visible minority population with those working in healthcare and social services.
Approximately 1.5 million persons work in healthcare: 564,000 in ambulatory services, 632,000 in hospitals and 328,000 in nursing homes. About 344,000 work in social services, of which 149,000 in individual and family services and 194,000 in childcare.
Starting with healthcare, group representation varies by sector. The major visible minority groups are represented in all sectors shown with some relative over-representation of Chinese in ambulatory services, Blacks in hospitals, nursing homes, and social services, Filipinos in all sectors and Arabs dramatically so in childcare.
Median income data indicate that South Asians, Chinese, Arabs and Southeast Asians are more likely to be in professional positions in doctor offices; Chinese, Southeast Asians, Korean and Japanese in dental offices. Hospital median income data highlight that South Asians, Chinese, West Asians, Korean and Japanese are more likely to be in professional positions. Groups that tend to be more in support positions are Filipino, Black and Latin American.
Chinese, Arab, West Asian and Korean are over-represented by men compared to not visible minority (10 percent difference), with the relative gender gap particularly high for Arabs (23 percent).

Chart 6
Chart 6 provides the healthcare visible minority representation by province, reflecting the overall pattern of representation comparable to the visible minority population, with noticeable over-representation of visible minorities in nursing homes.
Visible minorities are over-represented in Manitoba and Saskatchewan (hospitals and nursing homes only), and the under-representation in Quebec ambulatory services likely reflects the low visible minority population outside of Montreal and environs.
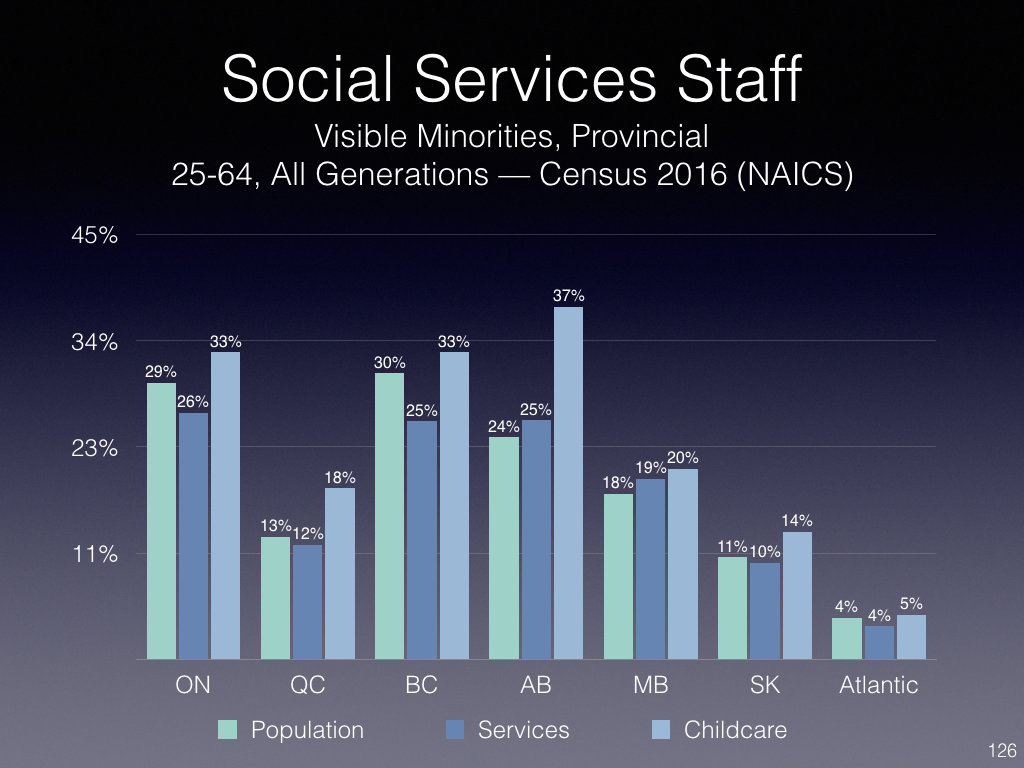
Chart 7
Chart 7 contrasts the visible minority workers in social services and childcare, again reflecting the overall national pattern, with the striking over-representation of visible minorities in childcare in most provinces.

Chart 8
Chart 8 provides the national breakdown of visible minority police officers, separated out by commissioned (senior) and “except commissioned” (junior) officers, again contrasted with the overall visible minority population. There are 2,015 commissioned officers and 75,670 non-commissioned officers. Given mixed to limited reporting by police forces, this provides the best measure of police force diversity.
As one would expect, not commissioned officer diversity is greater than the senior ranks, providing a feeder group to increase commissioned officer diversity over time.
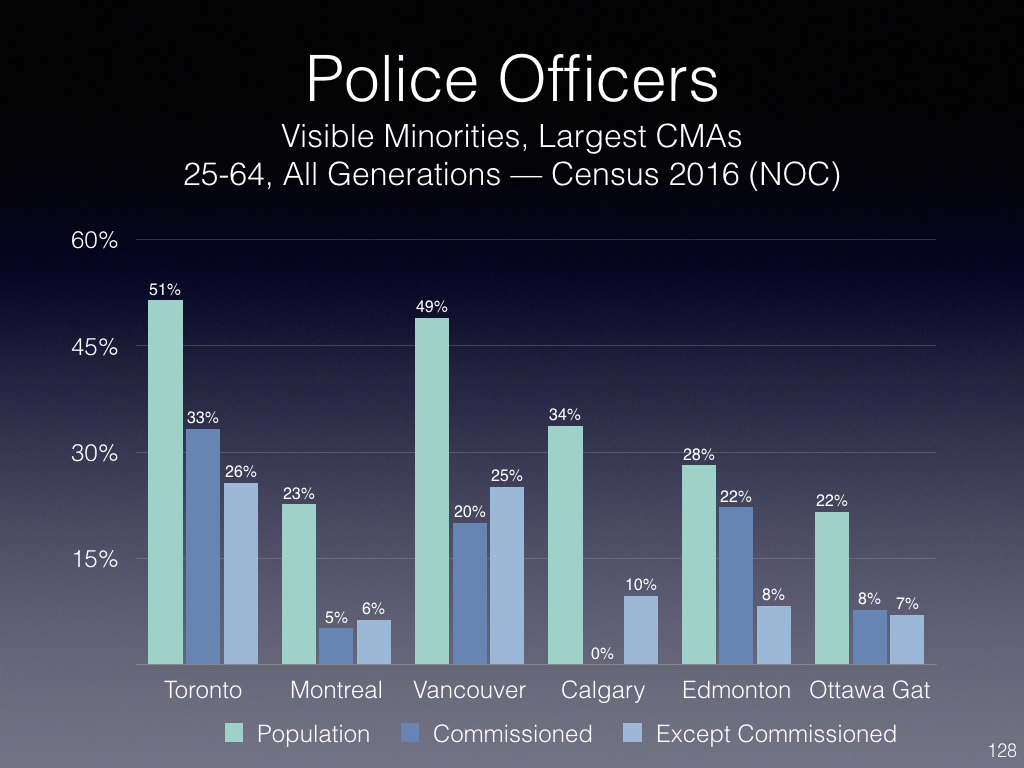
Chart 9
Chart 9 looks at the diversity of police forces in six of Canada’s largest cities. It is a mixed picture: while the overall pattern of under-representation remains, in some cities the percentage of visible minority commissioned officers is greater than not commissioned, suggesting a conscious decision to ensure greater representation at senior levels (e.g., Toronto, Edmonton).
Equally striking is the relative lack of visible minority police in Montreal (both commissioned and except commissioned), Calgary (no visible minority commissioned officers) and Edmonton (except commissioned).
The integrated numbers for Ottawa Gatineau disguise significant differences: whereas in Ottawa visible minority commissioned officers form 8.7 percent, except commissioned 8.5 percent, in Gatineau there are no visible minority commissioned officers and only 2.9 percent of except commissioned officers are visible minorities

Chart 10
Census data provide a useful counterpoint to the annual Treasury Board Secretariat (TBS) employment equity reports. TBS reports have a richer dataset than the Census (regional, occupational group, salary, age and other breakdowns) but they only cover Schedule 1 bodies and do not include Schedule 2 bodies (e.g., CRA, CFIA, CSIS, NRCE, Parks Canada) or Schedule 3 (Crown corporations) and do not provide a breakdown by visible minority groups. Census data also provide consistent data at the provincial and municipal levels. The population benchmark used is that of visible minorities who are also Canadian citizens, given the preference in hiring citizens.
Chart 10 not only provides the overall visible minority representation, but breaks this down by the different visible minority groups. About 317,000 persons work in federal public administration (all except defence), 269,000 in provincial public administration and 340,000 in municipal. Significantly more women than men work in federal and provincial public administration (55.6 and 58.9 percent respectively) whereas municipal public administration is majority male (60.6 percent), reflecting the nature of municipal services (e.g., garbage collection, road maintenance).
At the federal level, only Chinese, Arabs and Japanese public servants reflect or are greater than the overall visible minority citizen population. All other groups are under-represented by 10 percent or more.

Chart 11
Chart 11 contrasts provincial and municipal public administrations with the overall number of visible minority citizens. Provincial visible minority public servants largely mirror the overall number of visible minorities with the notable under-representation in British Columbia and slight overrepresentation in Alberta, Manitoba, and Saskatchewan. Municipal pu blic administration visible minority public servants are under represented in all provinces save Saskatchewan and Atlantic Canada, and in some cases, significantly as is the case in Ontario, Quebec and British Columbia.
All groups, save Black, are underrepresented at the provincial level and all groups save Japanese are under-represented at the municipal level.
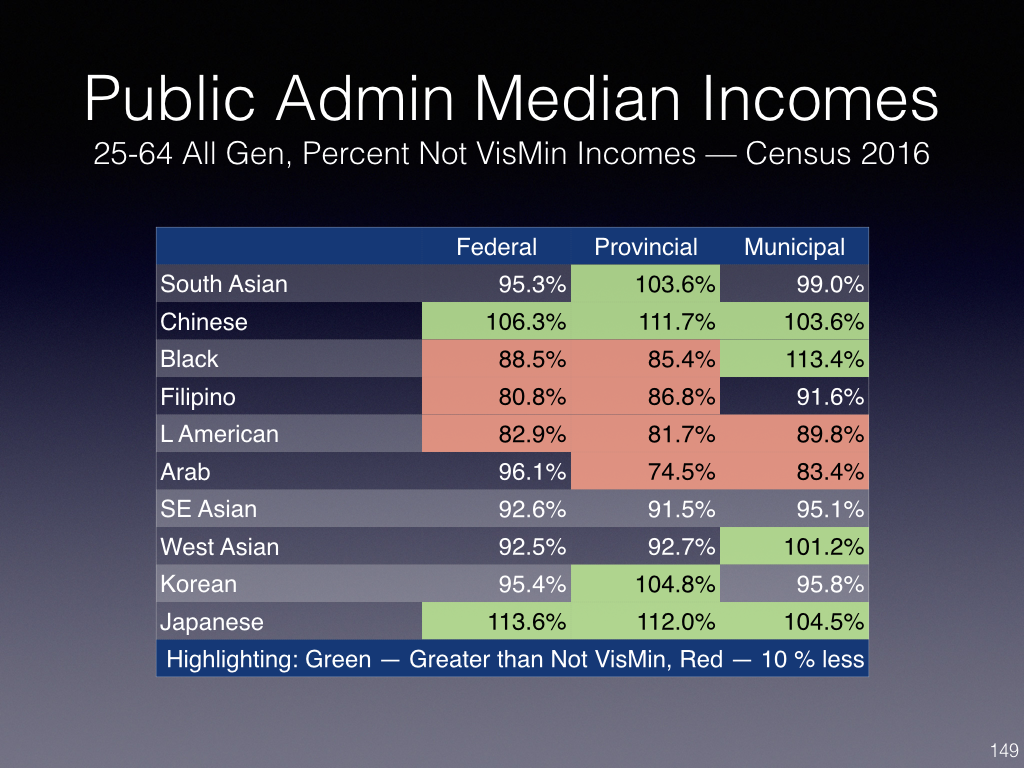
Chart 12
Chart 12 compares the median income of visible minority groups compared to not visible minority for each level of government, providing an indication of whether groups are in more senior or junior positions.
Only Chinese and Japanese public servants have higher median incomes for all three levels of government. South Asian provincial public servants, Black and West Asian municipal public servants and Korean provincial public servants also have higher median incomes. The greatest gaps in median incomes are for Black (save municipal), Filipino, Latin American and Arab (save federal).

