Usher: A First Look At 2021 Education Census Data
2022/12/06 Leave a comment
Good analysis of census data by HESA:
Figure 1 shows the attainment rates of the population aged 25-64, by visible minority status and Indigenous identity. What it shows is that there are some quite fascinating differences in attainment rates across different segments of the population. Individuals who self-declare as visible minorities are somewhat less likely than other Canadian to have a PSE credential below the bachelor’s level but substantially more likely to have a degree at the bachelor’s level or above. Those reporting Indigenous identity, meanwhile, have college credentials at higher levels similar to those of non-visible minority/non-Indigenous Canadians, but university attainment rates substantially lower than those of other Canadians. White Canadians have higher college attainment rates than visible minorities, but substantially lower university attainment rates.
Figure 1: Post-Secondary Education Attainment by Level, Visible Minority Status and Indigenous Identity, Canadians Aged 25-64, Census 2021
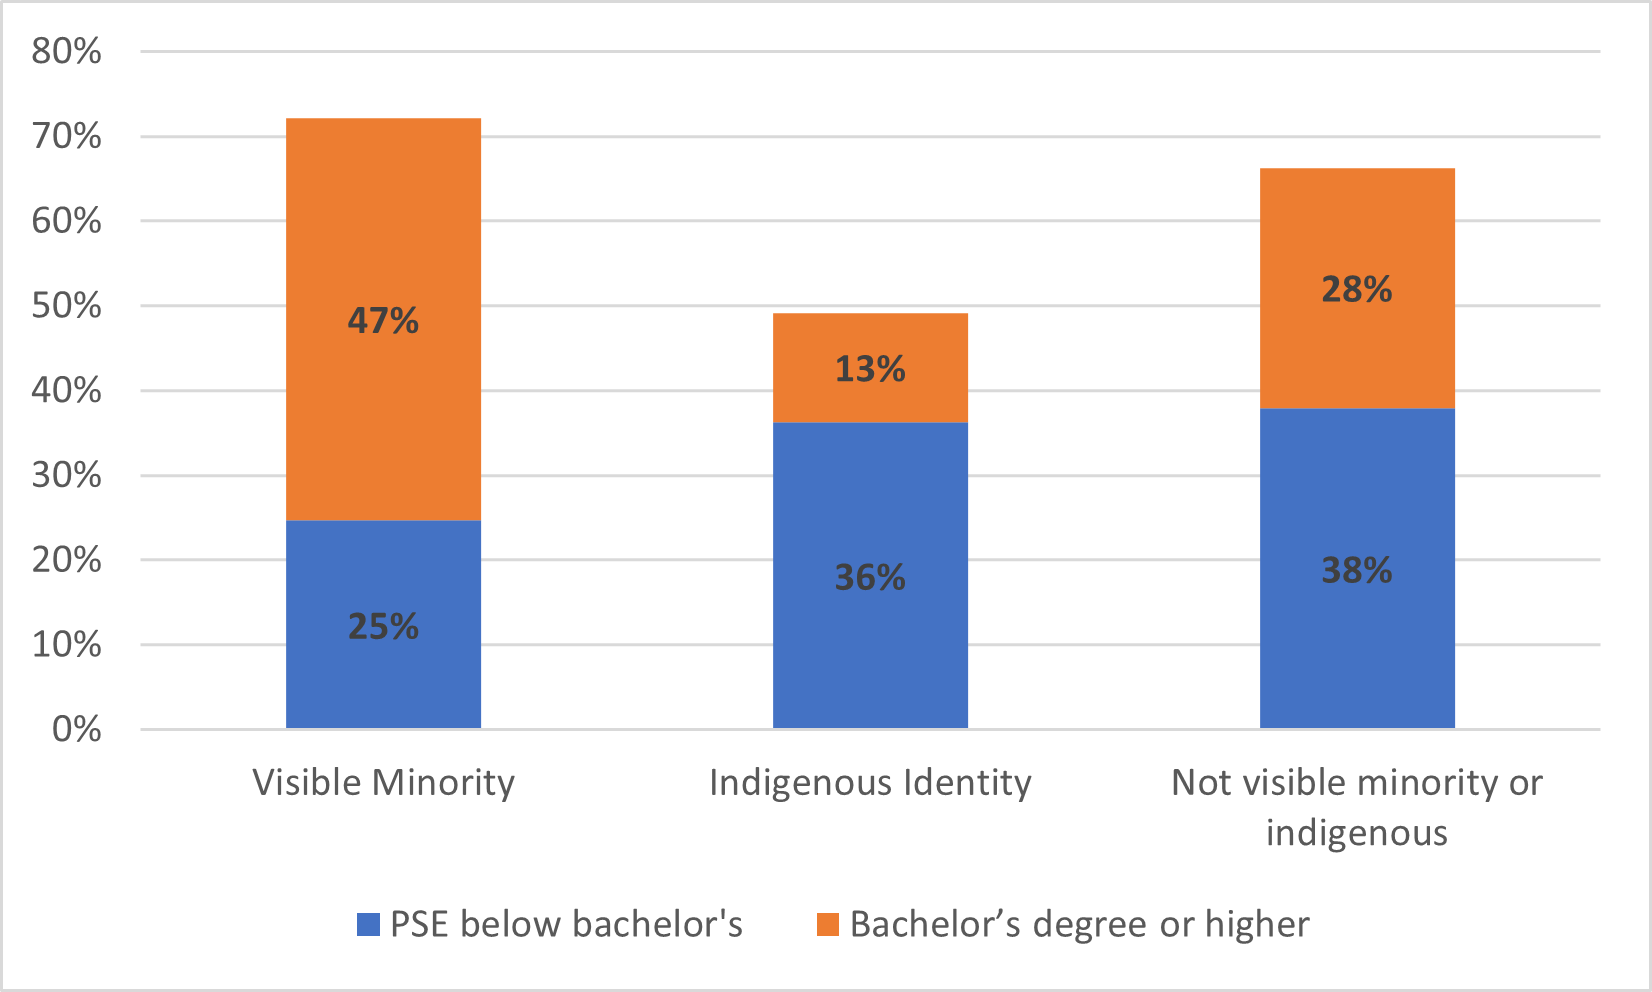
This is, by the way, quite different from the situation in basically any other developed country except perhaps Australia and New Zealand; in most other countries with large scale immigration, visible minority populations tend to have much lower levels of education that the mainstream population.
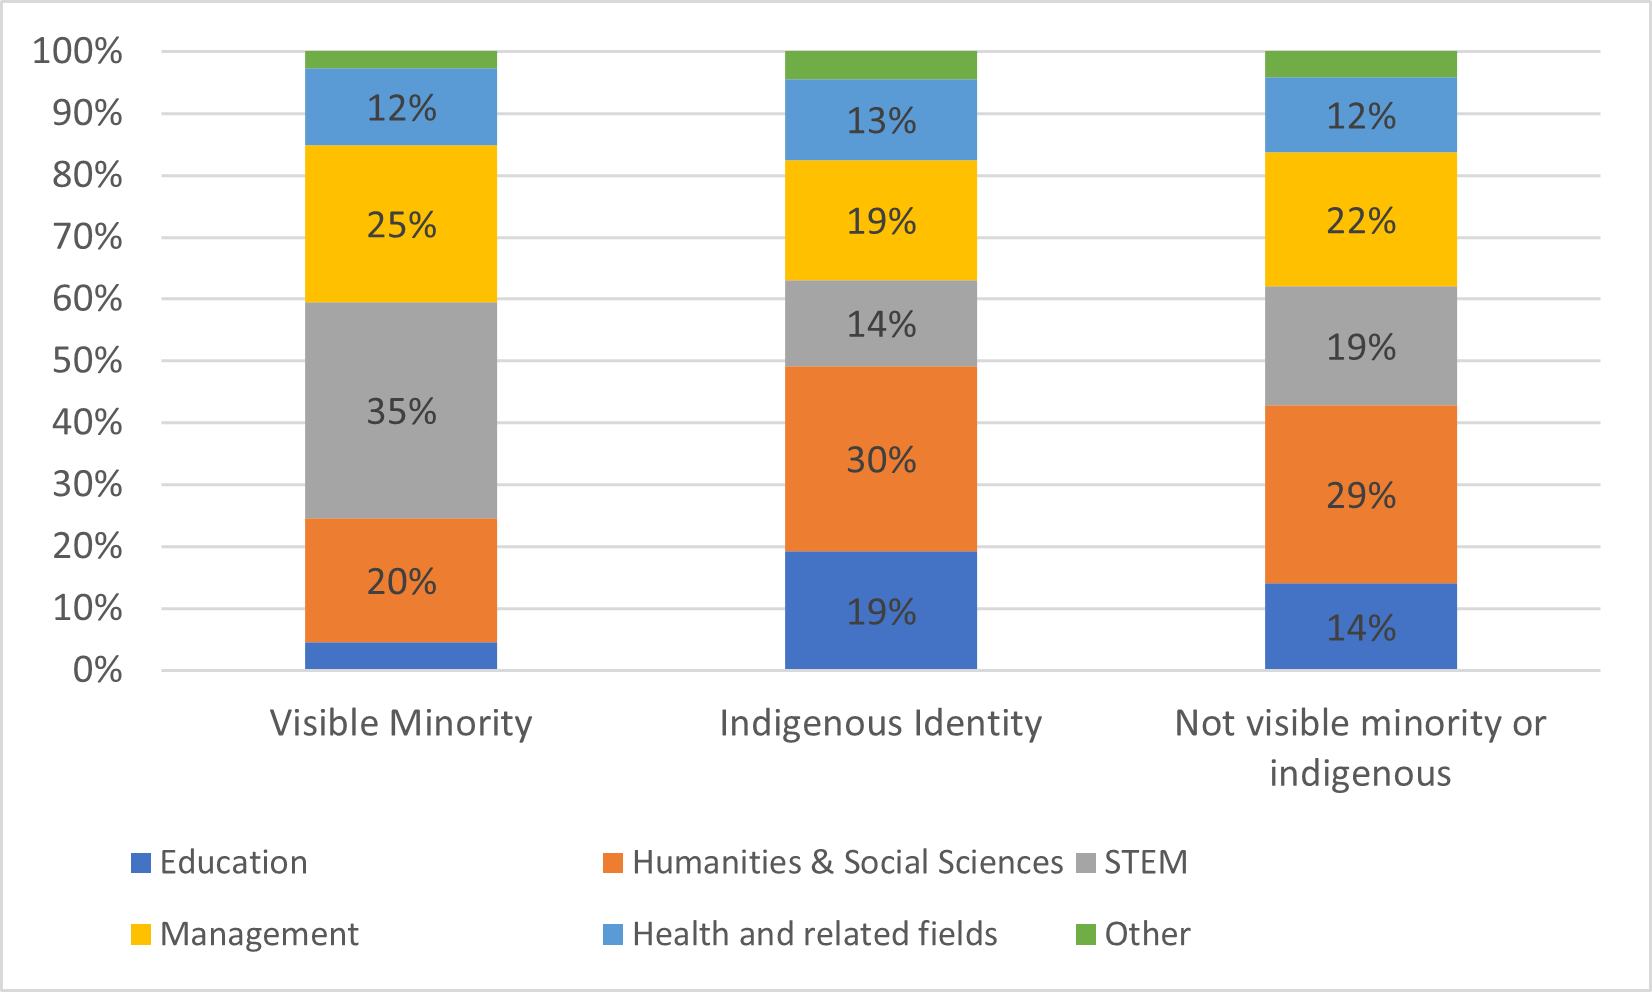
One of the interesting things about this census is that it permits analysis not just by level of education but also by field of study. Figure 2 runs the same analysis as figure 1, only examining the distribution of undergraduate degrees. Again, we see some interesting distributions by visible minority/Indigenous identity. The proportions of Canadians of various backgrounds who are in the fields of health and business are relatively consistent, but there are huge differences in the areas of education, social sciences/humanities and STEM. For those with Indigenous identities, 45% of all degrees are in education, humanities and social sciences, while only 14% of all degrees are in STEM; among visible minorities (who, recall, are more than 3 times as likely to have a degree as those with Indigenous identity), it is 25% in education, humanities and social sciences and 35% in STEM.
Figure 2: Distribution of Degrees by Broad Field, Visible Minority Status and Indigenous Identity, Canadians Aged 25-64, Census 2021
We can run the same kind of analyses by immigration status. In figures 3 and 4, we repeat the analysis in figures 1 and 2, only by immigration status. Statistics Canada divides Canadians into “first generation” (basically, individuals born outside Canada), “second generation” (at least one parent born outside Canada) and “third generation or more” (both parents born in Canada). That second category is – if you ask me – a heck of a hodge-podge, so focus on the difference between first and third generations.
Figure 3: Post-Secondary Education Attainment by Level and Immigration Generation, Canadians Aged 25-64, Census 2021
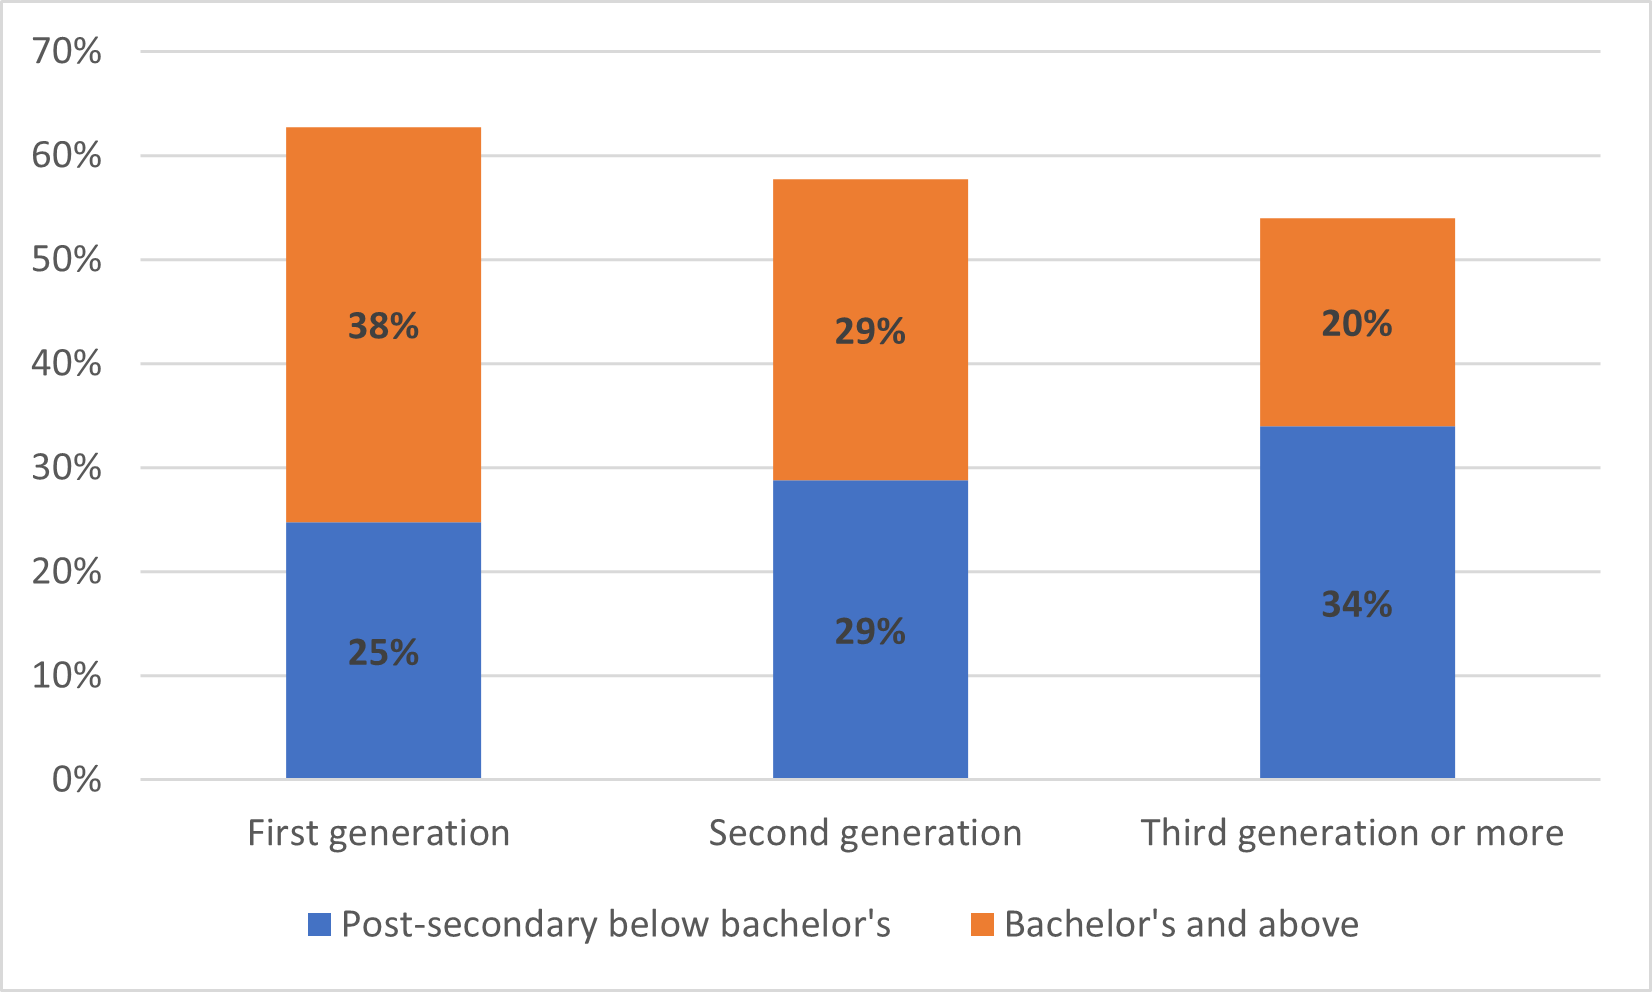
Figure 4: Distribution of Degrees by Broad Field and by Immigration Generation, Canadians Aged 25-64 Census 2021
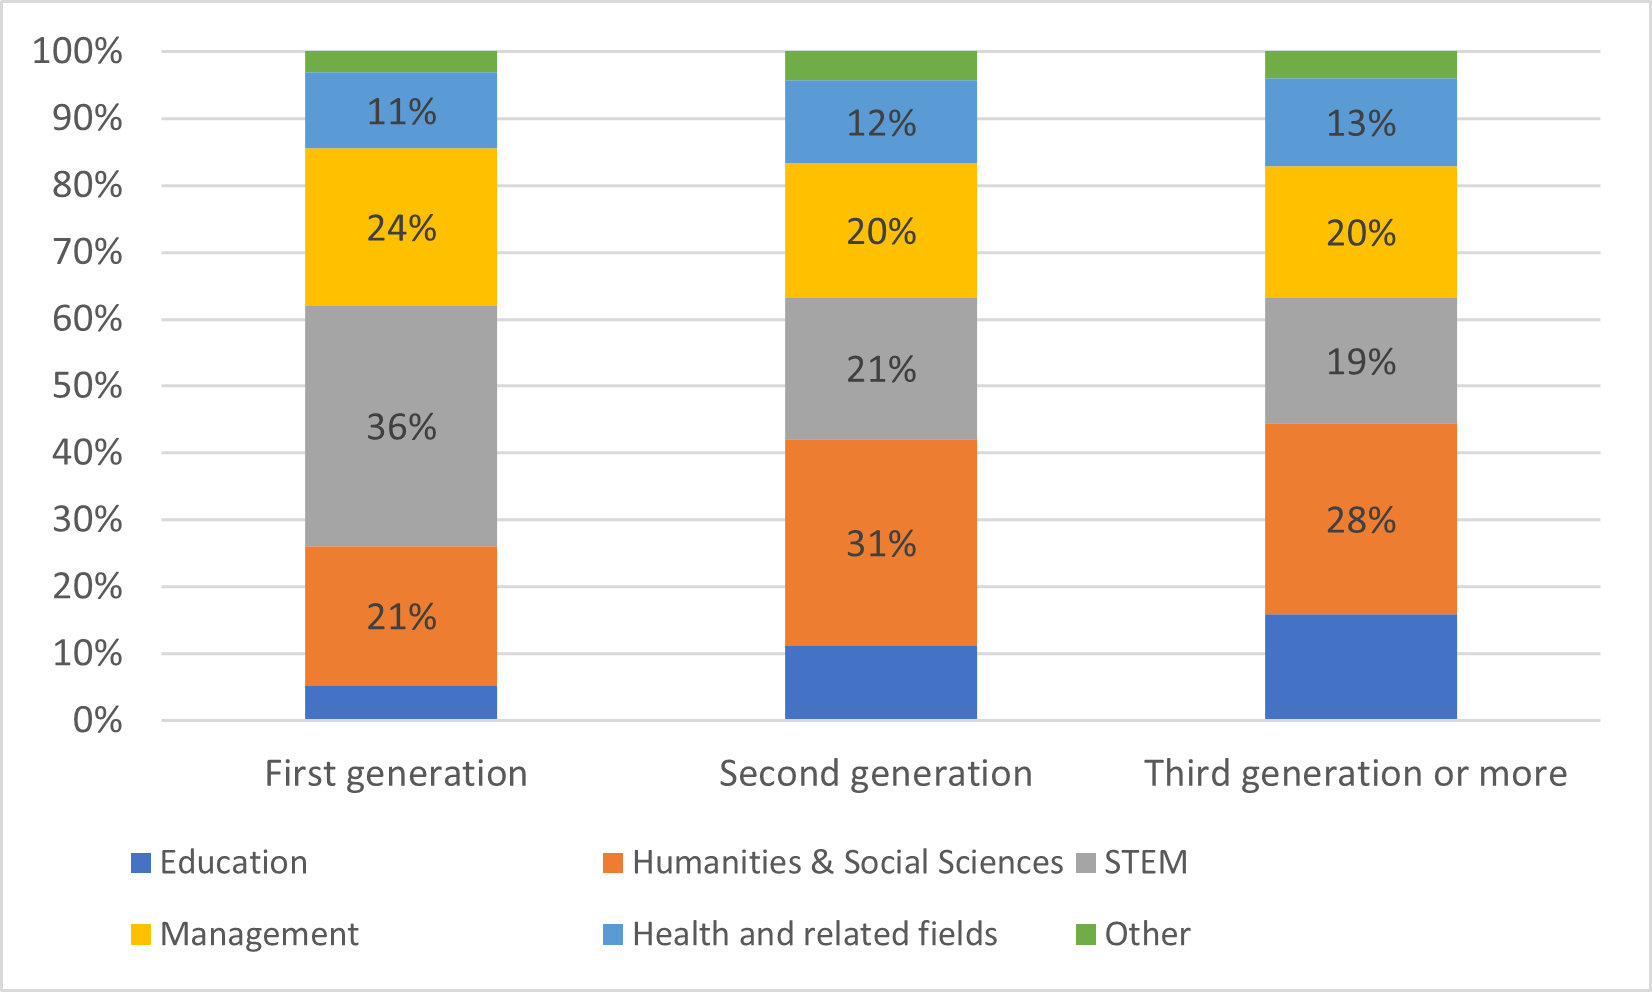
There’s an old (American) cliche about how the first generation of immigrant families works hard in menial jobs to make sure their kids get ahead, the second generation works hard to get into professional schools and attract great wealth while the third generation goes to art school. By the looks of it, Canada’s points-based immigration system allows us to skip that first generation thus bringing immigrants into humanities and arts programs that much faster.

