Canadian Immigration Tracker – November 2024

Highlights:

  • PR Admissions: Increase from 34,360 in October to 36,820 in November. November year-over-year change (change from 2022 in parentheses): Economic – PNP 25.0% (22.8%), Economic – Federal 38.2% (51.6%), Family 52.4% (84.0%), Refugees -19.3% (-12.6%)
    • Applications: Given time delays in entering application data, am using a six month time lag. Decrease from 54,001 in April to 44,040 in May. May year-over-year change (change from 2020): -10.7% (81.9%).
    • Express Entry and Arrima Invitations to Apply: Decline from 5,507 in November (0 Arrima) to 2,561 in December (0 Arrima). December year-over-year change (change from 2022): -84.2% (23.3%)
    • TR to PRs transition (i.e., those already in Canada): Increase from 13,135 in October (38.2% of all PRs) to 17,390 in November (47.2% of all PRs). November year-over-year change (change from 2022): 65.3% (347.0%)
  • Temporary Residents:
    • TRs/IMP: Decrease from 60,945 in October to 48,560 in November. November year-over-year (change from 2022): Agreements: 29.0% (-30.4%), Canadian Interests: -11.4% (-7.5%), Other IMP Participants -47.7% (105.2%), Not stated -39.8% (-43.4%)
      • IMP by occupation code: not meaningful given only about 10 percent have NOC codes
    • TRs/TFWP: Stable from 11,860 in October to 11,540. November year-over-year change (change from 2022): Caregivers 12.2% (19.6%), Agriculture -1.1% (-20.0%) and Other LMIA 6.3% (32.6%).
    • TRs by occupation code (September, updated quarterly): 39.8% low-wage (D), year-over-year (D) change (change from 2022) 14.0% (157.4%)
  • Students: Decrease from 32,100 in October to 28,470 in November. November year-over-year change (change from 2023): All -3.1% (22.0%), post-secondary -1.4% (22.7%)
    • Applications: Decrease from 40,846 in October to 39,759 in November. November year-over-year change (change from 2021): -53.6% (-49.3%)
    • Web Get a study permit: Increase from 29,396 in October to 51,416 in November. November year-over-year change (change from 2022): -0.1% (-25.0%) (December data not released)
  • Asylum Claimants: Decrease from 14,155 in October to 12,590 in November. November year-over-year change (change from 2022): -22.9% (28.5%)
    • Irregular arrivals (Roxham Road etc): Increase from 62 in October to 79 in November. November year-over-year change (change from 2021): 21.5% (-97.9%).
  • Settlement Services (2023): Increase from 1,941,480 in 2022 to 2,960,330 in 2023 (most recent data, services, not unique clients). 2023 year-over-year (change from 2021): 52.5% (53.3%)
  • Citizenship: Stable from 26,082 in October to 25,234 in November. November year-over-year change (change from 2022): -28.9% (-29.1%)
    • Applications (2023): From 264,231 in 2022 to 317,538 in 2023. 2023 Year-over-year change (change from 2021): 20.2%% (36.3%)
  • Visitor Visas: Stable from 102,304 in October to 100,845 in November. November year-over-year change (change from 2022): -34.2% (-24.9%).

https://www.slideshare.net/slideshow/canadian-immigration-tracker-key-slides-november-2024-pdf/274868539

Canadian Immigration Tracker – October 2024 Update

Year to date highlights:

  • Permanent residents admissions: Increase January-October from 404,000 in 2023 to 413,000 in 2024 or 2.3 percent.   
  • TR2PR (Those already in Canada): Increase January-October from 212,000 in 2023 to 219,000 in 2024 or 3.3 percent. 
  • TRs-IMP: Decrease January-October from 757,000 in 2023 to 648,000 in 2024 or -14.5 percent.
  • TRs-TFWP: Decrease January-October from 172,000 in 2023 to 165,000 in 2024 or -4.0 percent.
  • Students: Decrease January-October from 570,000 in 2023 to 461,000 in 2024 or -19.2 percent. Post-secondary only: Decline from 431,000 to 328,000 or 23.9 percent.
  • Asylum Claimants: Increase January-October from 117,000 in 2023 to 149,000 in 2024 or 27.3 percent.
  • Citizenship: Increase January-October from 317,000 in 2023 to 329,000 in 2024 or 3.7 percent.
  • Visitor Visas: Decrease January-October from 1,567,000 in 2023 to 1,290,000 in 2024 or -17.7 percent.

https://www.slideshare.net/slideshow/canadian-immigration-tracker-october-2024-pdf/274022459

COVID-19 Immigration Effects – September 2024 Third Quarter

Highlights (some data not yet posted on open data)

  • Permanent residents admissions: Increase January-September from 370,000 in 2023 to 379,000 in 2024 or 2.3 percent.   
  • TR2PR (Those already in Canada): Increase January-September from 199,000 in 2023 to 205,000 in 2024 or 3.3 percent. 
  • TRs-IMP: Decrease January-September from 681,000 in 2023 to 584,000 in 2024 or -14.2 percent.
  • TRs-TFWP: Decrease January-September from 160,000 in 2023 to 153,000 in 2024 or -4.0 percent.
  • Students: Decrease January-September from 544,000 in 2023 to 428,000 in 2024 or -21.3 percent. 
  • Asylum Claimants: Increase January-September from 100,000 in 2023 to 135,000 in 2024 or 34.6 percent.
  • Citizenship: Increase from 33,179 in June to 36,070 in July. July year-over-year change (change from 2022): 15.4% (25.0%). Year-to date 2024 compared to 2023 increase of 16 percent OPEN DATA NOT UPDATED FOR AUGUST AND SEPTEMBER
  • Visitor Visas: Increase from 118,402 in June to 127,399 in July. July year-over-year change (change from 2022): -19.7% (37.6%). OPEN DATA NOT UPDATED FOR AUGUST AND SEPTEMBER

https://www.slideshare.net/slideshow/canadian-immigration-tracker-key-slides-september-2024/273373580

What citizenship applications tell us about policy implementation

My latest in The Hill Times. Password protected so here is the analysis (tables simplified in the HT):  

Analysis of citizenship applications between 2005 and 2023 reveals how the previous Conservative government’s pledge to make citizenship “harder to get and easier to lose” resulted in significant delays and reduced approval rates before political realities resulted in mitigating those impacts. The Liberal government reversion to previous residency and other requirements cemented a return to historic approval rates and processing times.

This analysis looks at four periods, roughly aligned to Census periods:

  • 2005-10: During this period, the new Discover Canada citizenship study guide was introduced in 2009 with more detailed content and more complex language, along with a more rigorous knowledge test based upon the guide and more objective language assessments. The policy intent was in part to reduce the previous approval rate of approximately 95 percent to between 80 and 85 percent (“harder to get”).
  • 2011-15: The impact of these 2009-10 operational policy changes was felt during this period. In addition, the Conservative government passed C-24 (Strengthening Canadian Citizenship Act) in 2014, expanding knowledge testing and language assessment to those between 14 and 64 years old compared to the previous 18 and 54. Fees increased from $200 to $630 per adult or over $1,400 for a family of four in 2015. The fee increases may have been a Treasury Board condition in order to obtain funding to address a processing backlog.  Revocation provisions for “treason and terror” were included.
  • 2016-20: The election of a Liberal government resulted in the reversal of knowledge and language assessment to those between 18 and 64 years old and removed the revocation provisions, among other changes. The Liberal party’s 2019 and 2021 election platforms committed to waiving citizenship fees but were not implemented. Similarly, successive ministers of immigration have noted plans for a revision to Discover Canada but the current version remains in effect.
  • 2021-24: The citizenship oath was updated with a reference to indigenous treaty rights in 2021. The pandemic resulted in the virtual shutdown of citizenship ceremonies for a number of months and a shift to the majority of ceremonies taking place on line. The proposed repeal of the first generation limit in C-71 and replacement by a time-unlimited residency requirement would result in an unknown number of additional Canadian citizens.  

 Application data by gender, immigration category or country of birth highlights the dramatic initial impact of the policy changes of the Conservative government and how these were relaxed by the Conservatives themselves before having virtually no impact after a number of years under the Liberals. The same pattern applies no matter what the variable, the 2011-15 period was the worst period in terms of delays and approval rates.

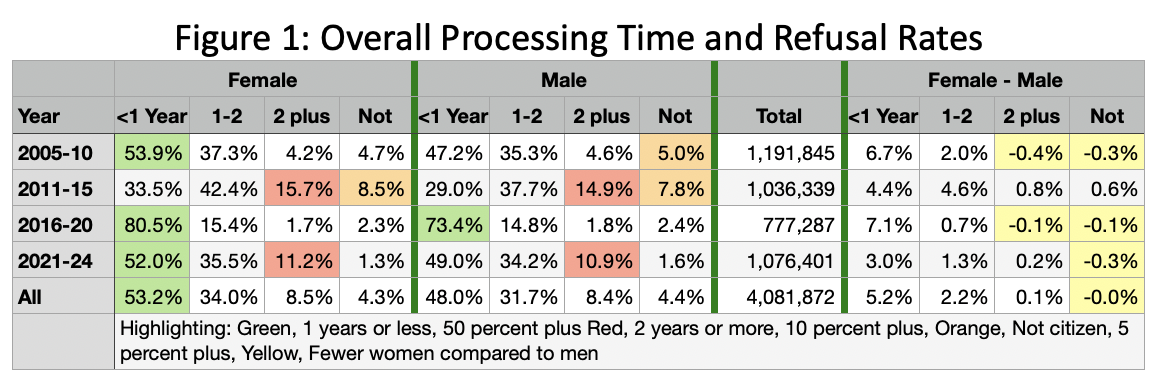
Figure 1 provides the overview by period highlighting that in general, women applicants were granted citizenship faster than men and had higher approval rages, save for the 2011-15 period. The percentage not granted citizenship rose to over ten percent in 2012 and 2013, before recovering to just over seven percent in the last years of the Conservative government. Moreover, only about 20 percent of applications were processed within the service standard of one year 2010-13. Apart from the pandemic years 2021-22, service standards were met close to 80 percent of the time.

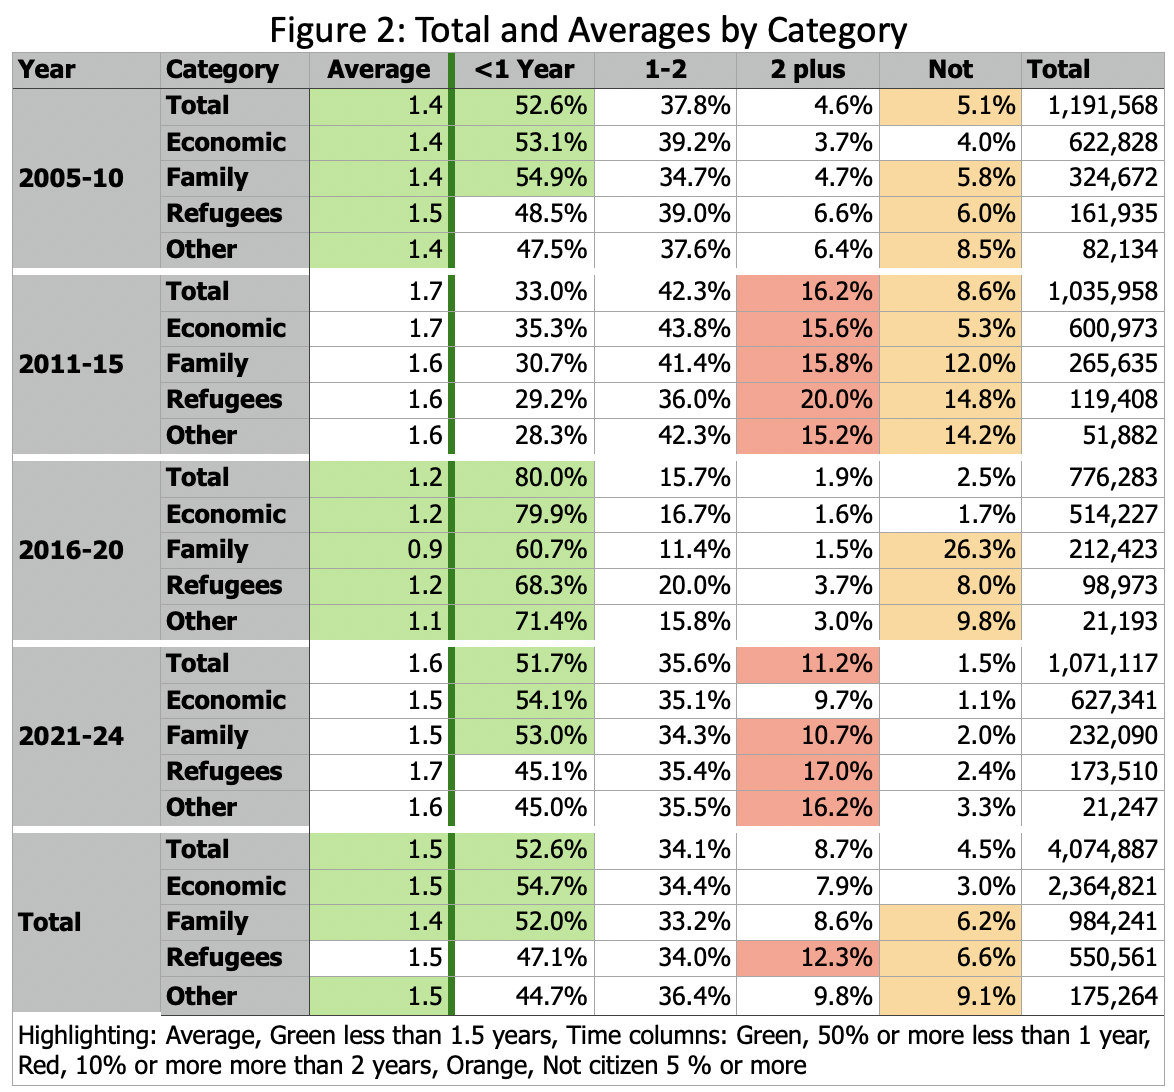
Figure 2 provides the category comparison, highlighting lower refusal rates for economic class and particularly relatively higher refusal rates immigrants for family and refugee class during the first years of the Liberal government, given that legislation reversing the Conservative age range requirement for knowledge and language assessment only came into force October 2017. But since then, refusal rates are negligible, less than three percent, or lower than 2005.

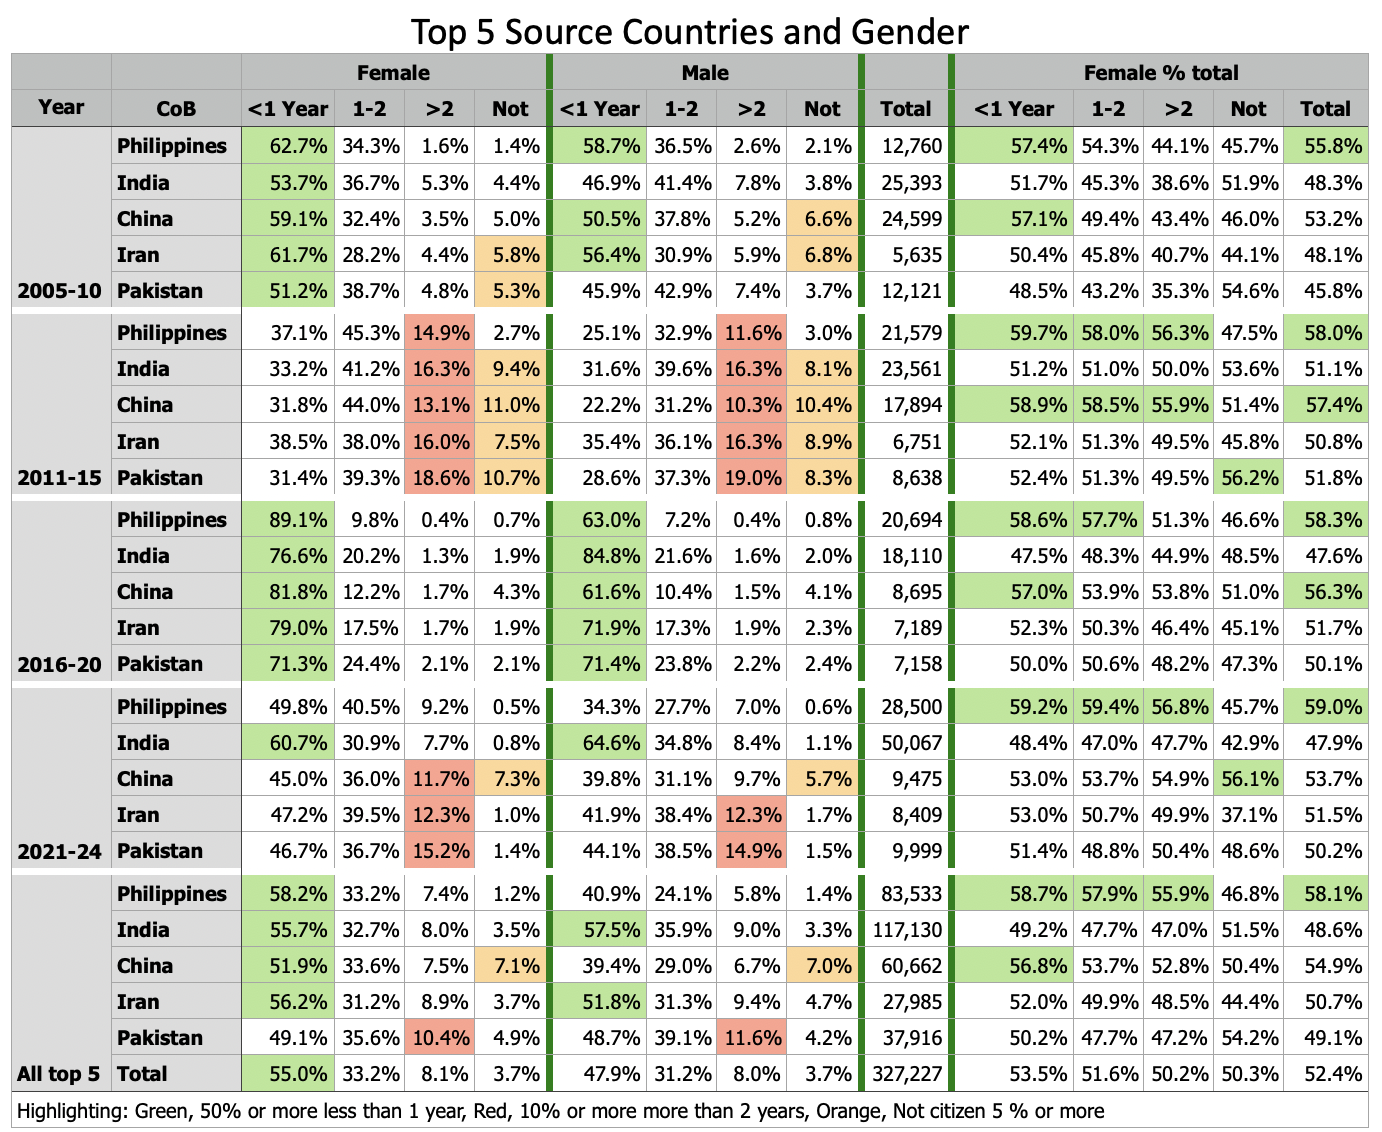
Figure 3 shows the impact on the five largest immigration source countries, showing again the same overall pattern. Of particular note is the higher rate of Chinese rejections across most periods which may reflect weaker language fluency compared to the other large source countries. 

Concluding observations

This analysis highlights the impact that operational policy changes can have on citizenship, making naturalization harder or easier, particularly for family class and refugees. The effective relaxation of knowledge and language assessment in 2014-15 reflects high refusal rates were not politically tenable, particularly in the lead up to the 2015 election.

Application data suggests that immigrants delayed submitting applications 2016-17 once the Liberal government announced it would return to the previous 18 to 54 age requirements. The data also shows a drop in applications in 2020 reflecting applicants waiting for the government to implement its 2019 election commitment to eliminate citizenship fees.

Citizenship applicants pay attention to operational and legislative policy changes and adjust their application timing accordingly. 

It is unclear whether or not citizenship changes would be a priority for an expected Conservative government and whether it would want to revert to Harper-era policies. However, citizenship changes would likely be a lessor priority than immigration changes given changing public sentiment on immigration that reflecting debates and discussion on immigration’s impact on housing and healthcare. 

Moreover, the fact that the previous government had to soften its “harder to get” approach may provide a cautionary tale in terms of what may or may not be acceptable to immigrant-origin communities. 

Methodological notes

Data provided by IRCC, 2005 to April 2024.  This partial 2024 data included in overall 2021-24 numbers.

 Source: What citizenship applications tell us about policy implementation

COVID-19 Immigration Effects – July 2024 update

Highlights:

  • Permanent residents admissions: PR Admissions: Increase from 44,530 in June to 47,770 in July. July year-over-year change (change from 2022 in parentheses): Economic – PNP 34.9% (15.0%), Economic – Federal 11.7% (0.7%), Family 2.8% (-2.1%), Refugees 14.4% (30.8%)
  • TR2PR (Those already in Canada): Increase from 19,170 in June (43% of all PRs) to 22,100 in July (46.3% of all PRs). July year-over-year change (change from 2022): 10.6% (32.5%)
  • TRs-IMP: Decrease from 70,435 in June to 61,510 in July. July year-over-year (change from 2022): Agreements: 205.6% (-32.8%), Canadian Interests: -27.7% (29.9%), Other IMP Participants -56.1% (430.3%), Not stated -18.0% (-17.7%)
  • TRs-TFWs: Decrease from 19,230 in June to15,330 in July. July year-over-year change (change from 2022): Caregivers -18.8% (0.0%), Agriculture -23.0% (-19.5%) and Other LMIA -9.4% (79.4%).
  • NEW: TRs by occupation code (June, will be updated quarterly): 58 % low-wage (D), year-over-year change (change from 2022) 18.5% (571.3%): 
  • Students: Increase from 29,420 in June to 35,105 in July. July year-over-year change (change from 2023): -35.4% post-secondary -41.5% (-5.1%). Year-to date 2024 compared to 2023 decline of 4 percent 
  • Asylum Claimants: Stable, from 14,485 in June to 14,825 in July. July year-over-year change (change from 2022): 23.4% (90.1%)
  • Citizenship: Increase from 33,179 in June to 36,070 in July. July year-over-year change (change from 2022): 15.4% (25.0%). Year-to date 2024 compared to 2023 increase of 16 percent
  • Visitor Visas: Increase from 118,402 in June to 127,399 in July. July year-over-year change (change from 2022): -19.7% (37.6%).Slide 3 has the overall numbers and change.

https://www.slideshare.net/slideshow/canadian-immigration-tracker-key-slides-july-2024-pdf/271760138

TFWP: Setting the baseline to evaluate government changes

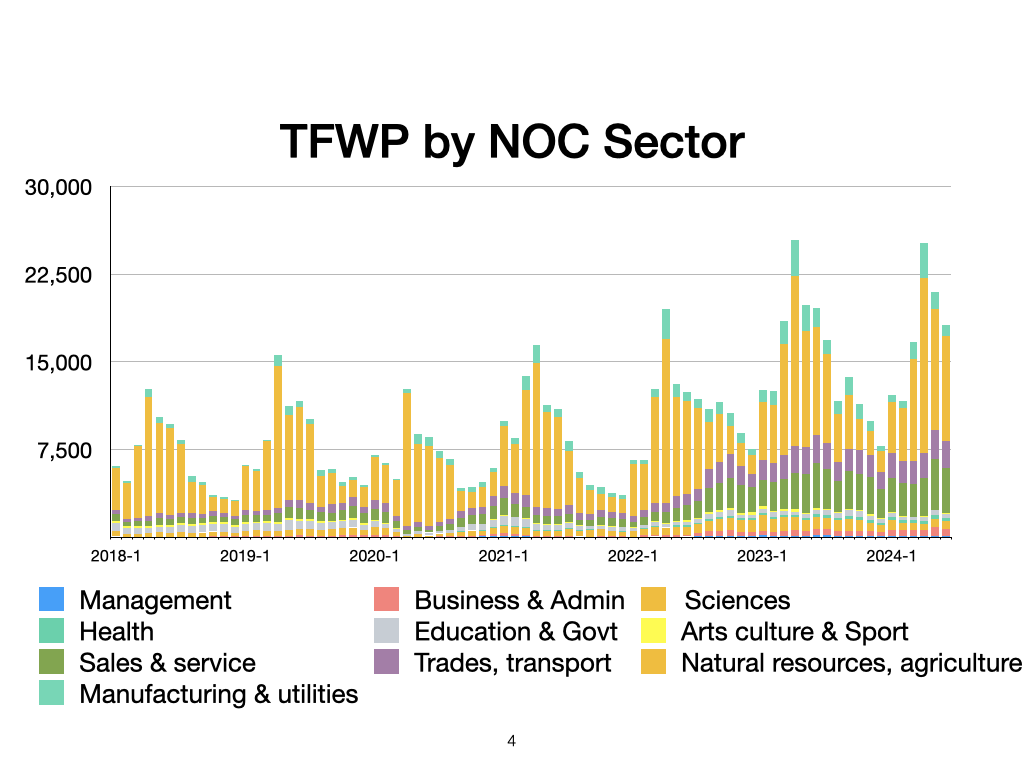
Just as the impact of the caps on international students is becoming apparent through monthly and quarterly numbers for post-secondary study permits, one can expect the government’s restrictions on low-wage temporary workers to start have an impact in the October-December quarter.

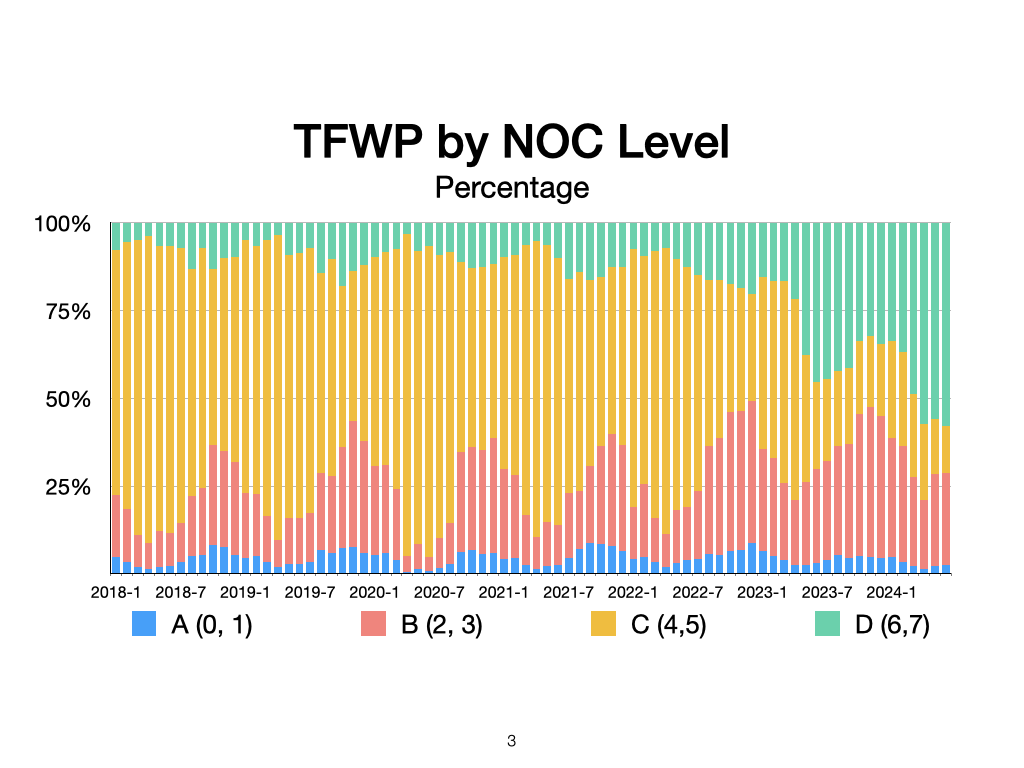
To better monitor and assess the impact, I prepared some charts on Temporary Foreign Workers by NOC Code. For those unfamiliar with the codes A 0 or 1: university degree, B 2 or 3: community college, apprenticeship, more than 2 years on the job, occupations with supervisory responsibilities or significant health and safety responsibilities, C 4 or 5: some secondary education, up to two years on-the-job training or equivalent, D 6 or 7: on-the-job training.

The following slides highlight the shift over the past five years. This provides a good overview and the context for articles like The sudden rise of temporary foreign workers in entry-level office jobs.

Starting with two views by NOC level, the numbers and the percentage shares which show the dramatic increase, both absolute and in percentage, of the low wage and low skilled temporary workers. Interestingly, there has been a squeezing of level C workers:

The next two slides provide the breakdown by NOC sector where sales & service and natural resources & agriculture have increased the most:

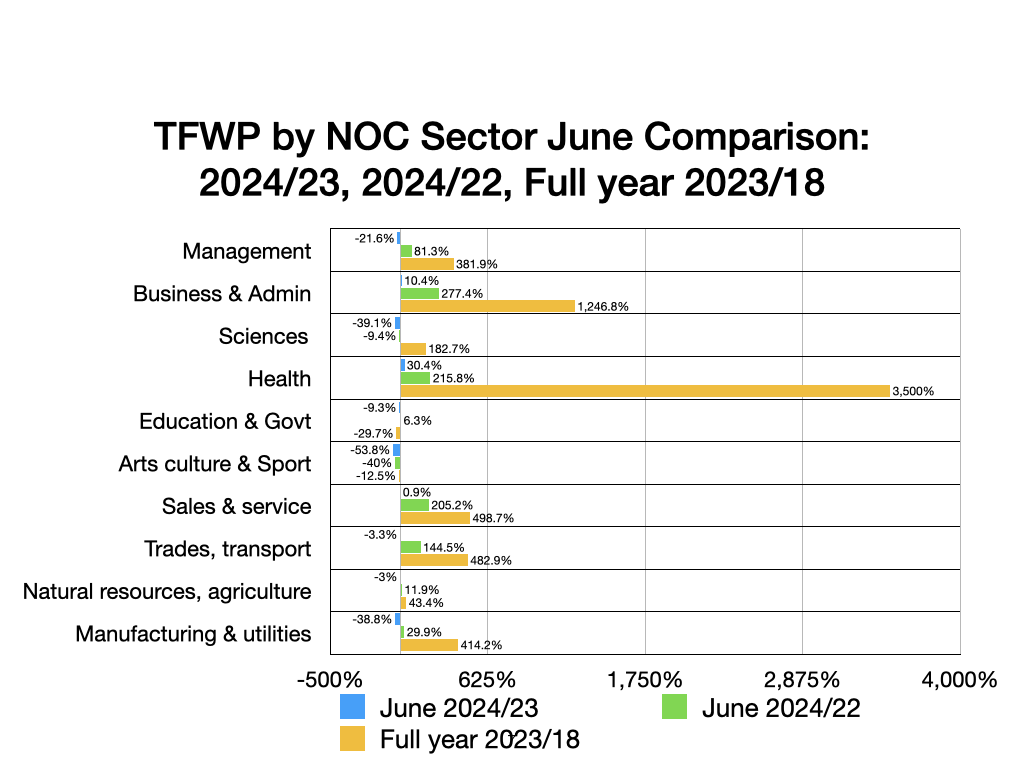
And lastly, looking at June year-over-year change and two year change, as well as from pre-pandemic 2018, showing again the greatest increase in level D occupations and, in terms of sectors, Business & Administration and Health, the latter from a low base:

Note to media: avoid year-to-date analysis in drawing conclusions as happened with Postmedia and other publications and focus on quarterly year-over-year changes.

Anti-hate initiatives have not been able to stop the surge in crimes

My latest:

Police-reported hate crimes keep rising in Canada, no matter which party is governing, and no matter what initiatives have been used to combat the problem. Hate crimes rose 39 per cent between 2008-15, when the Conservatives were in government. But they soared by 239 per cent between 2016-23 with the Liberals in power.  

The true numbers are higher yet, no doubt. Black and Muslim Canadians can be more reluctant than other groups to report hate crimes. We know there is under-reporting. But the rise also reflects a lessening reluctance among others to report such incidents. The latest numbers are some of the most reliable data available. 

The rise comes in an era of high-profile hate crimes including the 2017 Quebec City mosque killings, a spike in incidents against synagogues and Jewish institutionsanti-Asian sentiment during the COVID-19 pandemic and the police killing of George Floyd in May 2020 in Minneapolis.  

The sharp rise has also come despite increased funding for multiculturalism and anti-racism programs under the federal Liberals. The apparent lack of impact of the initiatives does not bode well for their continuation in the years to come.   

Anti-Asian sentiment and the pandemic  

East or Southeast Asians report the greatest increase, as table 1 shows. What is striking is the rise in incidents relative to their share of the population, likely a reflection of the impact and discourse around the pandemic, which sparked anti-Asian sentiment.  

https://e.infogram.com/9eb8007d-6f46-439a-acef-9606167a2a1c?parent_url=https%3A%2F%2Fpolicyoptions.irpp.org%2Fmagazines%2Faugust-2024%2Fhate-crime-policies%2F&src=embed#async_embed

The increase in incidents reported by Black Canadians might reflect a greater willingness to report such crimes after the 2020 Black Lives Matter protests. An increase in reporting among Indigenous Peoples could reflect the aftermath of the 2012 Idle No More protests. These increases might also reflect a backlash against some of these activist movements. And the corrosive language used by Donald Trump has also increased prejudiceamong his supporters and contributed to increasingly divisive politics in the U.S. with some spillover effects in Canadian discourse.  

The number of reported incidents increased sharply in 2023 for both Jews and Muslims, reflecting the Israel-Hamas conflict and the related protests in Canada (table 2). The large number of antisemitic incidents and anti-Israel demonstrations is reflected in the higher rate per 100,000 among Jews, although the overall increase has been greater for Muslims. 

https://e.infogram.com/32874b76-8a91-4d84-bbd7-d2d6cf17b662?parent_url=https%3A%2F%2Fpolicyoptions.irpp.org%2Fmagazines%2Faugust-2024%2Fhate-crime-policies%2F&src=embed#async_embed

Anti-racism initiatives 

In the years between 2008-15, the Conservative government hollowed out the federal multiculturalism program after transferring it to then-Citizenship and Immigration Canada.  

Over the ensuing years (2016-23), the Liberals reversed the move, returning the program to Canadian Heritage. They also doubled funding to $36 million, brought in Canada’s Anti-Racism Strategy 2019-22 and created a Federal Anti-Racism Secretariat.  

Through all this, reported hate crimes have surged. 

Limited outcomes were revealed in the evaluation of the Multiculturalism and Anti-Racism Program and Canada’s Anti-Racism Strategy, 2017-18 to 2021-22. Weak reporting of results and a lack of performance data were also highlighted.  

The extent to which Canadian Heritage has implemented these recommendations is unclear. Canada’s Anti-Racism Strategy 2024-2028 includes recommendations to improve performance reporting in response to these weaknesses. 

Effective outcome and results reporting is particularly challenging for programs like multiculturalism and anti-racism.  

Societal and group relations are complex. Combatting hate crimes involves the reinforcement of social norms against hate and discrimination. Political, business and civil-society leaders play more of a role than government programs. 

The highlighted weaknesses of the federal programs will make it easy for the Conservatives to reverse or severely cut funding if the party is elected next year, a likely outcome. 

Significant or effective pushback is unlikely apart from advocacy organizations that receive government funding. 

Methodological note: Data was taken from the annual police-reported hate crimes reports by Statistics Canada. For the per-capita rates, the year prior to the census was used, e.g., 2010 for the 2011 National Household Survey, and 2020 for the 2021 census (religious affiliation is only counted in the census every 10 years). 

Source: Anti-hate initiatives have not been able to stop the surge in crimes

Canadian Immigration Tracker- May 2024 update

Highlights

Permanent Residents increased but percentage of TR2PR slipped to 53 percent of all Permanent Residents. 

Asylum claimants stable at about 16,000 per month.

Study permit applications increased (seasonal). Study permit web interests have declined by over 25 percent the past year, January to June).

IMP numbers have increased while TFWP numbers have decreased save for those with LMIA.

Citizenship numbers increased. 

Slide 3 has the overall numbers and change.

https://www.slideshare.net/slideshow/canadian-immigration-tracker-key-slides-may-2024-pdf/270213627

Bill C-71 opens up a possible never-ending chain of citizenship

My latest:

Bill C-71 sets out to allow Canadians to pass on their citizenship to any of their children born abroad past the first generation and expands “Lost Canadians” to cover a much larger number than before.

It is fraught with potential unintended consequences.

The bill is in response to a ruling by the Ontario Superior Court of Justice in 2023, which declared previous limitations for citizenship transmission unconstitutional. Essentially, the court objected to a limitation inherent in previous citizenship laws that prevented Canadian citizens born outside Canada from passing on citizenship to a child also born abroad, or for an adopted child born outside Canada.

To remedy the issue, Bill C-71 uses residency as the “substantial connection test.”

However, the new standard in Bill C-71, which requires a foreign-born Canadian parent to have spent a total of 1,095 days in Canada prior to the birth or adoption, differs significantly from what is required of new Canadians.

Specifically, while in both cases the parent must have spent 1,095 days (the equivalent of three years) in Canada, new Canadians must have done so within a five-year time limit.

Bill C-71 places no such time limit to accumulate 1,095 days of residency in Canada for foreign-born Canadian citizens in the same circumstance.

This lack of a timeframe for meeting the critical requirement for passing on citizenship to descendants suggests the government has failed to fully consider the implications of such an open-ended condition.

The number of people potentially affected is significant.

There are an estimated four million Canadians living outside Canada. About half of them were born abroad.

As of 2017, two-thirds of them lived in the U.S., with another 15 per cent in the U.K., Australia, France and Italy – the total living in all other countries has unsurprisingly risen from 14 per cent in 1990 to 20 per cent in 2017.

This trend is significant in the context of Bill C-71: for second- and subsequent-generation expatriates in the U.S., EU and other politically stable places, seeking Canadian citizenship may not be a priority. It is likely a higher priority for those in other countries with less secure conditions.

Fueling the issue triggered by Bill C-71, expatriates as a whole are older than Canadians living in Canada – 45.3 years old compared to 41.7. Citizens by descent are much younger, at an average age of 31.7.

Without an established timeframe, it will be challenging or impossible for the federal government to accurately predict citizenship acquisition year over year.

Same rights, divergent pathways

Consider these scenarios:

My grandson was born in Europe. He cannot pass down Canadian citizenship to any future child. Under C-71, he would have that right, but only after first spending 1,095 cumulative days in Canada. One strategy would be to attend a Canadian university and accumulate most or all of the 1,095 days while getting a degree.

Consider a Canadian born abroad who maintains a cottage in Canada and spends summers there. Spending eight weeks a year in Canada, it would take nearly 20 years to acquire the right to give their descendants Canadian citizenship.

For second-generation Canadians who spend most of their life abroad, the road is even longer. Perhaps they make occasional trips to Canada, accumulating days to meet the 1,095-day requirement. But they would not likely meet the threshold unless they choose to return permanently in retirement.

Many descendants who are temporary residents either through a job transfer or as spouses of skilled workers or students would likely meet the physical-presence requirement. Temporary foreign workers on seasonal or short-terms contracts, on the other hand, would likely not meet the requirement.

The first two scenarios are manageable given that the physical-presence requirement for most would be met within a defined time period. In the latter situations, it is impossible to forecast if or when descendant citizenship rights would eventually be required.

Immigration Refugees and Citizenship Canada (IRCC) needs to determine and share estimates for the approximate number of new citizens expected under the change, along with the incremental workload and resources that are required before the bill goes before committee.

Media in India are characterizing Bill C-71 as legislation that “will open up the chain of citizenship without end as long as the parents have spent at least 1,095 cumulative days.”

Arguably, this change moves Canada closer to a hybrid jus sanguinis/jus soli regime, as it will make it possible for families to maintain intergenerational Canadian citizenship through different scenarios, which currently is not possible.

It may also provide opportunities for longer-term sophisticated foreign-interference efforts by countries like China and India by exploiting descendants who can acquire Canadian citizenship in their recruitment strategies.

Another question that remains unanswered is how many “Lost Canadians” want to be found. As seen in previous efforts to respond to public pressures, the actual number of those who request citizenship proofs is relatively small, at an average of just 1,500 per year between 2009 and 2022. (Similarly, the low number of expatriates who register and vote is another indicator that interest may be limited.)

However, the potential impact of Bil C-71 could be potentially large. So, before the government enshrines a new pathway to citizenship for some, all of the facts need to be properly considered.

Canadian citizenship is a precious gift. At the committee stage, members of Parliament must be able to fulsomely examine the implications of an open-ended residency requirement and consider establishing a specific time frame of five or 10 years.

Source: Bill C-71 opens up a possible never-ending chain of citizenship

COVID-19 Immigration Effects – April 2024 update

Highlights

Permanent Residents increased as did percentage of TR2PR to 62 percent of all Permanent Residents. 

Asylum claimants stable at about 16,000 per month.

Study permit applications flat following last month’s drop due to announced caps. Study permit web interests has also been declining on a year-over-year basis. 

While IMP numbers have declined, TFWP numbers have increased reflecting seasonal agriculture workers and those under LMIAs.

Slide 3 has the overall numbers and change.

https://www.slideshare.net/slideshow/canadian-immigration-tracker-key-slides-april-2024pdf/269927425