The Political Impact of Increased Diversity: What the Census Shows

The 2021 census highlights the growth in immigrants, visible and religious minorities. The political impact will continue to play out at the riding level, further reinforcing political party efforts to attract voters from these groups. This article provides a detailed analysis of diversity at the riding level, with the percentage of visible minorities and key demographic and socio-economic characteristics of these ridings.

Figure 1 contrasts immigrants, non-founding ethnic ancestry or origin, visible and religious minorities by their percentage in ridings, highlighting the large number of ridings with significant population shares of each group.

Figure 2 highlights the growth of ridings where visible minorities form a significant share of the population. The number of ridings in which visible minorities form a majority of the population has increased from one in ten (33) in 2011 to close to one in six (51), reflecting high and increasing levels of immigration. Moreover, the number of ridings with significant numbers of visible minorities (20 to 50 percent) has also increased significantly, reflecting ongoing immigration to smaller urban and suburban centres.

While the number of ridings with between five and 20 percent visible minorities has stayed relatively constant, the percentage of visible minorities has increased by five percent or more in about half of these ridings.

In contrast, there are only four ridings in which religious minorities form the majority, an increase of two compared to 2011, with 54 ridings in which religious minorities are between 20 and 50 percent, an increase of 12 compared to 2011.

Figure 3 shows ridings with a majority of visible minorities by province, with Ontario, British Columbia and Alberta having the greatest share and increase compared to the 2016 census. These are all ridings where one can expect all parties to run visible minority candidates, most likely from the largest visible minority group in the riding.

However, virtually all provinces have an increased number of ridings with between 20 and 50 percent visible minorities, and thus ridings where visible minorities are a significant constituency.

Figure 4 provides the breakdown by visible minority group, with only South Asians and Chinese being a majority of the population (five ridings out of 51 – Brampton East and West, Surrey-Newton for South Asians, Markham-Unionville and Richmond Centre for Chinese), highlighting that most visible minority majority ridings have a mix of visible minority groups. All visible minority groups are present in ridings with between 5 and 20 percent, save Japanese.

Demographic and socioeconomic characteristics vary by percentage of visible minorities as shown in Figure 5.

Visible minority majority ridings are characterized by larger populations, moderate growth, high densities, a younger population, a higher percentage of religious minorities and a low percentage of Indigenous peoples, with the reverse generally being the case for ridings with less than 20 percent visible minorities, highlighting the differences between rural and urban Canada. The highest growth occurs in ridings with 20 to 50 percent visible minorities, ridings that are increasingly diverse. The percentage of religious minorities correlates with the percentage of visible minorities. There is no overall pattern with respect to official language (OL) minorities.

As one would expect, the higher the percentage of visible minorities, the higher the percentage of immigrants and conversely, the lower the percentage of citizens given residency and other requirements as shown in Figure 6. The period of immigration highlights the contrast between earlier waves of immigration, largely European in origin and in low visible minority ridings, and later waves, largely visible minority, with an impact across all ridings, particularly in the last five years and in ridings with lower overall percentage of visible minorities.

Figure 7 highlights educational attainment (trades and university degree, the percentage of married or common-law couples, household size, and whether residents form part of  multigenerational households, are in single-detached housing and the percentage of renters. Trades are more prevalent in ridings with fewer visible minorities and university diplomas more prevalent in ridings with more visible minorities. Women have higher rates of university degrees across all ridings.

Variations on marriage or common law between ridings are small. Household size directly relates to the percentage of visible minorities whereas the prevalence of single detached homes is inversely proportional. Renting is more prevalent in ridings with between 20 and 70 percent visible minorities.

Figure 8 highlights median total after tax income, the percentage of government transfers and income along with participation and unemployment rates. In general, ridings with between 20 and 50 percent have the strongest economic outcomes save for unemployment rates which are lowest in ridings with fewer visible minorities. Outcomes for women are worse overall except with respect to unemployment in ridings with less than 20 percent visible minorities.

Turning to the political aspect and voter targeting, Figure 9 highlights the number of ridings where a visible minority group forms more than 10 percent of the population, broken down by province, again demonstrating the extent to which political parties need to address specific group concerns. Only Latin American, Korean and Japanese have no ridings with ten percent or more of the population; however, with a threshold of five percent, only Japanese have no ridings of significant concentration. Regionally, there are no ridings in Atlantic Canada and the North with one visible minority group forming 10 percent of the population but six ridings where one group forms more than five percent: three South Asian, two Black and one Chinese.

Figure 10 highlights the 190 ridings where a religious minority forms more than five percent of the population as a threshold of ten percent would exclude Buddhist and Indigenous spirituality. Most groups are concentrated in a number of ridings, with Muslims dispersed across the greatest number of ridings.

Figure 11 breaks down the 2021 election results, highlighting the relative strength of the Liberals and NDP in visible minority majority urban ridings and the relative strength of the Conservatives in ridings with between five and twenty percent visible minorities. Compared to the 2015 election, the biggest change was the increase in the relative share of NDP MPs in visible minority majority ridings and the Conservative and Bloc relative share increase in ridings with between 20 to 50 percent visible minorities. These ridings can flip; in 2011, the Conservatives won a majority of ridings with more than 50 percent visible minorities.

Concluding observations

All parties have candidate selection, policy and other electoral strategies to engage these communities and the ongoing increase in the number of visible minority candidates and MPs reflects these strategies. Substantively, there are no major differences in attitudes between immigrants and non-immigrants across a range of immigration-related issues.

While some visible minority groups have a tendency to vote for a particular political party, there is political diversity in all groups resulting in no party ignoring any group. Earlier waves of immigrants, mainly European origin, tend to lean Conservative compared to more recent waves, mainly visible minority, tend to lean Liberal.

Visible minority and immigrant groups are affected by perceived singling out or dog whistles, as the Conservatives learned to their cost in 2015, with the “barbaric cultural practices” tip line and the strength of the Liberal language “a Canadian is a Canadian is a Canadian” in response to the Conservative government’s citizenship revocation provision of C-24. Immigration-specific issues such as the ease of family reunification also play a role.

But in general, visible minority voters are more affected by overall campaign themes and issues, whether these be with respect to campaign tone, general concerns regarding the economy, housing, and healthcare, and largely follow the overall electoral trend at national and regional levels.

Riding characteristics impact upon voting patterns. Visible minority majority ridings have lower incomes and higher unemployment which generally play to left and left-of-centre parties. Similarly, larger family size and more multigenerational households in these ridings suggest that political parties target their messaging accordingly.

No major party is arguing against increased immigration, nor is any province except for Quebec. Public support is strong. Apart from administrative issues like backlogs and poor Immigration, Refugees and Citizenship Canada service, debates and discussion focus more on the practicalities and impact of immigration on housing affordability, healthcare stresses and infrastructure gaps. More recent commentaries are focussing on these negative impacts but in a non-xenophobic manner. After all, these issues affect immigrants and non-immigrants alike, helping to reduce polarization.

Methodology:

All data is from the Census profile given that it provides riding-level data. Indicators were chosen based on their pertinence. Non-founding ethnic ancestry includes all groups save for English, Scottish, Irish, Welsh, Canadian, French and Indigenous (Census allows for multiple responses). Electoral results data is from Elections Canada.

Andrew Griffith is the author of “Because it’s 2015…” Implementing Diversity and InclusionMulticulturalism in Canada: Evidence and Anecdote and Policy Arrogance or Innocent Bias: Resetting Citizenship and Multiculturalism and is a regular media commentator and blogger (Multiculturalism Meanderings). He is the former Director General for Citizenship and Multiculturalism and has worked for a variety of government departments in Canada and abroad and is a fellow of the Canadian Global Affairs Institute and Environics Institute. 

Source: The Political Impact of Increased Diversity: What the Census Shows

Wiseman: Redistributing seats in the House of Commons

Punchy commentary:

When governments redistribute seats in the House of Commons, they often claim they are doing what the public wants or acting in the interests of fairness. When Mike Harris’ Conservative government reduced the number of MPPs at Queen’s Park in 1996, they labelled their bill the Fewer Politicians Act. When Stephen Harper’s Conservatives increased seats in the Commons in 2011, they branded their bill the Fair Representation Act. To be consistent, Jim Flaherty, John Baird, and Tony Clement, senior cabinet ministers in both governments, ought to have termed their federal bill the More Politicians Act.

As required by law and shifts in the population, Elections Canada has determined that the House ought to expand by four seats, from 338 to 342, adding three seats for Alberta, one each for Ontario and British Columbia, and reducing Quebec’s seats by one, from 78 to 77.

By entering your email address you consent to receive email from The Hill Times containing news, analysis, updates and offers. You may unsubscribe at any time. See our privacy policy

Rather than constantly enlarging the House as two acts of Parliament require—the 1985 grandfather clause and the 2011 representation rule—Parliament ought to keep to the constitutional principle established at Confederation: proportionate provincial representation. The only exception is the “senatorial clause,” added to the Constitution by Westminster in 1915, entitling provinces to no fewer MPs than Senators. Changing that rule requires the unanimous consent of the provinces and Parliament, an impossibility.

Parliament ought to repeal both the “grandfather clause” and the “representation rule.” Neither required the consent of provinces and neither requires provincial consent for revocation. Parliament should also consider reducing and fixing a permanent number of seats. If the United States can manage with 435 Congressional representatives for 334 million people, 250 MPs ought to be sufficient to represent Canada’s 38 million people. MPs fearful of losing their jobs will argue that they are essential to serving their constituents, but more constituency staff could easily do that.

MPs are elected to represent their constituents and the parties under whose banners they run. They are not elected to represent provinces. Senators are appointed to represent provincial interests. Premiers do it especially well. But premiers have no more business in the redistribution of Commons seats than the prime minister has in how seats are distributed in a province. The idea that MPs represent their province holds no water. If it did, MPs would vote along provincial lines. The reality is they vote strictly along party lines. What constituents or provincial legislatures prefer is secondary to the preferences of party whips.

The Bloc Québécois makes much of the fact that Parliament has recognized Quebec as a nation. Quebec Premier François Legault claims “the nation of Quebec deserves a certain level of representation” regardless of its population. This begs some questions including: Should Quebec’s First Nations be entitled to a certain level of representation in the National Assembly regardless of their population since the assembly has assigned the status of “nation” to eleven provincial aboriginal groups including the Inuit, Mohawk, Cree, Algonquin, and Naskapi? Carrying Quebec’s brief, Yves-François Blanchet, whose BQ rejected the 1992 Charlottetown Accord which guaranteed Quebec 25 per cent of Commons seats in perpetuity, is outraged at the prospect of his province losing a seat. He has promised to unleash the “fires of hell” if it does.

Pure laine (dyed in the wool) or de souche (old-stock) francophones may claim to be a nation, but Quebec is merely a territory. Stephen Harper’s description of the Québécois is appropriate: “a unique people bonded together by a common language, culture and history—a nation.” However, increasing numbers of Quebecers, like provincial Liberal leader Dominique Anglade, do not fit that definition. Mordechai Richler, whose writings are set in the province, was dismissed as “not one of us” and not a “real Quebecer” by the co-chair of Quebec’s Commission on the Political and Constitutional Future of Quebec. Jacques Parizeau infamously articulated the distinction between the Québécois de souche and other Quebecers when he declared that “money and the ethnic vote” had determined the outcome of Quebec’s 1995 referendum.

Bloc Québécois founder Lucien Bouchard claimed, “Canada is not a real country” on account of its multicultural complexion, and Quebec’s governments have rejected Canada’s multiculturalism policy. Quebec is certainly not a country and if it can make the claim to nationhood, why should not Saskatchewan? Yes, the French fact makes Quebec—the only jurisdiction on the continent where a majority are francophones—distinctive in a way that Saskatchewan is not, but the language of nationhood is inappropriate for both.

If Quebec must have more MPs than to which it is entitled, let Parliament adopt another feature of the United States Congress: non-voting members. All provinces, except Newfoundland and Labrador and British Columbia, have lost seats in the past. Quebec is a cry baby in demanding overrepresentation and the federal political parties are too eager to cater to its howls.

Nelson Wiseman is the author of Partisan Odysseys: Canada’s Political Parties(University of Toronto Press).

Source: Redistributing seats in the House of Commons

Ibbitson: Trudeau’s decision over Quebec’s seats puts him at risk either way

Expect government will bend with no opposition from other parties, given precedents of Bills 21 and 96, even if questionable to do so:

When Justin Trudeau returns from his European travels, he will need to decide, and quickly, whether to prevent Quebec from losing a seat in the House of Commons.

Politically, all options are bad for the Prime Minister.

Back in 2011, Stephen Harper’s Conservative government moved to correct the problem of chronic underrepresentation in the House of Commons for the fast-growing provinces of Alberta, British Columbia and Ontario. In the final version of the formula enshrined in the Fair Representation Act, Quebec was also awarded extra seats, to ensure its representation in the House fairly reflected its share of the national population.

As required by law and the Constitution, Elections Canada applied the 2011 formula for its latest calculation of the distribution of seats in Parliament. The results, released two weeks ago, show the House of Commons growing by four seats, from 338 to 342. Alberta, British Columbia and Ontario will receive additional seats. But Quebec will have one seat taken away, reducing its representation from 78 to 77.

Not surprisingly, the Bloc Québécois and the Quebec government are demanding that the province’s representation not diminish, on the grounds that its MPs have a special mandate in the House to speak for and protect Quebec’s culture and language.

The Liberal government has two options. The first is to do nothing and allow Elections Canada to proceed with redistribution by establishing electoral commissions for each province that will redraw riding boundaries based on the latest census data. That process is scheduled to begin in February.

The second option is to introduce a new redistribution formula through legislation. That formula could ensure that Quebec’s seat count does not fall below its current 78 seats, though the province’s relative weight would decline as the House expands in size.

As an alternative, the formula could guarantee that Quebec’s representation never drops below, say, 25 per cent of all seats in the House. That was a provision in the Charlottetown accord of 1992, which was defeated in a referendum.

Any legislation would need to be introduced soon, so that Elections Canada knows whether, when and how to proceed with redistribution. But moving to protect Quebec’s interests will prove contentious.

“There’s risk if he does do it and there’s risk if he doesn’t do it,” Professor Lori Turnbull, director of the School of Public Administration at Dalhousie University, told me. Allowing the existing representation order to stand would anger Quebec voters, who would face a future of steadily weakening influence in Ottawa.

But moving to protect Quebec’s standing in the House would further anger Western voters who believe French Canada’s interests are protected while theirs are ignored.

This is especially true in the wake of the new cabinet announced last week, which weakened Prairie influence and emphasized the fight against climate change over oil-and-gas interests.

When asked how he would address the problem, Benjamin Forest, who researches the political representation of minorities at McGill University, said, “I would take the easy way out and add enough seats” so that Quebec once again has 78 seats in the House.

Many voters complain about sending more and more MPs to Ottawa. But Canada itself is growing, adding a million people every two or three years, mostly through immigration. The House should reflect that growth.

As well, previous federal governments at different times guaranteed smaller provinces a minimum number of seats, resulting in a House of Commons skewed in favour of rural interests. The riding of Cardigan, Prince Edward Island, has a population of just over 36,000; Cypress Hills—Grasslands in Saskatchewan has 68,000. But Vancouver East has 110,000 and the riding of Burlington, in Greater Toronto, has 121,000.

Adding more urban seats would make the House more democratic by diminishing the relative weight of the countryside, and increasing the importance of urban issues, such as transit, over rural, such as dairy supports.

Of course the best solution to Quebec’s declining demographic influence in the House would be for the province to increase its population through immigration. Instead, Premier François Legault has cut back on immigration. So long as that continues, the influence of Quebec must ultimately decline, however much politicians rejig the House of Commons to prevent it.

Source: https://www.theglobeandmail.com/politics/article-trudeaus-decision-over-quebecs-seats-puts-him-at-risk-either-way/

Bloc leader’s threat to unleash ‘fires of hell’ over Quebec seat proposal might just backfire

Hard to have much sympathy for the “outrage” given the demographic decline reflects in part Quebec’s decision to admit fewer immigrants than elsewhere in Canada (despite or because they manage economic immigration) and the xenophobic Bill 21 and the weakening of bilingualism in Bill 96. Commentaries, starting with Konrad Yakabuski highlighting the consequences of lower immigration levels, and Randy Boswell’s more sympathetic take:
Le premier ministre de l’Ontario, Doug Ford, a suscité un tollé cette semaine lorsqu’il a livré un avertissement à tous ceux qui espèrent immigrer dans sa province, laquelle fait face à un manque criant de travailleurs puisque plus de 290 000 postes demeurent vacants. « Si vous pensez que vous pouvez venir ici pour toucher le B.S. et rester assis à la maison, ça n’arrivera pas », a martelé M. Ford lors d’un point de presse, se faisant immédiatement accuser d’exprimer tout haut ce que de nombreux Ontariens pensent tout bas. Si M. Ford a refusé de s’excuser pour ses propos, il s’est néanmoins empressé de se déclarer « pro-immigration » et de se vanter d’accueillir des immigrants de partout dans le monde au « Ford Fest », le barbecue estival que sa famille organise chaque année dans un quartier très multiculturel à Toronto. En effet, le gouvernement conservateur de M. Ford appuie sans réserve la hausse des seuils d’immigration annoncée l’an dernier par Ottawa, qui vise à accueillir 401 000 résidents permanents au pays en 2021, soit une augmentation de 18 % par rapport à 2019. Si le nombre d’immigrants a chuté en 2020 en raison de la pandémie, tombant à 184 000, le gouvernement fédéral presse le pas pour atteindre ses objectifs en matière d’immigration pour les années 2021, 2022 et 2023. En tout, ce sont plus de 1,2 million de nouveaux résidents permanents que le Canada compte accueillir pendant cette période, dépassant ainsi un ancien record qui date du début du XXe siècle. À lui seul, l’Ontario devrait accueillir plus de 540 000 nouveaux arrivants, ce qui pousserait sa population au-delà du seuil des 15 millions d’habitants. La politique d’immigration du Québec Quoi qu’on pense de la politique d’immigration du Québec, son résultat à long terme mènera vers une baisse du poids démographique de la province dans la fédération canadienne. La province compte accueillir entre 51 500 et 54 500 nouveaux immigrants cette année, si on inclut le « rattrapage » de 7000 nouveaux arrivants que le gouvernement caquiste prévoit d’effectuer après la baisse de 2020 liée à la fermeture des frontières. En 2019, durant la première année du gouvernement de François Legault, le Québec a reçu 40 565 nouveaux résidents permanents, ou seulement 11,89 % du total canadien. L’Alberta, qui compte la moitié moins d’habitants que le Québec, en a reçu 43 691, ou 12,81 % du total. L’Ontario a accueilli 153 395 nouveaux arrivants, ou 45 % des 341 000 nouveaux résidents permanents acceptés en 2019. Le Québec ne recevait déjà pas sa part d’immigrants en fonction de sa population au sein de la fédération canadienne avant l’arrivée de M. Legault au pouvoir. En 2016, quand le Québec comptait pour environ 23 % de la population canadienne, il avait reçu 18 % des immigrants arrivés au pays au cours de cette année-là. Il n’est pas impossible que ce taux atteigne les 10 % dans les prochaines années. En effet, les voix s’élèvent dans le reste du pays pour qu’Ottawa augmente ses seuils annuels d’immigration à 450 000 ou à 500 000 nouveaux arrivants. Un groupe d’influents Canadiens, réunis sous la bannière de l’Initiative du siècle, préconise une politique d’immigration visant à hausser la population canadienne à 100 millions de personnes en l’an 2100 afin de s’assurer de la prospérité nécessaire au maintien des programmes sociaux et d’augmenter l’influence du Canada sur la scène internationale. Le groupe, présidé par l’ancien chef de la direction du fonds d’investissement du Régime de pensions du Canada, Mark Wiseman, compte parmi ses membres le p.-d.g. du Conseil canadien des affaires, Goldy Hyder, et Dominique Barton, l’actuel ambassadeur du Canada en Chine. Il jouit aussi de l’appui de l’ancien premier ministre Brian Mulroney. Or, dans son discours inaugural prononcé cette semaine à l’Assemblée nationale, M. Legault a réaffirmé son refus aux « voix qui réclament un nombre toujours plus élevé d’immigrants ». Le Québec reçoit déjà plus d’immigrants que la plupart des pays développés, a-t-il dit, et il n’est pas question qu’il emboîte le pas au reste du pays. « Le Québec ne peut pas avoir le même modèle d’immigration que celui du Canada anglais. La survie du français exige une approche différente. » Ce choix n’est pas sans conséquences. Le directeur des élections du Canada, Stéphane Perreault, a annoncé la semaine dernière que le Québec doit perdre un siège à la Chambre des communes dès 2024, ce qui porterait le nombre de ses sièges à 77, selon une nouvelle répartition des sièges basée sur la formule de représentation prévue dans la Constitution. Les réactions à cette annonce n’ont pas tardé, le chef du Bloc québécois, Yves-François Blanchet, et la ministre caquiste des Relations canadiennes, Sonia LeBel, s’étant tous deux insurgés contre toute tentative de diminuer le poids du Québec au Parlement fédéral. Vendredi, M. Legault a lui-même sommé M. Trudeau de « préserver le poids de la nation québécoise à la Chambre des communes ». Toutefois, sans modification constitutionnelle, il semble inévitable que le Québec voie sa proportion de sièges à la Chambre des communes diminuer de façon importante au cours des prochaines décennies. Cette proportion est déjà tombée de 36 % des sièges en 1867 à 23 % en 2011. Selon la proposition de M. Perrault, elle glisserait encore à 22,5 %. Qu’en sera-t-il dans dix ans, alors que le reste du Canada s’apprête à accueillir de plus en plus d’immigrants pendant que le Québec referme davantage ses portes ?
Source: https://www.ledevoir.com/opinion/chroniques/642273/chronique-la-marginalisation?utm_source=infolettre-2021-10-23&utm_medium=email&utm_campaign=infolettre-quotidienne
A proposed rejigging of Canada’s electoral map could see Quebec lose one of its seats in the House of Commons by 2024 while Alberta gains three and Ontario and B.C. each gain one.
The changes would increase the total number of federal ridings to 342 from 338. There are reasonable arguments for and against implementing the exact changes recommended by Elections Canada. But Bloc Québécois leader Yves-François Blanchet’s opening salvo in the debate — that the BQ would “unleash the fires of hell” if his province’s seat count is dropped to 77 from 78 — is the wrong way to begin what needs to be a calm, cool conversation about updating the country’s political geography. How are we supposed to respond to Blanchet’s Trumpian explosion of outrage? Can thoughtful discussion follow a toddler’s tantrum?
Injecting apocalyptic rhetoric into a decision-making process that must be driven by the fundamental democratic principle of representation by population — and basic math — is precisely how to inflame prejudices, fuel interprovincial pettiness and polarize the nation. Blanchet, of course, knows this. Driving wedges wherever possible between Quebec and the rest of Canada is crucial, by definition, to the political project of any diehard separatist.
So we shouldn’t be too surprised that Blanchet has zeroed in histrionically on the planned removal of a single Quebec seat from the Commons as if it were a sign of the End Times. Although Elections Canada proposed the change for the benign reason that Quebec’s population is not growing at the same pace as the populations in Alberta, Ontario or B.C. — and because Quebec is (relative to those other big provinces) already more fairly represented in the current parliamentary seat count — Blanchet is invoking biblical imagery of the final battle between Good and Evil.
Sonia LeBel, Quebec’s minister responsible for relations with the rest of Canada, has employed more moderate language — and advanced a more compelling rationale — in urging special considerations for the province in the latest redistribution of federal ridings. “We are part of the founding peoples of Canada,” she said this week. “We have three seats guaranteed at the Supreme Court for judges. We have seats guaranteed in the Senate, a weight that is important and represents much more than just a simple calculation of population.” All of this is why Prime Minister Justin Trudeau and other political leaders interested in preserving the peace in our mostly peaceable kingdom need to rise above Blanchet’s blatant bullying while finding a sensible solution to the seat-count conundrum — one that delicately balances numerical fairness with other considerations endemic in a land of complexity and compromise. Remember: there’s no purely mathematical justification for granting a federal seat to each of Canada’s three territories — none of which has a population above 50,000 — when the average number of Canadians represented by each MP is more than 110,000. There’s no logical reason, either, for Prince Edward Island — with a mere 0.43 per cent of the national population of about 38 million — to have four seats representing 1.19 per cent of the elected positions in Parliament.
So there may well be legitimate reasons to avoid reducing Quebec’s seat count at this time. In 2011, the Conservative government of Stephen Harper implemented legislation that increased the number of seats to 338 from 308 to reflect population changes. At the time, the Harper government — with much prodding from Quebec, the BQ and other opposition parties — chose to inflate the overall size of the House of the Commons so that the number of Quebec seats would increase (by three, to 78) instead of remaining static at 75 — as an earlier, hotly rejected, purely mathematical proposal had called for. The government’s thinking at the time was that tweaking the formula for allocating seats in a way that would better recognize Quebec’s special status as a nation within the nation was politically prudent.
It also happened to keep the province’s seat total roughly proportional to its percentage of Canada’s population, even as those two numbers remained unfairly out of whack for faster-growing provinces.
The Quebec-friendly adjustment wasn’t immediately embraced by Harper’s own caucus. The additional Quebec seats, according to a Globe and Mail report at the time, “caused consternation among Conservative backbenchers, who were concerned that Canada’s French-speaking province was benefiting from a bill meant to address under-representation in the three large and fast-growing anglophone provinces” — Alberta, Ontario and B.C. Sound familiar? The Conservative caucus was ultimately convinced by Harper to accept the plan for the sake of national unity. But despite the Quebec-friendly compromise, the pre-Blanchet Bloc Québécois still slammed the 2011 reconfiguration of the House as falling short of true recognition of the province’s “unique status with regard to its political weight.” You can’t please everyone. As then-B.C. premier Christy Clark, who supported the 2011 changes, said at the time: “Perfection in these things is impossible because it’s a big and complicated country.” A decade later, the scenario confronting Elections Canada, the federal government and the provinces is much the same. And maybe a little massaging of the numbers to mollify Quebec is warranted yet again. Would it be so bad if Quebec kept its 78 seats and we had 343 federal ridings instead of 342? That would represent about 22.7 per cent of the seats in the House for a province with about 22.6 per cent of Canada’s population. (Meanwhile, Ontario’s proposed 122 seats would then account for 35.6 per cent of 343 seats for a province with almost 39 per cent of the country’s population.)
But Blanchet’s bluster about unleashing the “fires of hell” risks torching the good will required for the rest of Canada to grant Quebec some latitude in its allotment of seats in the national legislature. It’s the kind of talk that’s more likely to unleash cynicism and stinginess. And eventually, if population trends continue in the current direction, maintaining Quebec’s present share of federal seats as its population drifts towards one-fifth of Canada’s total will become untenable from a democratic point of view — Blanchet’s fires of hell notwithstanding. Randy Boswell is a Carleton University journalism professor and former Postmedia News national writer.
Source: Bloc leader’s threat to unleash ‘fires of hell’ over Quebec seat proposal might just backfire

We’re about to find out how many new seats there will be in Parliament. Then the fighting starts

Yes, indeed. Looking forward to the overview and eventually the new riding list:

The federal election may be over but a new fight over ridings is about to start.

On Friday, the Star has learned, Elections Canada will announce the number of new seats each province will be allocated in the House of Commons. It’s not quite the gerrymandering that occurs in the United States — where politicians draw zigzags to create safe districts — but every 10 years in Canada new constituencies are added and riding boundaries are reviewed. And here too, MPs have lots to say about where they want those lines to be.

“Every party is going to look at this and say, ‘OK, what polls did we win? Where did we lose? How can we create a combination that will give us the best outcome at election time?,’” one MP told the Star. “Everybody does it.”

It may be less overt — and less successful — in Canada but political parties will try to sway the decisions of the independent three-person commissions that decide where the boundaries go.

Those panels, one for each province, will be struck in the next two weeks. The chair is named by the province’s chief justice and the two other members by the Speaker of the House of Commons, Liberal MP Anthony Rota. Over the next year, they’ll draw up a proposal for where they think the lines should be, based on population data from this year’s census. The public will then have a say before a final report is issued. That’s where things can get interesting.

In 2012, for example, when the Saskatchewan commission suggested getting rid of eight pizza-shaped ridings that split Regina and Saskatoon up into four pieces with a tiny bit of urban area and a large rural part, there was massive opposition.

The commission suggested creating two urban districts in Regina and three in Saskatoon to reflect the cities’ rapid growth. They expected 40 people to show up at the hearings: 230 registered. Four extra days were added to the schedule.

MPs came, as did defeated candidates, small town representatives and the public. The vast majority opposed the changes. But once commissioners started receiving identical postcards and petitions and 3,000 written submissions, they understood politicians had mobilized their supporters.

Source: We’re about to find out how many new seats there will be in Parliament. Then the fighting starts

Ridings to watch: My picks

With the election about two weeks away, virtually every media outlet has  articles and analyses of ridings to watch. with largely the same lists, based upon a mix of electoral margins and prominent candidates (i.e., Jody Wilson-Raybault).

I took a somewhat different tack, taking a look at ridings where visible minorities form 20 percent or more of the population and where the electoral margin was less than 5 percent.

This provides a different perspective than simply looking at ridings that are visible minority majority (only four of these 25 ridings). Most are in Ontario, followed by British Columbia and Alberta, with only one riding in Manitoba and Quebec.

All are urban as one would expect and there is some overlap with the various lists of the media.


The full list can be found here, along with the relevant demographics and 2015 margins.

Ridings with 20 percent vismin and margins 5 percent 2015

For my series looking at those ridings with significant numbers of visible minority, European ancestry (non British or French), religious minority and Indigenous peoples, check out these data tables:

Top ridings by group

Canadians in every riding support climate action, new research shows

Different take than national and provincial polling but interesting approach to riding-level analysis. Others better placed to comment on the methodology:

Canada is gearing up for a big election this fall and climate policy will likely be at the centre of debate. Prime Minister Justin Trudeau’s Liberals are trumpeting their carbon pricing policy, while Andrew Scheer’s Conservatives want to get rid of it. Meanwhile, Elizabeth May and her newly relevant Greens think Canada must do more to manage the climate crisis.

But where do Canadian voters stand on this issue?

Our research team, based at the Université de Montréal and the University of California Santa Barbara, has new public opinion data to answer this question. Using recent statistical and political science advances, we can estimate Canadian opinion in every single riding across the country (except for the less densely populated territories, where data collection is sparse). And we’ve released on online tool so anyone can see how their local riding compares to others across the country.

Canadians are concerned about climate change

Our results reinforce what is increasingly clear: climate change is on the minds of Canadians, and not just in urban or coastal communities. A majority of Canadians in every single riding believe the climate is changing. The highest beliefs are in Halifax, where 93 per cent of the public believe climate change is happening.

Percentage of Canadians, by riding, who believe climate change is happening. Author provided

And a majority of Canadians in all but three ridings think their province has already experienced the impacts of climate change. These beliefs are particularly high in Québec, where 79 per cent feel the impacts of climate change have already arrived.

Canadians also want to see the government take the climate threat seriously.

A majority of voters supports emissions trading. Carbon taxation is more divisive, yet more people support carbon taxation than don’t in 88 per cent of Canadian ridings.

And the handful of ridings that don’t support the Trudeau government’s carbon pricing policy — Fort McMurray-Cold Lake, for example — are already in Conservative hands.


In other words, the path to a majority government — or even a minority government — goes through many ridings where Canadians are worried about climate change and want the government to take aggressive action.

Compared to the United States, the Canadian public believes climate change is happening in far higher shares. Even Canadian ridings where belief in climate change is the lowest have comparable beliefs to liberal states like Vermont and Washington. Overall Canadian support for a carbon tax is higher than support for a carbon tax in California, often thought of as the most environmentally progressive U.S. state.

Percentage of Canadians, by riding, who believe their province has already been impacted by climate change. Author provided

Importantly, support for specific climate policies remains high in provinces that have already implemented climate laws. For instance, support for a carbon tax in British Columbia, where this policy was introduced in 2008, is the second highest in the country at 61 per cent (Prince Edward Island has the highest support). Similarly, support for emissions trading is second highest in Québec, again just behind P.E.I., where a carbon market was implemented in 2013.

Even Conservative ridings want action

We don’t find evidence of a backlash to carbon taxes or emissions trading — Canadians living in provinces with substantive climate policies continue to support them. Instead, we find substantial support for climate action in the ridings of Canadian politicians who have done the most to undermine Canada’s climate policy.

Ontario Premier Doug Ford’s provincial riding matches up with the federal riding of Etobicoke North, where 62 per cent of the public supports emissions trading. In other words, Ford ignored the majority will of his own constituents when he acted to repeal Ontario’s policy last year.

Riding-level public opinion estimates for the Saskatchewan riding of Regina-Qu’Apelle, currently represented by Conservative Leader Andrew Scheer. Author provided

The same is true federally. In Scheer’s own riding of Regina-Qu’Appelle, support for carbon taxation is at 52 per cent. Only 41 per cent of Scheer’s own constituents oppose a carbon tax. He too is offside with the people he represents.

The political risks of opposing climate reforms

Our results emphasize how the media can sometimes misinterpret electoral mandates. In Ontario, Doug Ford promised to repeal the province’s emissions trading scheme — and won. But the former Conservative leader, Patrick Brown, supported carbon pricing while enjoying a comfortable lead in the polls.

There are lots of reasons why Canadians choose to change their government, but opposition to carbon pricing hasn’t been one of them.

Climate science is clear on the need to rapidly decrease greenhouse gas emissions to avert the most disastrous consequences of climate change. As a northern country, climate impacts in Canada are already larger than in other places.


Our research, which the public can explore, shows that Canadians everywhere — from the most Conservative to the most Liberal ridings — are united in understanding that climate change poses a major threat to the people and places they cherish. The coming election will provide an opportunity for Canadians have a say in the future of climate policy in their country — and all Canadian politicians should take note.

Source: Canadians in every riding support climate action, new research shows

York Centre, Eglinton-Lawrence could be most affected by not moving election date

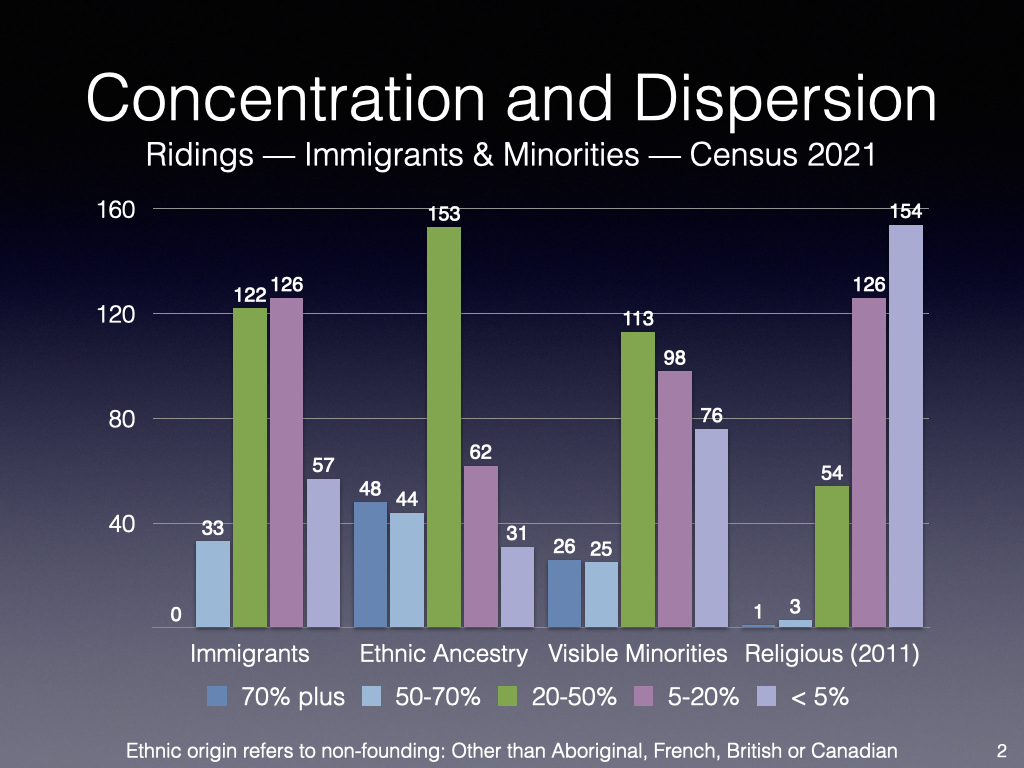
More details and assessments of the election date and its likely impact on orthodox Jewish voters. Based on the 2011 National Household Survey, Canadian Jews form 5 percent or more of the population in 14 ridings (RM Ridings Jewish 5 percent):

Experts say they will be watching a few key ridings in and around Toronto as they try to gauge how Canada’s Chief Electoral Officer Stephane Pérrault’s decision not to recommend moving the Oct. 21 election date to accommodate Orthodox and other observant Jewish voters will affect the election outcome.

“The chief electoral officer is an independent official. None of the parties are accountable for the decisions made by his office, so I don’t imagine that there will be much, if any, political fallout,” said Frank Graves, president of Ekos Research, in an email statement to The Hill Times. “The impact for the Liberals and other parties might be if the Jewish vote turnout is dampened by this decision. I am not certain that will be the case, but I don’t think that would be an important factor in the next election, although it might be a modest factor in a few ridings.”

Mr. Graves said in past elections, Jewish Canadians primarily voted Liberal, but “that has not been the case for some time. The Conservatives did quite well with the Jewish vote under Harper, and I am guessing they will continue to do so.”

Mr. Graves added that the Liberals also do “fairly well” and that he is unclear how “a relatively small vote, which does not lean dramatically one way or the other, which may or may not have reduced turnout, will have much impact in October.”

According to data collected over the past six months by Campaign Research, Jewish Canadians favour Liberals over Conservatives, 42 per cent to 36 per cent. This data is not broken down by riding, or whether those polled strictly observe every holiday. A 2018 study titled “2018 Survey of Jews in Canada by the Environics Institute, the University of Toronto, and York University reported Jewish Canadians preferring the Liberals over the Conservatives by 36 per cent to 32 per cent. This data is also not broken down by riding or religiosity.

Eli Yufest, CEO of Campaign Research, and Quito Maggi, CEO of Mainstreet Research, said that statistically, the more religious an individual is, the more likely they are to vote for a Conservative Party. An article published in the Canadian Political Science Review by Sarah Wilkins-Laflamme, a University of Waterloo sociology professor, found that in 2011 “religious citizens were overall more likely to vote Conservative.”

Finding accurate statistics on the number of Jewish Canadians, and their level of religiosity, in a given riding is difficult because the census only asks about religion every 10 years. The 2011 census asked about religion, and reported 309,650 Jewish Canadians. The 2016 census did not, nor was Jewish included as a checkable box in the ethnic origin section. There was, however, a space where respondents could write in ethnicities that weren’t listed. As a result, the 2016 census reported only 143,665 Jewish Canadians, a 53.6 per cent decline in just five years. Though the percentage of Jewish Canadians has been steadily declining since 1991, the rate of decline is much lower than that, according to Statistics Canada.

On July 26, Statistics Canada released a report that sought remedy the errors of the 2016 census. The report estimated that if past response patterns remained consistent, the number of Jewish Canadians would be between 270,000 and 298,000.

Further complicating the effort to accurately count the number of Jewish-Canadians is the 2018 report by the Environics Institute, the University of Toronto, and York University. It estimated there were 392,000 Jewish-Canadians in 2018.

In the report, the authors said because “Canadian Jews constitute only about one percent of the Canadian population, the use of standard survey research methods was not a feasible option given the high costs of using probability sampling to identify and recruit participants.”

To try and produce as accurate a report as possible within the available budget, they surveyed 2,335 individuals online or over the phone between Feb. 10 and Sept. 30, 2018. It focused on Toronto, Montreal, Vancouver, and Winnipeg, the cities with the largest Jewish populations in Canada. The data were weighted according to population, age, gender, and marital status. The study was not fully based on probability sampling, meaning a margin of error cannot be calculated.

The Environics study breaks down the Jewish population by city, not riding, like the census does. The 2011 census reports the five ridings with the largest percentage of Jewish residents as Thornhill (22.04 per cent), Mont-Royal (22.07 per cent), Eglinton-Lawrence (16.87 per cent), York Centre (14.37 per cent), and Toronto-St Paul’s (12.11 per cent).

The 2016 census has the same ridings in the top five, but with lower numbers in a slightly different order. It reports Thornhill (13.4 per cent), Mont-Royal (8.4 per cent), York Centre (7 per cent), Eglinton-Lawrence (6.6 per cent), and Toronto St. Paul’s (4.5 per cent).

Of those five ridings, four are held by Liberals. Thornhill is the only Conservative riding, held since 2008 by Peter Kent. 338 Canada’s Philippe Fournier categorizes Mont-Royal, held by Liberal MP Anthony Housefather, as the only truly safe seat. In 2015, Mr. Housefather beat Conservative nominee Robert Libman by just under 14 percentage points, or 5,986 votes. Thornhill and Toronto-St. Paul’s, held since 1997 by Minister of Crown-Indigenous Relations Carolyn Bennett, are considered likely to stay in Conservative and Liberal hands, respectively.

Despite 338 Canada’s projection, Mr. Maggi said he is going to be watching Thornhill.

“If the Orthodox community votes in substantially lower numbers, given where we see the overall Liberal numbers in Toronto and the GTA right now, that riding could be competitive,” he said.

The 2011 census reported 34,956 Jewish Canadians in Thornhill, while the 2011 census reported 15,025. Mr. Kent won by just under 15 percentage points in 2015, or 13,516 votes.

Mari Canseco, president of Research Co, and Mr. Maggi both said York Centre will be the riding most affected by the decision given the close 2015 election and the number of voters who could be affected.

Liberal incumbent Michael Levitt, who is Jewish, won by just 1,238 votes in 2015, and 338 Canada has it leaning Conservative heading into October. The 2016 census reported 7,270 Jewish Canadian residents, whereas the 2011 census reported 14,551.

Mr. Canseco said the margin of victory in 2015 already meant York-Centre would be competitive in 2019. He hesitated to say if lower turnout in the observant Jewish community would benefit a single party, though, because “it’s tough to try to look at the decision as something that is going to bring down turnout for a specific party and not others, because we just don’t have the data for it.”

The 2018 Quebec provincial election coincided with the same Jewish holiday, Shemini Atzeret. The election was also not moved, and the heavily-Jewish riding of D’Arcy-McGee saw turnout drop by 26 points, from 72 per cent in the 2015 provincial election to just 46.5 per cent in the 2018 election.

338 Canada lists Eglinton-Lawrence as a toss up. In 2015, Liberal Marco Mendicino won Eglinton-Lawrence by 3,490 votes, or 6.25 percentage points. The 2011 census reported that there were 19,903 Jewish Canadians living in the riding, while the 2016 census reported just 7,490.

Mr. Mendicino is running again, and is being challenged by Conservative candidate Chani Ayreh-Bain. Ms. Aryeh-Bain is Orthodox Jewish herself and was one of the lead plaintiffs in the original case that sought to get Elections Canada to move the election date.

Ms. Aryeh-Bain said she was disappointed by Mr. Perrault’s decision, and that she is dedicating a “fair amount of resources to the Orthodox community.”

She said she will focus on informing voters of the various options available to them. Elections Canada also said in a statement that they would be working with Jewish organizations and members of the Jewish community to inform voters of their options. Ms. Areyh-Bain said that even though there are alternative options, it will still be difficult for members of the observant and Orthodox Jewish community to access them.

“The options aren’t great, because the advanced poll days all fall on either the Sabbath or a holiday, or the eve of Sabbath or the eve of a holiday, so they’re really pressed for time,” she said. “The only other option is to vote at a returning office, or use an absentee ballot. It’s really not ideal.”

Mr. Maggi said he didn’t expect the fact that the government did not move the election date could be used as political ammunition against the Liberals.

“It’s important to remember the Jewish community, just like any other community, has other ballot box questions. I don’t think this issue of the election date is going to be the single ballot question. Those people still care about the same things that most of the general population care about, education, health care, the economy and jobs, the environment. Those are much more likely to be ballot box questions for any group, regardless of their ethnicity.”

Source: York Centre, Eglinton-Lawrence could be most affected by not moving election date

Election 2019: Ridings in which visible minorities, European ethnic ancestries, non-official languages most often spoken at home and religious minorities

As part of my background work for diversityvotes.ca, I have prepared the following comparative tables that highlight groups that form a significant portion of the population in ridings. These capture visible minorities, European ethnic ancestries, language most often spoken at home, Indigenous peoples  and religious minorities. All data is from the 2016 census, save for religious minorities which dates from the 2011 National Household Survey.

In general, a threshold of 10 percent of the population or more has been chosen, with lower or higher percentages where appropriate.

If interested in having this data in Numbers, Excel or Filemaker, please contact me regarding the cost.

Visible minorities

VM Ridings Arab 5 percent (20 ridings)

VM Ridings Black 10 percent (21 ridings)

VM Ridings Chinese 10 percent (37 ridings)

VM Ridings Filipino 10 percent (9 ridings)

There are no ridings where Japanese form more than three percent

VM Ridings Korean 5 Percent (3 ridings)

VM Ridings Latin American 5 percent (7 ridings)

VM Ridings SE Asian 5 percent (4 ridings)

VM Ridings South Asian 10 percent (47 ridings)

VM Ridings West Asian 5 percent (8 ridings)

VM Ridings VisMin 20 percent (134 ridings)

Ethnic ancestry, largest European, non-founding (excludes Indigenous peoples, British Isles, French, Canadian and Canadian provinces), single and multiple

EO Ridings Dutch 5 percent (75 ridings)

EO Ridings Dutch 10 percent (10 ridings)

EO Ridings German 20 percent (41 ridings)

EO Ridings Italian 10 percent (26 ridings)

EO Ridings Norwegian 5 percent (18 ridings)

EO Ridings Polish 5 percent (60 ridings)

EO Ridings Portuguese 5 percent (8 ridings)

EO Ridings Russian 5 percent (17 ridings)

EO Ridings Spanish 3 percent (6 ridings)

EO Ridings Swedish 4 percent (5 ridings)

EO Ridings Ukrainian 10 percent (35 ridings)

Language most often spoken at home (single), indicator of those more likely to follow ethnic media (5 percent or more)

Language most often spoken at home: Mandarin

Language most often spoken at home: Cantonese

Language most often spoken at home: Punjabi

Language most often spoken at home: Arabic

Language most often spokenat home: German

Language most often spoken at home: Persian

Language most often spoken at home: Tamil

12 other languages are spoken at home between five to ten percent of the population : Italian, Spanish, Cree, Tagalog, Inuktitut, Portuguese, Russian, Bengali, Korean, Polish, Urdu and Vietnamese.

The following table lists the languages and ridings (less than five ridings for each language:

Other languages most often spoken at home – less than 5 ridings – None more than 10%

Indigenous

Indigenous Ridings 10 Percent

Religious minorities (2011 NHS)

RM Ridings Aboriginal 1 percent (23 ridings, only 1 greater than 5 percent)

RM Ridings Buddhist 5 percent (12 ridings)

RM Ridings Hindu 5 percent (23 ridings)

RM Ridings Jewish 5 percent (14 ridings)

RM Ridings Muslim 5 percent (69 ridings)

RM Ridings Muslim 10 percent (24 ridings)

RM Ridings Sikh 5 percent (20 ridings)

Federal riding profiles: A visible minority view

How does Canada’s political map of 338 ridings look in terms of the percentage of visible minorities? How do visible minority rich ridings compare to ridings with fewer visible minorities in terms of demographic, economic and social characteristics, and electoral results? 

Their electoral importance is clear, with 41 ridings in which visible minorities form the majority and an additional 93 ridings in which visible minorities form between 20 to 50 percent of the population.

By looking at ridings grouped by their percentage of visible minorities, the changing nature of Canada’s political landscape can be seen. As party electoral strategies focus on defining a winning approach given the needs and make-up of each riding’s population, having a comprehensive look at the demographic, economic and social characteristics helps one understand the various factors at play in electoral strategies. Political parties, of course, have their own more detailed data at the polling station level; this analysis aims to level the playing field, so to speak, for the rest of us.

This analysis provides a visible minority lens to ridings and their relation to demographic, economic, social and political characteristics. Given the ongoing trend of increasing immigration levels, that close to 80 percent of immigrants are visible minority, and the increased number of Canadian-born visible minorities, this approach provides a future-centred perspective to the political map.

While political parties collect some of this and other data at a much more granular level (postal code and polling station), the riding level provides a good sense of the diversity between ridings, and helps explain some of the political strategies employed to reach voters.

The higher unemployment rates, lower median incomes and greater prevalence of low income, suggest that economic issues are as significant as immigration-related issues such as family reunification in visible minority majority ridings. With their younger age profile and larger number of families, family-friendly policies are also important but childcare may be seen more though a family reunification perspective (parents and grandparents) than through government programs.

Identity politics play out differently depending on the percentage of visible minorities as the experience of the last election shows. Efforts by the Conservatives with respect to the “barbaric cultural practices” tip line and the effective distinction between Canadian-only and dual citizens in their citizenship revocation provisions, while appealing to many, created unease among visible minorities and provided an opening for the Liberal “a Canadian is a Canadian is a Canadian” language.

However, a likely common thread among most Canadians, whatever their origins, is that immigration and citizenship need to be managed and that the fairness and integrity of the processes is maintained. Public concern regarding irregular arrivals (“queue jumping”) and increased numbers of birth tourists are but the obvious examples. While for some, expressing these concerns may be driven by xenophobia, for most it is more likely driven by concerns over fairness and people taking advantage of policies and processes. 

Tables and analysis

This article uses 2016 Census Profile federal electoral district along with Elections Canada voting results by electoral district to highlight similarities and differences. The three broad groups of ridings — 41 ridings in which visible minorities form the majority, 93 ridings in which visible minorities form between 20 to 50 percent of the population, and 169 ridings with less than 20 percent visible minority — are subdivided to provide greater granularity. The groupings with the smallest number of ridings have the lowest variation or range in any of the indicators.

The full analysis can be found: Federal riding profiles: A visible minority view