Military trying to cut recruitment targets for women despite expert’s report

Military, RCMP, CSIS.001RCMP envy (the RCMP successfully managed to negotiate lower targets). Declaring victory by changing the goalposts.

Seriously, there are particular challenges for both the Canadian Forces and the RCMP, but this approach only gives the impression that changing the targets is more important than improving recruitment and retention.

The above chart summarizes the Canadian Forces, the RCMP and CSIS. Only CSIS has a strong employment equity record, but the nature of their work, analogous to much policy work and IT makes it that much easier.

Interestingly, all three organizations do not post their reports. These have to be requested from the Library of Parliament (which is efficient in providing them):

The Canadian Armed Forces is now in consultations with Employment and Social Development Canada and the Canadian Human Rights Commission over how those targets are calculated in hopes they can be brought down to what the military argues are more realistic levels.

Lt.-Cmdr. Meghan Marsaw said in an email that the most recent consultations with ESDC and the human rights commission were held over the winter, though she couldn’t say when any new targets would be set “as further consultation is required both internally and externally.”

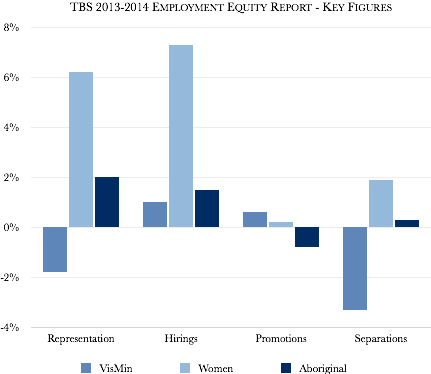
Documents obtained by the Citizen last year showed the Canadian Armed Forces wanting to cut the target for women from 25.1 per cent to 17.6 per cent. It also wanted to change the targets for visible minorities from 11.7 per cent to 8.2 per cent, and for aboriginals from 3.3 per cent to 2.6 per cent.

Military officials would not confirm whether those are still the proposed targets.

The Canadian Human Rights Commission is currently conducting an audit of the Canadian Armed Forces to determine if the military is taking adequate action to increase diversity within the ranks. The commission regularly audits all federal departments and agencies.

Some have previously cautioned against cutting the targets for fear the Canadian Armed Forces will then scale back efforts to increase the number of women as well as visible minorities and aboriginals in uniform. They say the military should strive to represent the country’s demographic make-up.

However, others say that maintaining unrealistic targets could force the military to dilute recruiting standards. They also say it could draw away resources better put to other uses.

Military trying to cut recruitment targets for women despite expert’s report | Ottawa Citizen.

Employment Equity in the Public Service of Canada 2013–14

EE - TBS 2013-14 Summary Chart

Disappointing that TBS has not updated labour market availability (LMA) from 2006 (unlike Labour Canada for federally-regulated sectors – banking, communications, transport – has (17.8 percent visible minorities). However, while visible minorities remain under-represented, the hirings, promotions and separations data is relatively strong:

As at March 31, 2014, all four employment equity designated groups exceeded their workforce availability, as determined from 2006 Census data. Aboriginal peoples continued to increase their representation, from 5.0 per cent to 5.1 per cent; members of a visible minority group increased their representation from 12.6 per cent to 13.2 per cent; the representation of persons with disabilities decreased marginally from 5.8 per cent to 5.7 per cent; and women’s representation decreased slightly from 54.2 per cent to 54.1 per cent.

Within the executive cadre, representation rates continued to exceed workforce availability for three of the four designated groups. Women increased their representation from 46.0 per cent to 46.1 per cent; persons with disabilities increased their representation from 5.3 per cent to 5.4 per cent; and members of a visible minority group increased their representation from 8.2 per cent to 8.5 per cent. The representation of Aboriginal peoples remained stable at 3.7 per cent, below their workforce availability for executives.

For those interested, this table shows the overall trend over the past 5 years:

2009-10

2010-11

2011-12

2012-13

2013-14

Representation

10.7%

11.3%

12.1%

12.6%

13.2%

Hirings

11.3%

9.8%

10.7%

14.7%

16.0%

Promotions

12.1%

12.5%

13.5%

13.5%

13.8%

Separations

6.4%

7.1%

7.7%

8.9%

9.9%

Despite most of these years being under restraint and cutbacks, it is encouraging that representation, hirings and promotions continue to increase (separations may reflect cutbacks).

While TBS has not yet issued a revised LMA, a rough calculation would suggest the LMA has increased from 12.4 in 2006 to 15.0 percent in 2011.

This is based on the percentage of the population which is visible minority (19.1 percent) and adjusting for the percentage that are also Canadian citizens (78.3 percent).

Another view of public service employment equity can be derived from the National Household Statistics on public sector employment, which covers all federal public institutions (less the Canadian Forces), not just the Schedule 1 departments covered in the TBS reports:


Multiculturalism in Canada-Evidence and Anecdote Deck - April 2015.044 Multiculturalism in Canada-Evidence and Anecdote Deck - April 2015.045

Employment Equity in the Public Service of Canada 2013–14.

Women reach top in PS but lack clout male counterparts had, study shows

Interesting study contrasting the number and impact (disclosure I was interviewed for the study):

It’s one of the many paradoxes uncovered by Carleton University researchers Marika Morris and Pauline Rankin in an interim report on a study of female leadership in the public service where women now dominate, holding more than 55 per cent of all jobs and 45 per cent of the executive positions below deputy ministers.

The study is part of the Women in the Public Service Project, run by the Washington-based Wilson Centre, aimed at getting women into 50 per cent of the world’s public service jobs by 2050.

Canada stands out with a public service that already exceeds the 50 per cent female target. The study is examining the impact women are having on shaping the public service and finding ways to measure it. The report is a springboard for such a debate at Carleton on Tuesday.

“With women accounting for 45 per cent of the executive rank, we no longer ask how to get more women in the public service but what difference it makes having them there,” said Morris.

…But that’s also when public servants started losing their monopoly grip on policy and as the sole, trusted advisers to ministers.

“So just as women are entering senior levels, it is harder now than ever to have an impact,” said Morris.

Women who took executive jobs over the past decade arrived just as developing big policy ideas took a back seat to economic restraint. Accountability, spending and job cuts, and avoiding risks were the order of the day.

It’s also a time when the trust between politicians and bureaucrats is low.

“I heard a lot about changes in the past 10 years, less trust and diminished policy-making role, so now that more women … have made their entry into management, they have less responsibility to actually create policy and programs than public servants had in the past,” said Morris.

She said women also moved into the senior jobs with a management style at odds with the hierarchy and traditional lines of accountability. Morris said many executives — both men and women — interviewed felt they “made a difference” and that often the biggest impact they had came from being “collaborative” leaders.

Women reach top in PS but lack clout male counterparts had, study shows | Ottawa Citizen.

Du racisme dans le secteur privé, selon la Commission des droits de la personne

Quebec Government EEOngoing issue in Quebec with visible minorities having higher unemployment rates, greater prevalence of low-income, and lower median incomes than non-visible minorities, often greater than differences elsewhere in Canada.

L’État devrait donc les forcer juridiquement à adopter un mécanisme visant à contrer toute forme de racisme et de discrimination au moment de recruter des employés, plaide l’organisme dans son mémoire présenté mercredi dans le cadre de la consultation publique menée par le gouvernement sur la future politique d’immigration du Québec.

Le gouvernement devrait commencer par donner l’exemple et accorder un statut particulier aux membres des «minorités racisées» (qu’on pense aux Noirs et aux Asiatiques) lorsqu’il y a embauche dans la fonction publique, a fait valoir le président de l’organisme de défense des droits, Jacques Frémont.

Car les nouveaux arrivants issus des minorités visibles sont systématiquement sous-représentés «dans toutes les catégories d’emploi de la fonction publique», déplore la commission dans son document étoffé, assorti de 23 recommandations remises à la ministre de l’Immigration, Kathleen Weil.

Ces personnes, trop souvent victimes de discrimination à l’embauche pour des motifs n’ayant rien à voir avec leurs diplômes ou leurs compétences, devraient donc faire partie d’«un groupe cible distinct et spécifique» aux yeux du gouvernement à titre d’employeur, recommande la commission, qui revendique de plus l’adoption d’une politique globale de lutte contre le racisme et la discrimination.

And as shown in the above chart, relatively low public sector hiring rates for visible minorities.

Du racisme dans le secteur privé, selon la Commission des droits de la personne | Jocelyne Richer | National.

Overall interest in military careers low for Black, Latin-American and Filipino Canadians | National Post

Not particularly surprising, nor is the usual bureaucratic response – change the targets (RCMP had managed to do so a number of years ago):

The findings come as National Defence has been looking to cut legally mandated recruitment targets for women, visible minorities and aboriginals in uniform, a move that has prompted sharp debate in military circles.

While the military is expected to aim to have 11.7% of those in uniform be visible minorities, the actual number is 4.2%.

While that represents an increase from previous years, documents obtained by the Citizen show defence officials have been pushing to cut the target to 8.2%.

Those lobbying for a change will point to the survey of black, Filipino and Latin American Canadians as proof the current employment equity goals are unrealistic. Others, however, will say the report proves recruiting efforts need to change.

The survey saw less than 1% of respondents from the three ethnic groups cite the military from a list of careers they would be interested in pursuing, or which they would recommend to a young person.

Similarly, about 20% of respondents from each of the three groups said the military was the career they would be least interested in pursuing or recommending to someone else.

Overall interest in military careers low for Black, Latin-American and Filipino Canadians | National Post.

Public service still shrinking, but signs show hiring picking up

PS_Hiring_2013-14Understandably, latest report focus on hiring after recent rounds of downsizing:

In its latest annual report, the Public Service Commission revealed signs the bureaucracy is coming out of a major downsizing and gearing up to hire. More jobs were advertised, more people applied and more were hired, moved and promoted within the bureaucracy than the year before.

“What we are now seeing in the data – and we started to see it turn around last year – is that the demand by departments for new hires is starting to go up. So we do anticipate that we will turn the corner on this and start to hire new graduates into permanent jobs in the coming year,” PSC president Anne-Marie Robinson recently told the Senate finance committee.

In fact, the commission has been active getting the message out that once the downsizing is completed, the government will recruit new talent.

Robinson said the public service is “changing” as it emerges smaller and leaner from the 2012 federal budget cuts, which reduced the number of employees by 10 per cent from March 2011.

But last year also saw the first increase in hiring and staffing, both of which had fallen every year for four years. Overall, hiring and staffing jumped 11.7 per cent over the previous year – a far cry from the hiring spree in the years before the Conservatives froze operating budgets and put the brakes on spending.

Relative little on employment equity, which awaits the more comprehensive Treasury Board report, but the above graph highlights the main trends for visible minorities and Aboriginal peoples.

For visible minorities, applicants are greater than labour market availability (LMA), appointments less. The report, unless I missed it, did not have any up-to-date figures on actual representation within the public service.

Public service still shrinking, but signs show hiring picking up | Ottawa Citizen.

Ontario’s Teacher Diversity Gap

Interesting study on the gap between visible minority representation among teachers and the student population in Ontario and Toronto, including comparisons with the USA:

  • The demographic divide between teachers and students in Ontario and the Toronto CMA is large. In Ontario, racial minorities represent 26% of the population, yet make up only 10% of the 70,520 secondary school teachers and 9% of the 117,905 elementary school and kindergarten teachers. In the Toronto CMA, racial minorities represent 47% of the population, yet make up 20% of secondary school teachers and 18% of elementary school and kindergarten teachers.
  • The Teacher Diversity Gap is worse in Ontario and the Toronto CMA than for the United States overall. While Ontario and the Toronto CMA are doing a slightly better job of reflecting the diversity of the student population than states such as Ohio, we are also doing worse than other states, including New York, Mississippi, Alabama and Louisiana. The Teacher Diversity Gap for the United States as a whole is slightly smaller than the gap for Ontario and the Toronto CMA.
  • The Teacher Diversity Gap is no better for the Toronto CMA than it is for Ontario. The Teacher Diversity Gap in the Toronto CMA is .40, while the gap for Ontario is .38. This means that the demographic divide between teachers and students is just about the same for students in the Toronto CMA as it is for students in the rest of the province.
  • The gap could get worse as the population becomes more diverse. While we currently face a large Teacher Diversity Gap, the province is rapidly becoming more diverse. Statistics Canada data shows that racial minorities currently represent 26% of the Ontario population and 47% of the Toronto CMA population. Statistics Canada projects that by 2031 racial minorities could make up 63% of the Toronto CMA population. As such, without significant changes to the composition of the teaching population, the Teacher Diversity Gap may widen.

Previous  employment equity reporting provided much more detail (e.g, 2006 reports cited) compared to today’s high level overview limited to the Canadian public service and federally regulated sectors (banking, communications, transportation).

Combination of budget cuts and change in government priorities.

Ontarios Teacher Diversity Gap – TURNER CONSULTING GROUP INC..

Apple Is Mostly White and Male, According to Its First Diversity Report

Hitech diversityNo surprise and in line with its competitors as above graphic shows (although its ads generally portray diversity well):

Apple, the latest tech company to reveal its workforce demographics, said Tuesday that its U.S. staff is 55% white, 15% Asian, 11% Hispanic and 7% black. Two percent of workers are multiracial, and another 9% did not declare their race.

In regards to gender, Apple’s global workforce is 70% male and 30% female. Within tech-related jobs specifically, the disparity is 80% male and 20% female.

Apple’s employee demographic trends are similar to those of other major tech companies, several of whom, like Google, Facebook and Twitter, have also recently released diversity reports. Like the other firms, Apple included in its report a public commitment to increase the diversity of its workforce.

“As CEO, I’m not satisfied with the numbers on this page,” Apple head Tim Cook said in a letter accompanying the figures. “We are making progress, and we’re committed to being as innovative in advancing diversity as we are in developing our products.”

In addition to race and gender, Cook said that Apple celebrates other types of diversity, such as people with disabilities as well as varying sexual orientations.

Time Magazine.

eBay’s Surprising Diversity Figures | TIME

More on diversity within the tech industry, this time eBay:

The tech industry is notoriously dominated by white and Asian men. But eBay’s first diversity report shows that it employs more women, blacks and Hispanics than its peers.

Forty-two percent of eBay’s staff of 33,000 workers is female, beating out LinkedIn’s 39%, Yahoo’s 37%, Facebook’s 31%, Twitter’s 30% and Google’s 30%.

eBay also reported that 7% of its U.S. employees are black and 5% are Hispanic.

But even though eBay as a whole may be more diverse than many other tech companies — it also had a female CEO, Meg Whitman, from 1998 through 2008 — there is still a huge gender gap in terms of tech jobs and leadership roles: only 24% of eBay’s tech workers are women.

eBay’s Surprising Diversity Figures | TIME.

Matt Gurney: Quotas have no place in our military

The predictable reaction to the story regarding revising Canadian Forces diversity targets downward (Canadian military hopes to cut hiring targets for women, minorities).

There is merit in the argument that the military recruiting base tends to be more rural and more white. But merit arguments sometimes also disguise unconscious biases and preferences. Having targets (I oppose quotas) ensures focus on what is a likely long-term challenge:

A more diverse military is a desirable goal, of course — albeit one that should be treated as completely secondary to the primary objective of fielding a competent force. And as Canada becomes increasingly diverse, the military naturally will draw recruits from a wider pool of applicants. But as it stands now, many recruits join to escape local economic difficulties in parts of the country that are less multicultural than our large cities, or to honour long family traditions of service. We owe all of them a fair chance and, of course, our thanks.

But we owe the country a properly trained and equipped fighting force, regardless of what it looks like. If someone is willing to put on the uniform and defend Canada and our values abroad, and meets reasonable definitions of fitness and suitability, that’s all that matters. Our soldiers defend the country, not just those who look like them.

Matt Gurney: Quotas have no place in our military | National Post.