Rempel Garner: 50K+ jobs to foreign workers in Q1. Why?
2025/07/19 Leave a comment
Interesting list of which companies and organizations, and for which occupations, had approved LMIAs (Rempel Garner neglects to mention Kenney’s earlier mistake and rhetoric regarding expanded access for Temporary Foreign Workers but his correction was both quick and efficient).
The chart below shows the overall shift to lower skilled occupations, particularly a greater shift to the lowest skill levels, with some correction in the latter half of 2024:

…The Q1 List of Shame
To illustrate the dysfunction, consider these (few) examples (there are many, many more, and I encourage you to look through the list yourself):
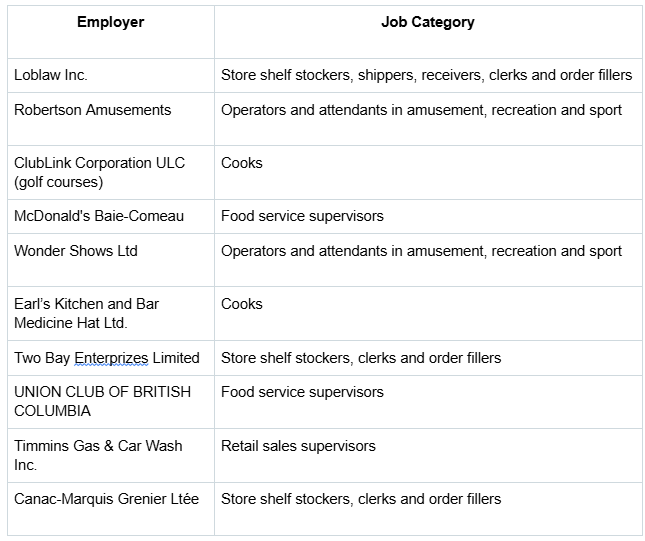
Companies and public sector entities that got approved to hire entry-level and food services labour:
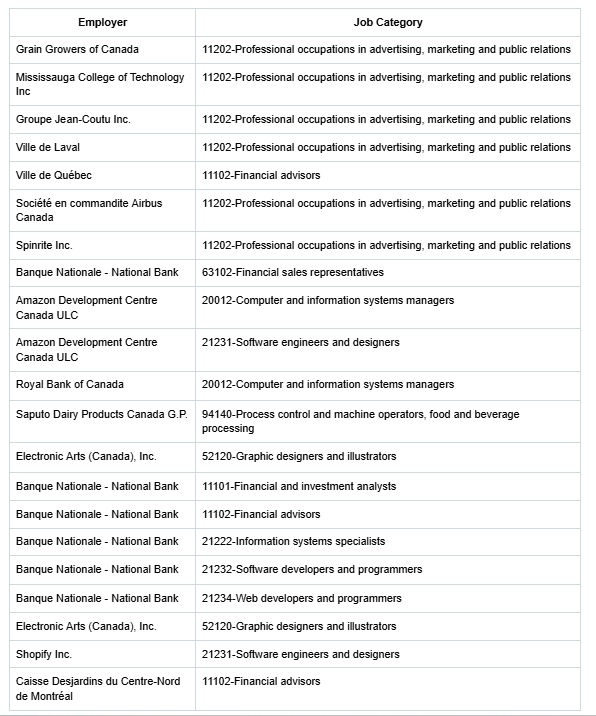
Companies and public sector entities that got approved to hire white collar jobs with TFWs (my personal favourite here is the Grain Growers of Canada(a lobby group) receiving a positive LMIA decision for a communications position….come on guys, for real??):
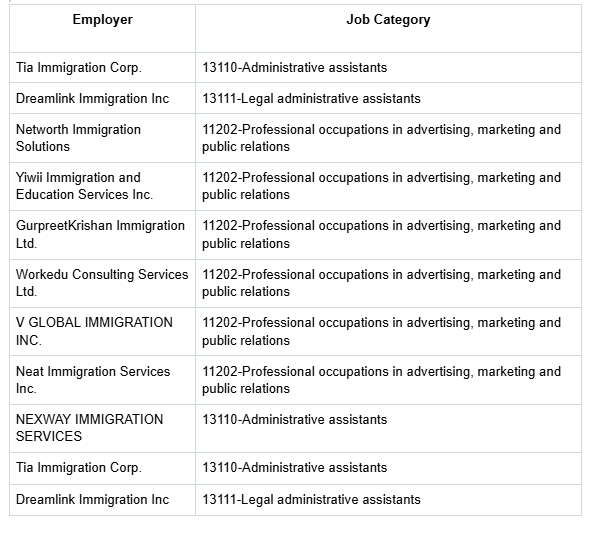
Immigration consulting firms that often help companies get approved for TFWs got approved for TWFs too:
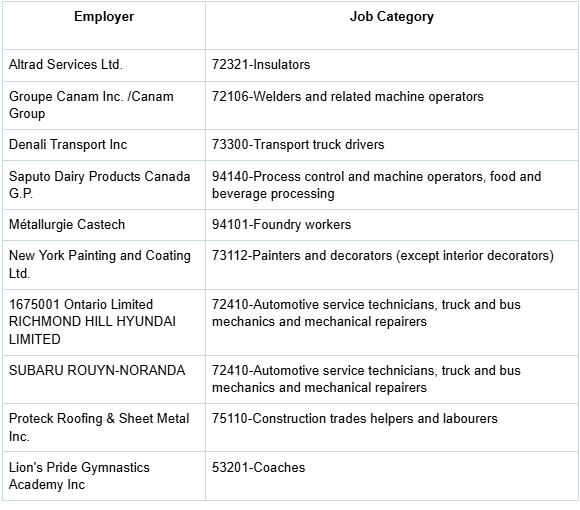
Companies that got approval to fill trades jobs with TFWs:
The arguments that many companies most commonly use to justify their use of the TFW program (particularly the low-skilled stream) are that:
- Canadians don’t want to do the work
- That only a foreigner could do the job, or
- That government benefit programs often prevent people from taking jobs.
In many cases, these arguments wouldn’t pass the smell test for an ordinary Canadian, so they shouldn’t for the Liberal government either.
In reality, outside of a very few regions where unemployment levels significantly defy the current national rate of 6.9%, and in certain segments of the seasonal agricultural industry, many of these jobs can and should go to available Canadians. And, there won’t be change unless the Liberals stop buying into bunk arguments for temporary foreign labour and find ways to reform the program, or, as the case may be, incent Canadians to work. Wages that aren’t suppressed by an open floodgate of low skilled temporary foreign labour would probably be a good place to start.
Ironically, on that front, all the Liberals had to do upon taking office in 2015 was not bend to the will of powerful corporate lobbyists clamouring for the reversals of program changes made by the former Harper Conservative government. I was in cabinet at the time and remember the gnashing of teeth and wailing from employers that were accused of seriously abusing the program.
Nonetheless and to his credit, Jason Kenney, as Minister of Employment and Social Development, introduced major reforms to the TFW program and LMIA process in 2013 and 2014. In 2013, key changes included requiring employers to pay temporary foreign workers at prevailing wages, introducing processing fees for LMIA applications, extending job advertising periods to recruit Canadians first, and adding scrutiny on outsourcing impacts. The 2014 overhaul was more comprehensive: it imposed a 10% cap on low-wage foreign workers per worksite (phased in from higher limits), barred low-wage hires in regions with unemployment above 6%, limited low-wage worker stays to two years, introduced moratoriums in sectors like food services, boosted inspections and fines for violations, and split the TFW program from the International Mobility Program to reduce overall reliance on foreign labor, leading to an 80% drop in low-skilled approvals.

