Captures some of the challenges well in terms of integrating and understanding what the various data sources and the need to ensure the underlying data is solid. Data is rarely perfect:
…No single dataset offers a complete picture. Administrative records provide legal and demographic precision but often arrive slowly. Surveys reveal motivations and lived experiences but are costly and difficult to conduct during crises. Digital traces offer speed and scale but may overlook important populations and contexts.
Each source captures different dimensions of migration. Together, they provide a richer understanding than any could alone.
As governments invest in artificial intelligence and data-driven governance, this lesson becomes increasingly important. The availability of real-time big data should not obscure other types of data that complement the picture.
If AI is truly to work for all, as the Canadian AI strategy suggests, we must look beyond algorithms themselves and pay closer attention to the data on which they depend.
The question is not whether we use proxies to understand migration. We always have. The real question is which proxies we use, what they reveal and what they leave unseen.
Useful data visualizations broken down by new entrants and enrolled, visible minority group, gender, age, field of study. Some interesting variations by group, gender and field of study.
In terms of enrolled, Chinese have the highest percentage in STEM (40 percent) with Black’s the lowest (20 percent), followed by not visible minority (22 percent). For new entrants, similar pattern but with tighter percentage in STEM, Chinese (49 percent), Black (27 percent), not visible minority (29 percent).
Parmi les renvois exécutés cette année, 841 dossiers entraient dans la catégorie des cas « graves » : sécurité nationale, crimes de guerre, violations des droits de la personne, crime organisé et criminalité. Le reste des expulsions portaient sur des motifs liés au statut migratoire et à l’application de la Loi sur l’immigration et la protection des réfugiés.
Sur les 19 000 renvois, 4823 personnes ont été retournées aux États-Unis.
Pour l’ensemble des personnes expulsées par le Canada, le Mexique, l’Inde et Haïti sont les pays de citoyenneté les plus représentés. Suivent la Colombie, la Roumanie, les États-Unis et le Venezuela.
Une mesure d’expulsion est exécutoire dès que tous les recours ont été utilisés et qu’aucune suspension n’est en vigueur.
Recul des demandes d’asile
Pendant ce temps, au Québec, les demandes d’asile ont plongé de 30 %.
Entre janvier et novembre, l’ASFC a traité 20 752 demandes d’asile, contre 29 668 demandes, au cours de la même période, l’an dernier.
Cette baisse ne reflète toutefois pas l’ensemble du système d’asile, puisque des demandes sont plutôt évaluées par Immigration, Réfugiés et Citoyenneté Canada (IRCC).
Selon les données les plus récentes, au 25 septembre, 31 875 demandes avaient été traitées au Québec, contre 45 530 à la même date, un an plus tôt, soit une baisse de 30 %.
À l’échelle canadienne, 89 380 demandes avaient été enregistrées, contre 132 455 l’année précédente, une chute de 32,5 %.
Un cas isolé
Au chapitre des entrées irrégulières, aucun signe de hausse, assure Miguel Bégin, directeur du district frontière Est.
« Au niveau des entrées illégales, il n’y a pas de tendance actuellement qui démontre une augmentation », a-t-il déclaré à La Presse.
L’affaire des 44 migrants découverts dans un camion cube sans ventilation à Stanstead, en août, demeure selon lui un cas isolé1.
« C’était effectivement un réseau de passeurs qui avait recruté toutes ces personnes-là, qui avaient payé pour entrer au Canada. Elles ont presque toutes été retournées aux États-Unis. S’il y en a qui sont restées, il n’y en a vraiment pas beaucoup. C’est vraiment très, très minime par rapport à la totalité du groupe. On parle probablement de moins de 5 personnes sur le groupe de 44 personnes. »
Moins de voyageurs
Entre janvier et octobre, l’ASFC a accueilli un peu plus de 70 millions de voyageurs, comparativement à 80,5 millions en 2024, une baisse de 12 % toutes catégories confondues : Canadiens, touristes, immigrants temporaires.
« On a observé une diminution du nombre des voyageurs cette année, surtout les voyageurs canadiens. On a suivi l’évolution, surtout en période estivale, parce que c’est là où on a nos plus gros volumes », explique M. Bégin.
Among the referrals executed this year, 841 cases fall into the category of “serious” cases: national security, war crimes, human rights violations, organized crime and crime. The rest of the deportations were on grounds related to immigration status and the application of the Immigration and Refugee Protection Act.
Of the 19,000 returns, 4823 people were returned to the United States.
For all people expelled by Canada, Mexico, India and Haiti are the most represented countries of citizenship. Followed by Colombia, Romania, the United States and Venezuela.
An expulsion measure is enforceable as soon as all remedies have been used and no suspension is in force.
Detrain of asylum applications
Meanwhile, in Quebec, asylum applications fell by 30%.
Between January and November, the CBSA processed 20,752 asylum applications, compared to 29,668 applications during the same period last year.
However, this decline does not reflect the entire asylum system, since applications are instead assessed by Immigration, Refugees and Citizenship Canada (IRCC).
According to the most recent data, as of September 25, 31,875 applications had been processed in Quebec, compared to 45,530 on the same date, a year earlier, a decrease of 30%.
At the Canadian level, 89,380 applications were registered, compared to 132,455 in the previous year, a drop of 32.5%.
An isolated case
In terms of irregular entries, there are no signs of an increase, says Miguel Bégin, director of the East border district.
“In terms of illegal entries, there is currently no trend that shows an increase,” he told La Presse.
The case of the 44 migrants discovered in a cubic truck without ventilation in Stanstead in August remains an isolated case, according to him1.
“It was indeed a network of smugglers who had recruited all those people, who had paid to enter Canada. Almost all of them were returned to the United States. If there are those who have stayed, there are really not many. It’s really very, very minimal compared to the entire group. We are probably talking about less than 5 people out of the group of 44 people. ”
Fewer travelers
Between January and October, the CBSA welcomed just over 70 million travelers, compared to 80.5 million in 2024, a decrease of 12% in all categories: Canadians, tourists, temporary immigrants.
“There has been a decrease in the number of travellers this year, especially Canadian travelers. We have followed the evolution, especially in the summer, because that is where we have our largest volumes, “explains Mr. Begin.
Hard to argue against more data but the Government and NDP rejected a similar amendment in the case of C-3 (citizenship). But yes, quarterly and annual reports are more informative in terms of trends but given that all IRCC immigration-related data sets are released monthly on open data, same should apply here and on open data, not reports to parliament:
Ottawa would have to report to Parliament every month on the number of foreign nationals who have been deported, including those with criminal convictions, under changes to the government’s border bill pushed through by the Conservatives.
A slew of amendments to Bill C-12, including boosts to immigrationenforcement, passed in a marathon meeting of the Commons public safety meeting on Tuesday evening, where MPs scrutinized the bill until midnight.
The committee voted for detailed monthly reports to Parliament on the number of deportations, including on where people came from and their age and gender, despite objections from a senior border official who argued that quarterly or annual reports would paint a clearer picture.
Complete text of revised bill. Only part that struck my interest that had not been reported previously was the data provision:
26.1 (1) Within three months after the end of each fiscal year, the Minister must prepare a report for the previous year that sets out the number of persons who become citizens as a result of the coming into force of An Act to amend the Citizenship Act (2025), their countries of citizenship other than Canada, if any, their most recent country of residence and the provisions of this Act under which they are citizens.
(2) The Minister must cause the report to be laid before each House of Parliament on any of the first 15 days on which that House is sitting after the report is completed.”
Rather than defaulting to a conspiracy theory, perhaps this delay in releasing the data reflects reorganizational stress given resource constraints. Still no excuse for these delays as generally IRCC is one of the better departments in terms of data availability:
The Carney Liberals have been hiding immigration data from Canadians for months. Now, after being called out on it, the government says it’s all in the name of openness and transparency.
Normally, government numbers on the number of new arrivals, the number of asylum seekers and more are released on the government’s open data portal. As of now, the government hasn’t released any data since May and that information only covers until the end of March.
The news was made public in a statement last week by Conservative Immigration Critic Michelle Rempel-Garner.
“How many illegal border crossings have we had? How many more asylum claims have piled on to an already backlogged waitlist? How many more permits have the Liberals handed out that continue to overwhelm our housing, health-care system and job market?” Rempel Garner asked.
“Whatever they are, Canada has a right to know.”
She’s right: We do have a right to know, especially since the Liberals have made such a disaster of the immigration system….
To help accomplish its aim of mass deportations, the Trump administration is tapping into numerous federal, state, and local databases at an unprecedented scale, and making more of them interoperable. The reach into and communication between information storehouses—including ones containing sensitive information about all U.S. residents’ taxes, health, benefits receipt, and addresses—allows U.S. Immigration and Customs Enforcement (ICE) and other authorities to harvest, exchange, and share a vast trove of data. The aim of tapping government and commercial databases appears twofold: attempt to secure large-scale arrests and deportations of removable noncitizens, and instill a sense of fear so that others “self deport.”
The Trump administration’s Department of Government Efficiency (DOGE), launched by Elon Musk, has played an oversized role in this data-leveraging mission, accessing sensitive databases across government agencies and breaking down long-standing silos erected for operational and privacy reasons. And the software company Palantir, a longtime ICE contractor, has been awarded a new contract initially for $30 million to build a “streamlined” database to aid immigration enforcement.
Palantir’s Immigration Lifecycle Operating System (ImmigrationOS) will add to an already formidable arsenal of data available to ICE, including from the private sector. The agency is believed to be among the largest government purchasers of commercial credit, utility, motor vehicle agency, and other information—including airline passenger data, according to recent reporting. By one estimate, in 2022 ICE was able to know the addresses of three out of four U.S. adults—citizen and noncitizen alike.
ICE was established as part of the U.S. counterterrorism and homeland security machinery that was expanded in the wake of the September 11, 2001 terrorist attacks. While the post-9/11 enterprise was aimed at foreign terrorists, today’s principal enforcement mission across a range of government agencies is to assist the Trump administration’s quest to carry out 1 million deportations annually.
The government’s tapping into databases with sensitive personal information—including databases never before used for large-scale immigration enforcement, such as voter information—has raised alarm among civil libertarians and security experts, who fear the potential for privacy violations for all U.S. residents and possible exploitation by nefarious actors.
This article looks at the recent efforts to expand ICE’s domestic surveillance and arrest capabilities by giving it access to new databases to build a vast, interoperable data network that can be used for immigration enforcement purposes, with the possibility of future implications for U.S. citizens. It places the current moves within a 25-year legacy of information-sharing initiatives in the immigration realm…
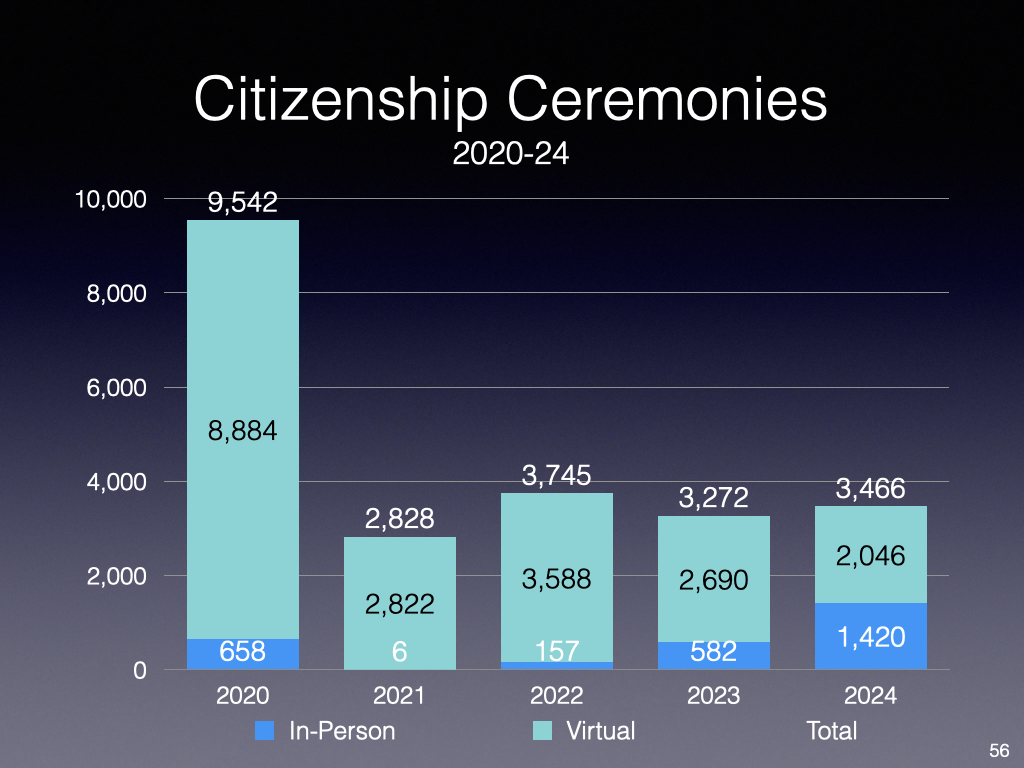
During the pandemic, IRCC shifted by necessity to holding virtual citizenship ceremonies. Once the pandemic was largely over, a shift back to in-person ceremonies occurred gradually. But the majority new citizens still become citizens through virtual ceremonies.
In response to that petition, the government indicated that approximately two-thirds of all new citizens participated in a virtual ceremony (” From January 1, 2023 to September 30, 2023, the Department has held on average 50 in-person ceremonies and 224 video ceremonies per month with an average of 79 and 135 invited participants per event, respectively.”)
Subsequently, IRCC provided me with citizenship ceremony data from 2020 (start of pandemic) to 2024. The following charts summarize the change over the years.
Figure 1: Number of citizenship ceremonies by typeFigure 2: Relative percentages of in-person and virtual ceremonies
Using the same percentage breakdown between in-person and virtual ceremonies from January to September 2023 (IRCC was unable to provide breakdowns for this dataset), the following chart contrasts the number of new citizens by ceremony type.
IRCC does provide the option for applicants to specify their citizenship ceremony preferences:
The petition recommended that “Most citizenship ceremonies should be in-person.” However, this data highlights that while over 40 percent of 2024 ceremonies are now in-person, it still remains the fact that the majority of new Canadians participate in virtual ceremonies, reflecting the larger average size of virtual ceremonies.
Given the importance of citizenship ceremonies in immigrant integration and citizenship meaningfulness, any future government should continue and accelerate the shift back to in-person ceremonies.
Legitimate worry and consistent with the apparent “wrecking ball” approach to policy and programs:
Every month, the federal government serves up a steady diet of economic reports on everything from the price of groceries to the unemployment rate. These reports are closely followed: They can move markets — and the president’s approval rating.
Businesses and investors put a lot of stock in the numbers, which are rigorously vetted and free from political spin.
Now the Trump administration is calling that trust into question.
The government recently disbanded two outside advisory committees that used to consult on the numbers, offering suggestions on ways to improve the reliability of the government data.
At the same time, Commerce Secretary Howard Lutnick has suggested changing the way the broadest measure of the economy — gross domestic product — is calculated.
Those moves are raising concerns about whether economic data could be manipulated for political or other purposes.
Among those raising the alarm is Erica Groshen. She’s one of the outside experts who received a terse email last week saying her services were no longer needed, because the committee she’d served on — the Federal Economic Statistics Advisory Committee — had been folded.
Groshen cares deeply about the reliability of government data, having previously overseen the number crunching as commissioner of the Bureau of Labor Statistics.
“Statistical agencies live and die by trust,” she says. “If the numbers aren’t trustworthy, people won’t use them to make important decisions, and then you might as well not publish them.”
A really good analysis of the data, highlighting the bad actors among public and private institutions. Of course, the main responsibility lies with federal and provincial governments for allowing this situation to develop; the institutions were just responding to the conditions (and incentives) set:
…Among educational institutions, we know who the bad actors are. See table 1.
Of the 650 designated learning institutes, 301 did not have a single study permit holder apply for asylum, IRCC data shows.
On the other hand, 80 institutions had more than 100 asylum claims each, which account for 77 per cent of total asylum applications. Within that, there are 16 institutions with more than 500 asylum claims each and four institutions with more than 1,000 claims each.
The absolute number of asylum claims is high and the increase over the last seven years is steep, especially after 2022, when pandemic border restrictions were lifted. But the percentage of international students who applied for asylum is low.
However, there were 37 institutions where 10 per cent or more of study-permit holders applied for asylum. Here are the 11 where the percentage was higher than 30 per cent:
The high percentage of international students applying for asylum from these institutions could point to someone at the institution, or the institution itself, suggesting or assisting students with their applications.
Or the institution could be advertising to potential study-permit holders that applying for asylum once they arrive is a viable pathway to staying in Canada amid the changing policy environment.
Specifically, I found a handful of colleges where 100 per cent of their international students have claimed asylum in recent years.
In 2020, the Institute of Technology Development of Canada (ITD) had 10 study permits approved and 10 asylum claims made. In 2023, the Canadian Technology College had 10 study permits approved and 10 asylum claims made, while DEA Canadian College had five study permits approved and five asylum claims made.
More concerning is that while some institutions do not have a 100-per-cent asylum application rate among their study permit holders, their absolute numbers are high.
In 2024, CIMT College had 330 study permits approved and 280 asylum claims – an 85-per-cent rate.
The numbers are similar at the Canadian Career Education College, which had 265 study permits approved and 200 asylum claims made – a 75-per-cent rate. While it is unclear from the data what year the study-permit holders who applied for asylum got their study permits, the trend is worth examining…