Good detailed overview of Census 2021 (albeit years late). Possibly preparing for debates and discussions regarding the 2026 Census:
Numbers can tell a story. Canada is home to 41.58 million people, according to the latest population estimates, and the average age was 41.7. At the time of the last census, just over half were women and girls, and just under half were men and boys. Of the nearly 30.5 million people 15 and older, 100,815 (0.33 per cent) were transgender or nonbinary. The average household size was 2.4 people. Five per cent of the population — 1.8 million people — self-identified as Indigenous. Almost one-quarter, or 8.4 million people, were immigrants, many hailing from the three leading places of birth: India, the Philippines and China. Of the 450-plus ethnic or cultural origins reported, “Canadian” was tops at 5.7 million people.
The last census conducted by Statistics Canada in 2021, and released in stages throughout 2022, revealed the ways Canada stands out among the G7, including fastest population growth (mostly due to people moving here from elsewhere), most educated workforce (again, thanks in large part to immigrants), highest proportion of common-law couples and, at almost one-quarter, the highest proportion of foreign-born people who are now citizens.
In December, it was revealed that Canada’s population decreased for the first time in about five years — thanks again to immigration or, rather, a drop in its numbers. Driven by caps on international students and temporary foreign workers, the country’s population as of Oct. 1, 2025, declined by roughly 76,068 people, or 0.2 per cent, from July 1, when the population was estimated to be 41.65 million….
As a companion piece to my earlier riding level analysis of visible minorities, The Political Impact of Increased Diversity: What the Census Shows, I performed the same analysis with respect to Indigenous groups, highlighting that the relative political importance of Indigenous groups is declining in relation to visible minorities in electoral terms. This draft was shared with the three national Indigenous organizations but no comments were received given their higher priorities.
The 2021 census highlights the growth in immigrants, visible and religious minorities. The political impact will continue to play out at the riding level, further reinforcing political party efforts to attract voters from these groups. This article provides a detailed analysis of diversity at the riding level, with the percentage of visible minorities and key demographic and socio-economic characteristics of these ridings.
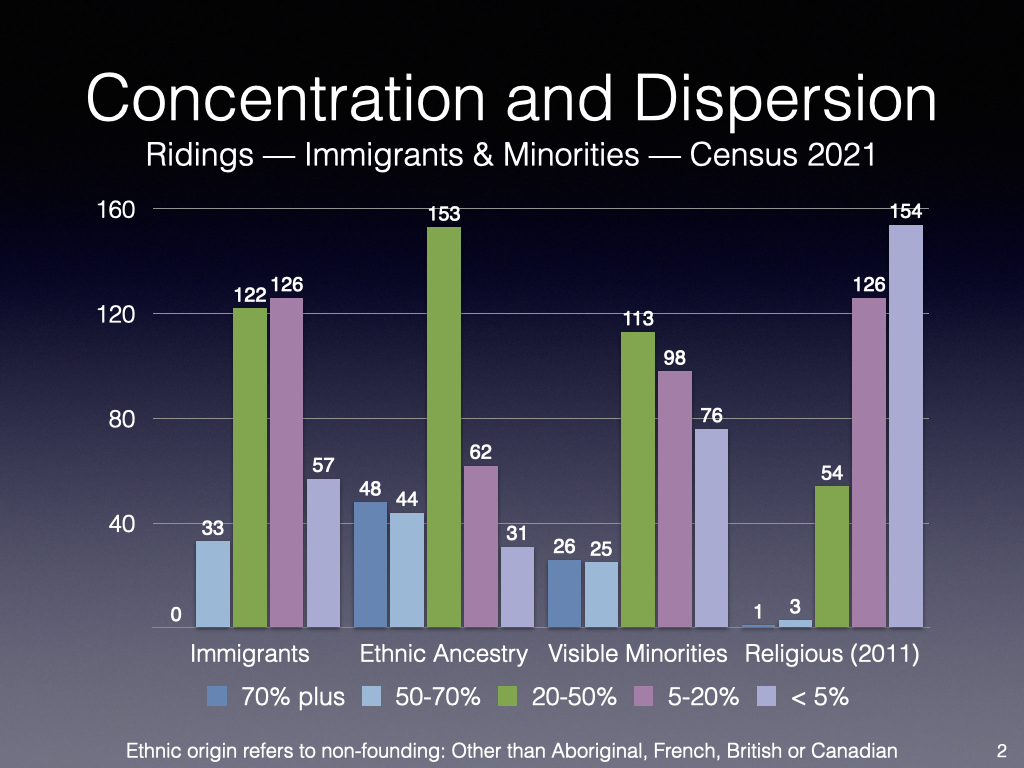
Figure 1 contrasts immigrants, non-founding ethnic ancestry or origin, visible and religious minorities by their percentage in ridings, highlighting the large number of ridings with significant population shares of each group.
Figure 2 highlights the growth of ridings where visible minorities form a significant share of the population. The number of ridings in which visible minorities form a majority of the population has increased from one in ten (33) in 2011 to close to one in six (51), reflecting high and increasing levels of immigration. Moreover, the number of ridings with significant numbers of visible minorities (20 to 50 percent) has also increased significantly, reflecting ongoing immigration to smaller urban and suburban centres.
While the number of ridings with between five and 20 percent visible minorities has stayed relatively constant, the percentage of visible minorities has increased by five percent or more in about half of these ridings.
In contrast, there are only four ridings in which religious minorities form the majority, an increase of two compared to 2011, with 54 ridings in which religious minorities are between 20 and 50 percent, an increase of 12 compared to 2011.
Figure 3 shows ridings with a majority of visible minorities by province, with Ontario, British Columbia and Alberta having the greatest share and increase compared to the 2016 census. These are all ridings where one can expect all parties to run visible minority candidates, most likely from the largest visible minority group in the riding.
However, virtually all provinces have an increased number of ridings with between 20 and 50 percent visible minorities, and thus ridings where visible minorities are a significant constituency.
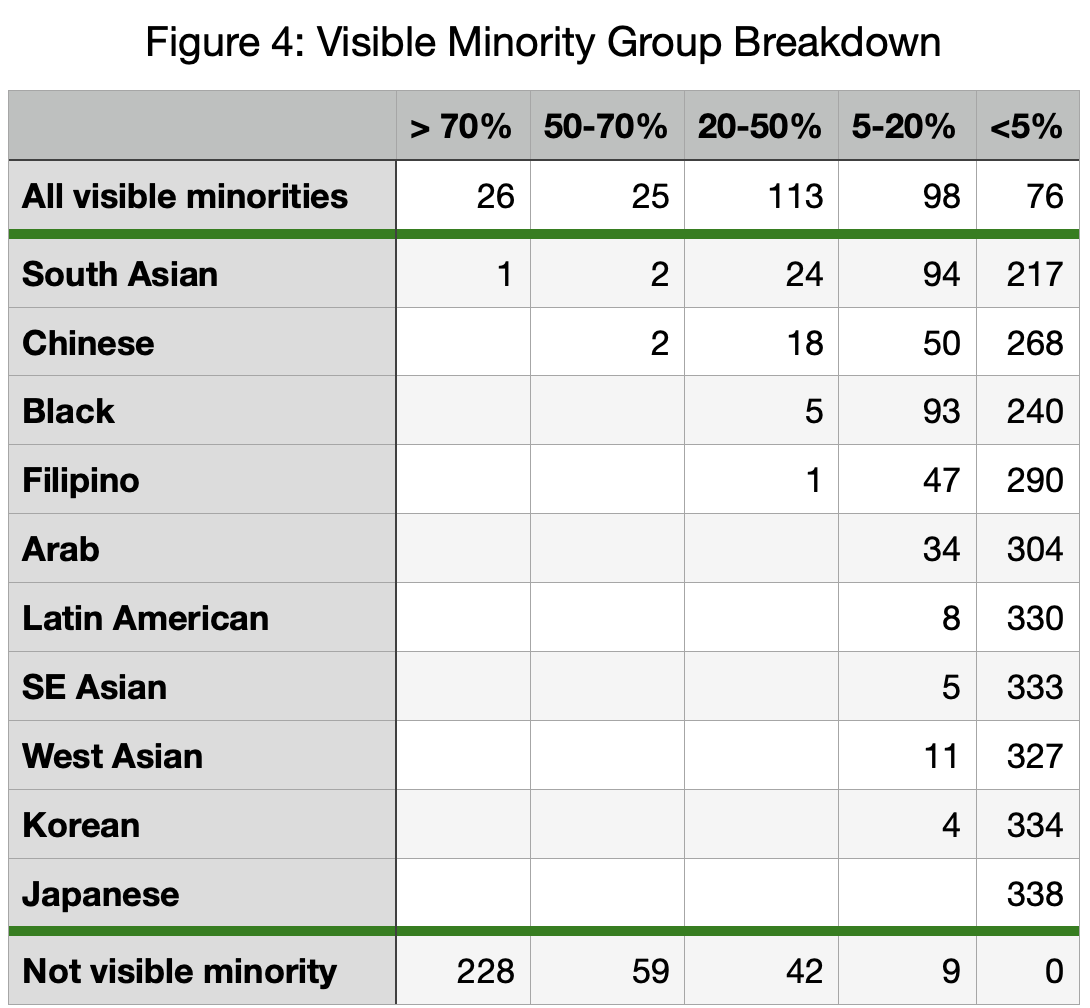
Figure 4 provides the breakdown by visible minority group, with only South Asians and Chinese being a majority of the population (five ridings out of 51 – Brampton East and West, Surrey-Newton for South Asians, Markham-Unionville and Richmond Centre for Chinese), highlighting that most visible minority majority ridings have a mix of visible minority groups. All visible minority groups are present in ridings with between 5 and 20 percent, save Japanese.
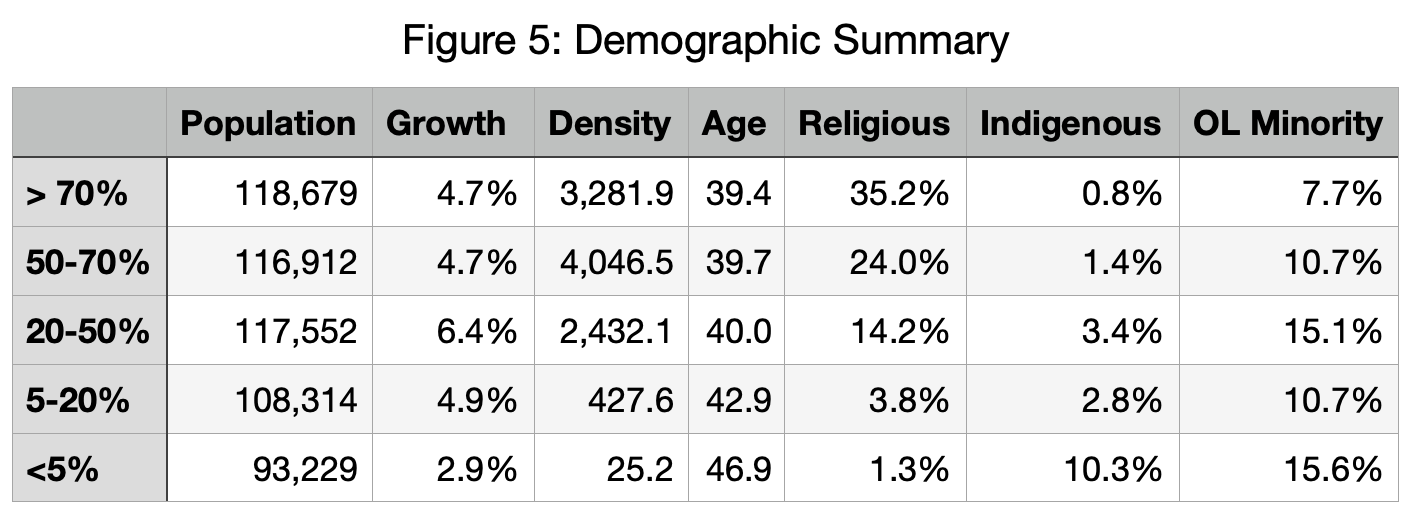
Demographic and socioeconomic characteristics vary by percentage of visible minorities as shown in Figure 5.
Visible minority majority ridings are characterized by larger populations, moderate growth, high densities, a younger population, a higher percentage of religious minorities and a low percentage of Indigenous peoples, with the reverse generally being the case for ridings with less than 20 percent visible minorities, highlighting the differences between rural and urban Canada. The highest growth occurs in ridings with 20 to 50 percent visible minorities, ridings that are increasingly diverse. The percentage of religious minorities correlates with the percentage of visible minorities. There is no overall pattern with respect to official language (OL) minorities.
As one would expect, the higher the percentage of visible minorities, the higher the percentage of immigrants and conversely, the lower the percentage of citizens given residency and other requirements as shown in Figure 6. The period of immigration highlights the contrast between earlier waves of immigration, largely European in origin and in low visible minority ridings, and later waves, largely visible minority, with an impact across all ridings, particularly in the last five years and in ridings with lower overall percentage of visible minorities.
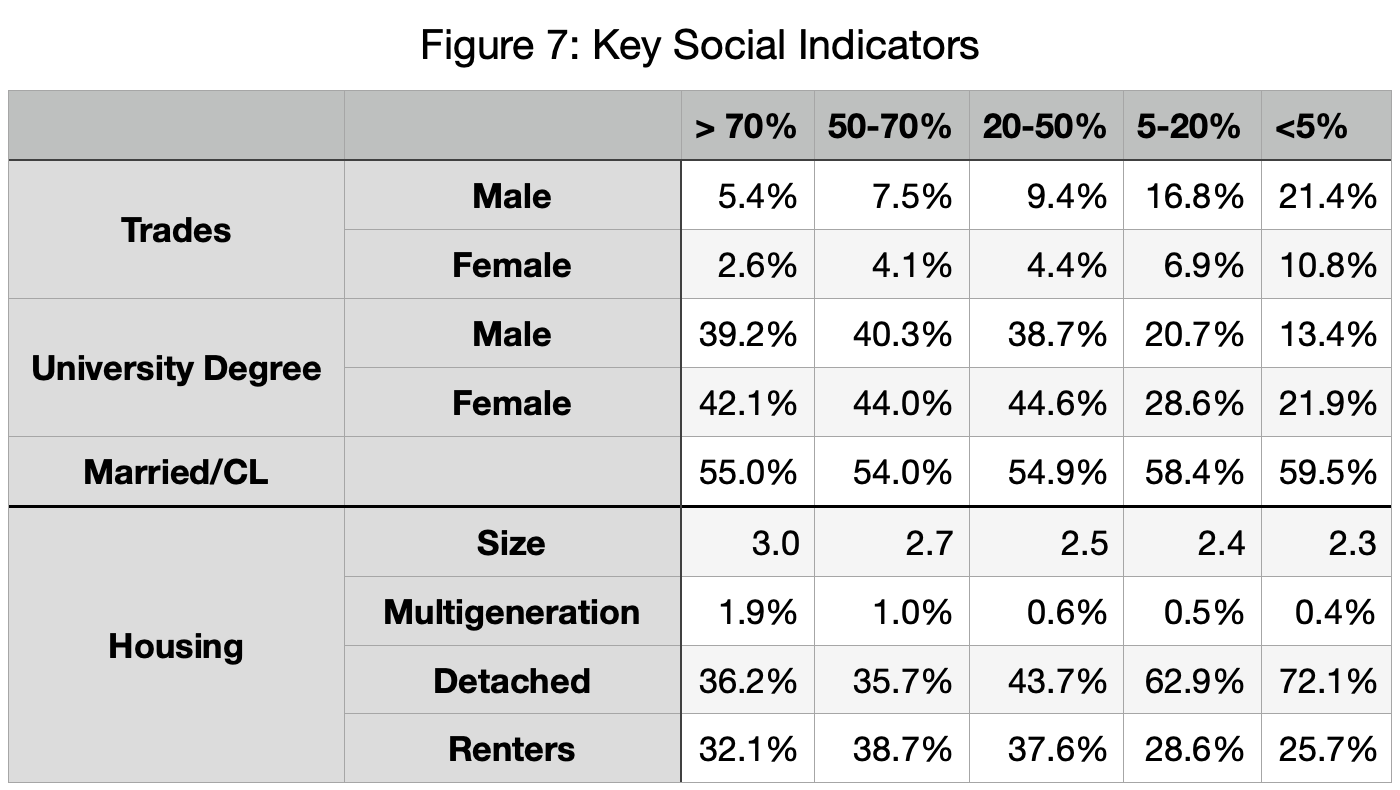
Figure 7 highlights educational attainment (trades and university degree, the percentage of married or common-law couples, household size, and whether residents form part of multigenerational households, are in single-detached housing and the percentage of renters. Trades are more prevalent in ridings with fewer visible minorities and university diplomas more prevalent in ridings with more visible minorities. Women have higher rates of university degrees across all ridings.
Variations on marriage or common law between ridings are small. Household size directly relates to the percentage of visible minorities whereas the prevalence of single detached homes is inversely proportional. Renting is more prevalent in ridings with between 20 and 70 percent visible minorities.
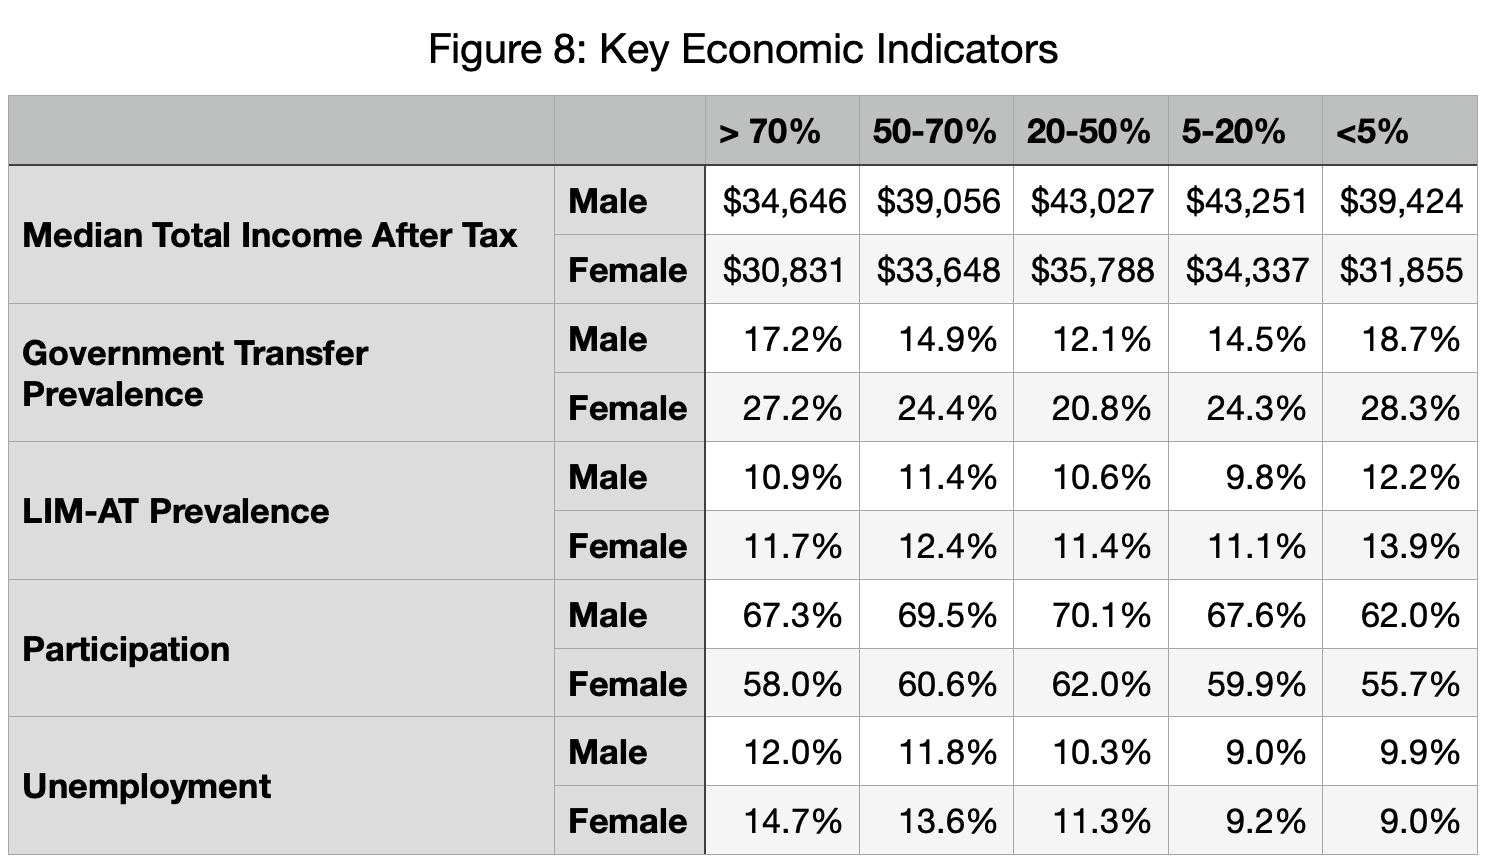
Figure 8 highlights median total after tax income, the percentage of government transfers and income along with participation and unemployment rates. In general, ridings with between 20 and 50 percent have the strongest economic outcomes save for unemployment rates which are lowest in ridings with fewer visible minorities. Outcomes for women are worse overall except with respect to unemployment in ridings with less than 20 percent visible minorities.
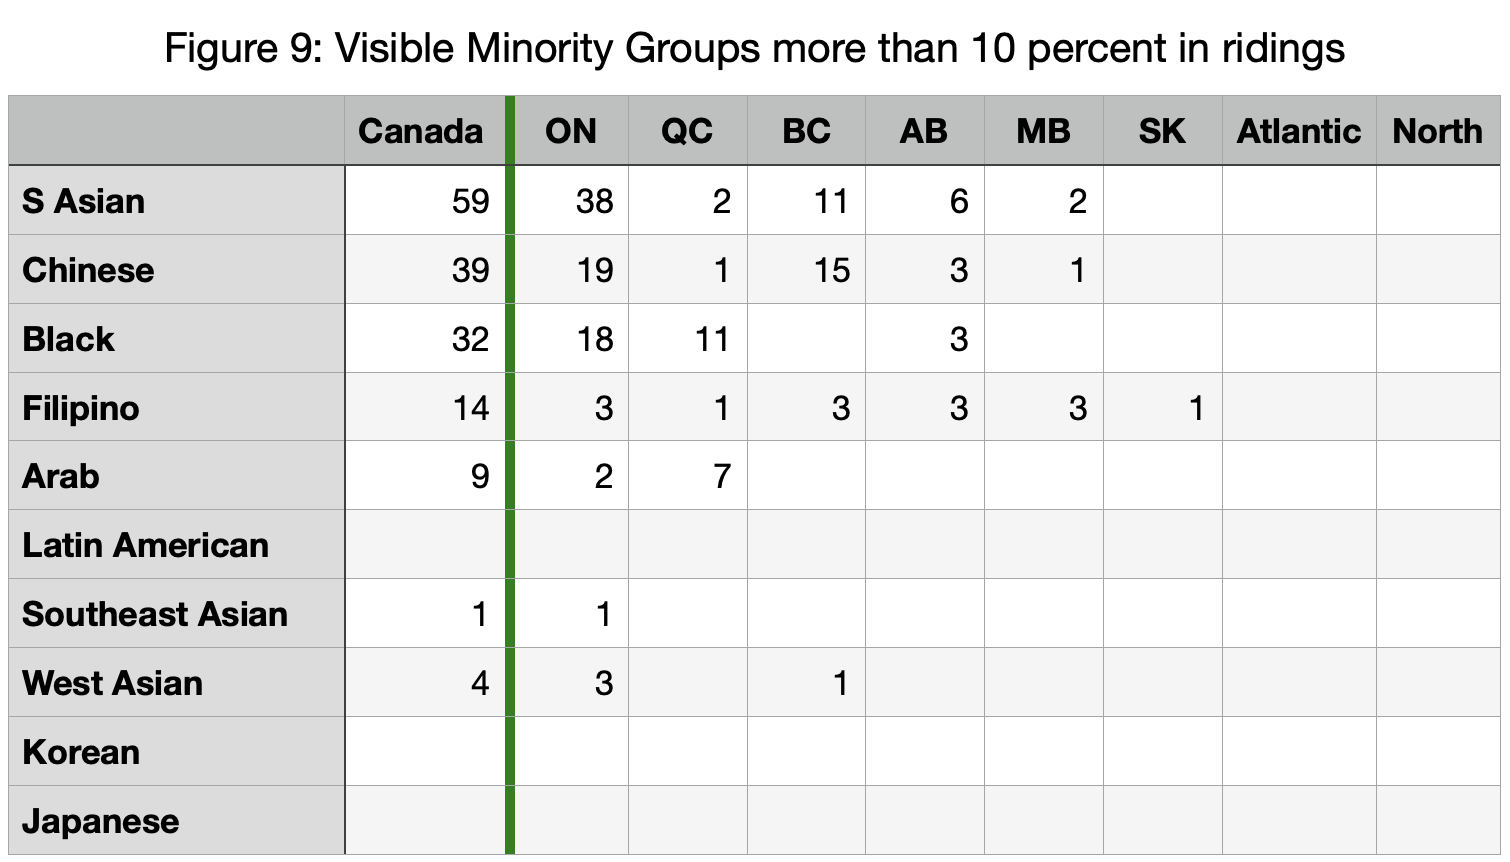
Turning to the political aspect and voter targeting, Figure 9 highlights the number of ridings where a visible minority group forms more than 10 percent of the population, broken down by province, again demonstrating the extent to which political parties need to address specific group concerns. Only Latin American, Korean and Japanese have no ridings with ten percent or more of the population; however, with a threshold of five percent, only Japanese have no ridings of significant concentration. Regionally, there are no ridings in Atlantic Canada and the North with one visible minority group forming 10 percent of the population but six ridings where one group forms more than five percent: three South Asian, two Black and one Chinese.
Figure 10 highlights the 190 ridings where a religious minority forms more than five percent of the population as a threshold of ten percent would exclude Buddhist and Indigenous spirituality. Most groups are concentrated in a number of ridings, with Muslims dispersed across the greatest number of ridings.
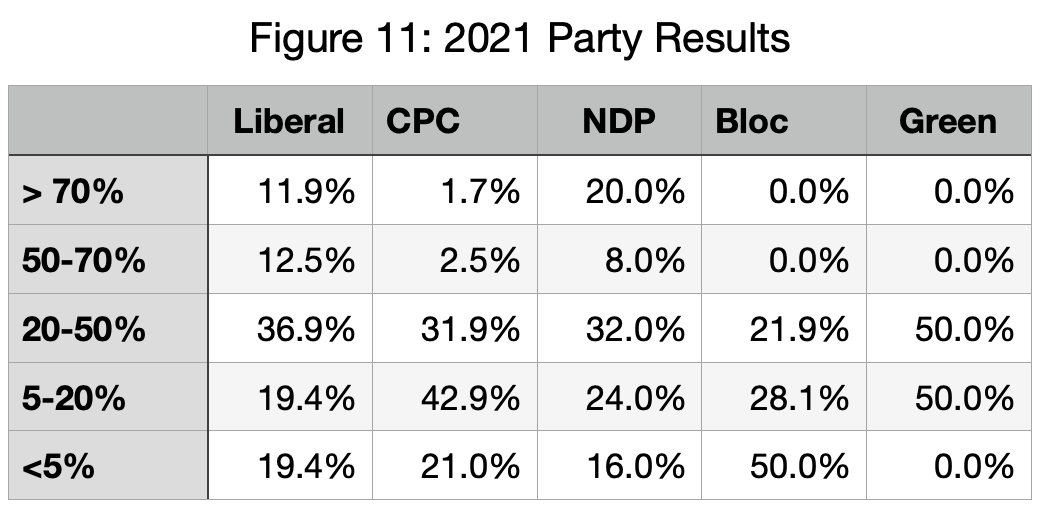
Figure 11 breaks down the 2021 election results, highlighting the relative strength of the Liberals and NDP in visible minority majority urban ridings and the relative strength of the Conservatives in ridings with between five and twenty percent visible minorities. Compared to the 2015 election, the biggest change was the increase in the relative share of NDP MPs in visible minority majority ridings and the Conservative and Bloc relative share increase in ridings with between 20 to 50 percent visible minorities. These ridings can flip; in 2011, the Conservatives won a majority of ridings with more than 50 percent visible minorities.
But in general, visible minority voters are more affected by overall campaign themes and issues, whether these be with respect to campaign tone, general concerns regarding the economy, housing, and healthcare, and largely follow the overall electoral trend at national and regional levels.
Riding characteristics impact upon voting patterns. Visible minority majority ridings have lower incomes and higher unemployment which generally play to left and left-of-centre parties. Similarly, larger family size and more multigenerational households in these ridings suggest that political parties target their messaging accordingly.
No major party is arguing against increased immigration, nor is any province except for Quebec. Public support is strong. Apart from administrative issues like backlogs and poor Immigration, Refugees and Citizenship Canada service, debates and discussion focus more on the practicalities and impact of immigration on housing affordability, healthcare stresses and infrastructure gaps. More recent commentaries are focussing on these negative impacts but in a non-xenophobic manner. After all, these issues affect immigrants and non-immigrants alike, helping to reduce polarization.
Methodology:
All data is from the Census profile given that it provides riding-level data. Indicators were chosen based on their pertinence. Non-founding ethnic ancestry includes all groups save for English, Scottish, Irish, Welsh, Canadian, French and Indigenous (Census allows for multiple responses). Electoral results data is from Elections Canada.
Canada’s urban areas recently experienced their strongest population growth in at least two decades, after a weak expansion during the early stages of the pandemic.
Over the year ending July 1, 2022, the country’s census metropolitan areas (CMAs) grew 2.1 per cent – about 574,000 people – according to Statistics Canada estimates published Wednesday. That was the strongest pace of annual growth since the agency began publishing such figures in 2001.
It was a comeback of sorts for urban regions, which had grown just 0.5 per cent the previous year, lagging the growth in rural areas. The pandemic and its accompanying border restrictions led to a dramatic decline in immigration to Canada, while many urban residents decamped to smaller communities.
But as restrictions eased, immigration surged to record levels, helping drive most of the population increase in urban areas. Sixteen CMAs notched their strongest annual growth on record.
At the same time, some major cities are still seeing plenty of residents leave. The Toronto region, for one, is losing significantly more people to other parts of Canada than it is bringing in. Over the past year, its population growth was entirely driven by international migration, which includes permanent residents and foreign students.
Several economists tie the exodus to worsening home affordability, along with the rise of remote work. And as homes have gotten pricier in suburbs and exurbs, buyers are looking even further afield.
“This is not like 50 years ago, when people were leaving downtown Toronto and moving to Etobicoke,” said Mike Moffatt, the founding director of the PLACE Centre think tank, referring to the former suburb that is now part of the city of Toronto. “This is people moving to London or Moncton or basically outside of the economic region. So there is a fundamental difference.”
Indeed, Atlantic Canada is experiencing a boom. Moncton’s population rose 5.4 per cent over the year ending July 1, 2022, the most of any CMA. Halifax was the next highest, at 4.5 per cent. Charlottetown grew 4.2 per cent.
There was breadth to the expansion, too. The Calgary area grew 3.2 per cent, or roughly 50,000 people, its strongest pace since the mid-2000s. The Vancouver area added 2.8 per cent to its population. The populations of Barrie and London, Ont., rose 3.2 per cent and 3 per cent, respectively.
The Toronto region did grow – by 2.1 per cent, or more than 138,000 people. However, it saw a net intraprovincial loss of roughly 78,000 – which means that many more people left for other parts of Ontario than moved in. It was the most on record, and the outflow has accelerated in recent years, alongside rising home prices and rents. There has been a spike in the number of children leaving the city, suggesting that young families are getting priced out of the housing market and are looking elsewhere for properties.
The Montreal and Vancouver areas also saw net intraprovincial losses of about 29,500 and 14,300 people, respectively, over the past year. Over all, Montreal’s population grew just 0.9 per cent, outpacing only Thunder Bay (0.2 per cent) among CMAs.
Toronto is also losing people to other provinces. The region saw a net interprovincial outflow of roughly 21,400 residents, more than double the previous record for departures.
Mr. Moffatt said the concern is that cities such as Toronto will suffer a “hollowing out” of their middle classes, who can no longer afford to live there. This has implications for the labour market, he said, as many crucial workers – such as teachers and nurses – are forced to relocate.
“You basically have two extremes, where fairly wealthy and older households can make it work, then you have young students and people starting their careers who are sharing apartments,” he said.
On the flip side, the Calgary area swung to a net interprovincial gain of residents in what amounted to the largest inflow of people since the oil price collapse of 2014 to 2016.
Similarly, Halifax is drawing large numbers of people from outside Nova Scotia. The CMA notched a net interprovincial inflow of more than 8,000 people, a figure that has been rising steadily for years.
Brigitte Teleu, a local real estate agent, said upward of 30 per cent of her clients recently have been out-of-province buyers. Like much of the Maritimes, Halifax saw home prices surge during the boom period of 2020 and 2021.
“Our prices are still relatively low, even now, compared to the rest of Canada,” she said. “A lot of people are selling their homes in Toronto, and they have all the money to spare and they just buy a house upfront in cash.”
Canada is struggling to build enough homes for its rapidly growing population, especially with higher interest rates, which make construction costlier and qualifying for a mortgage even more difficult. The federal government, meanwhile, is pursuing record levels of immigration in the coming years, adding more demand for homes in short supply.
“I think we’re going to have an escalation of the current trends, where our cities are growing but at the same time we are losing a lot of young professionals to Alberta and Atlantic Canada” from Ontario, Mr. Moffatt said.
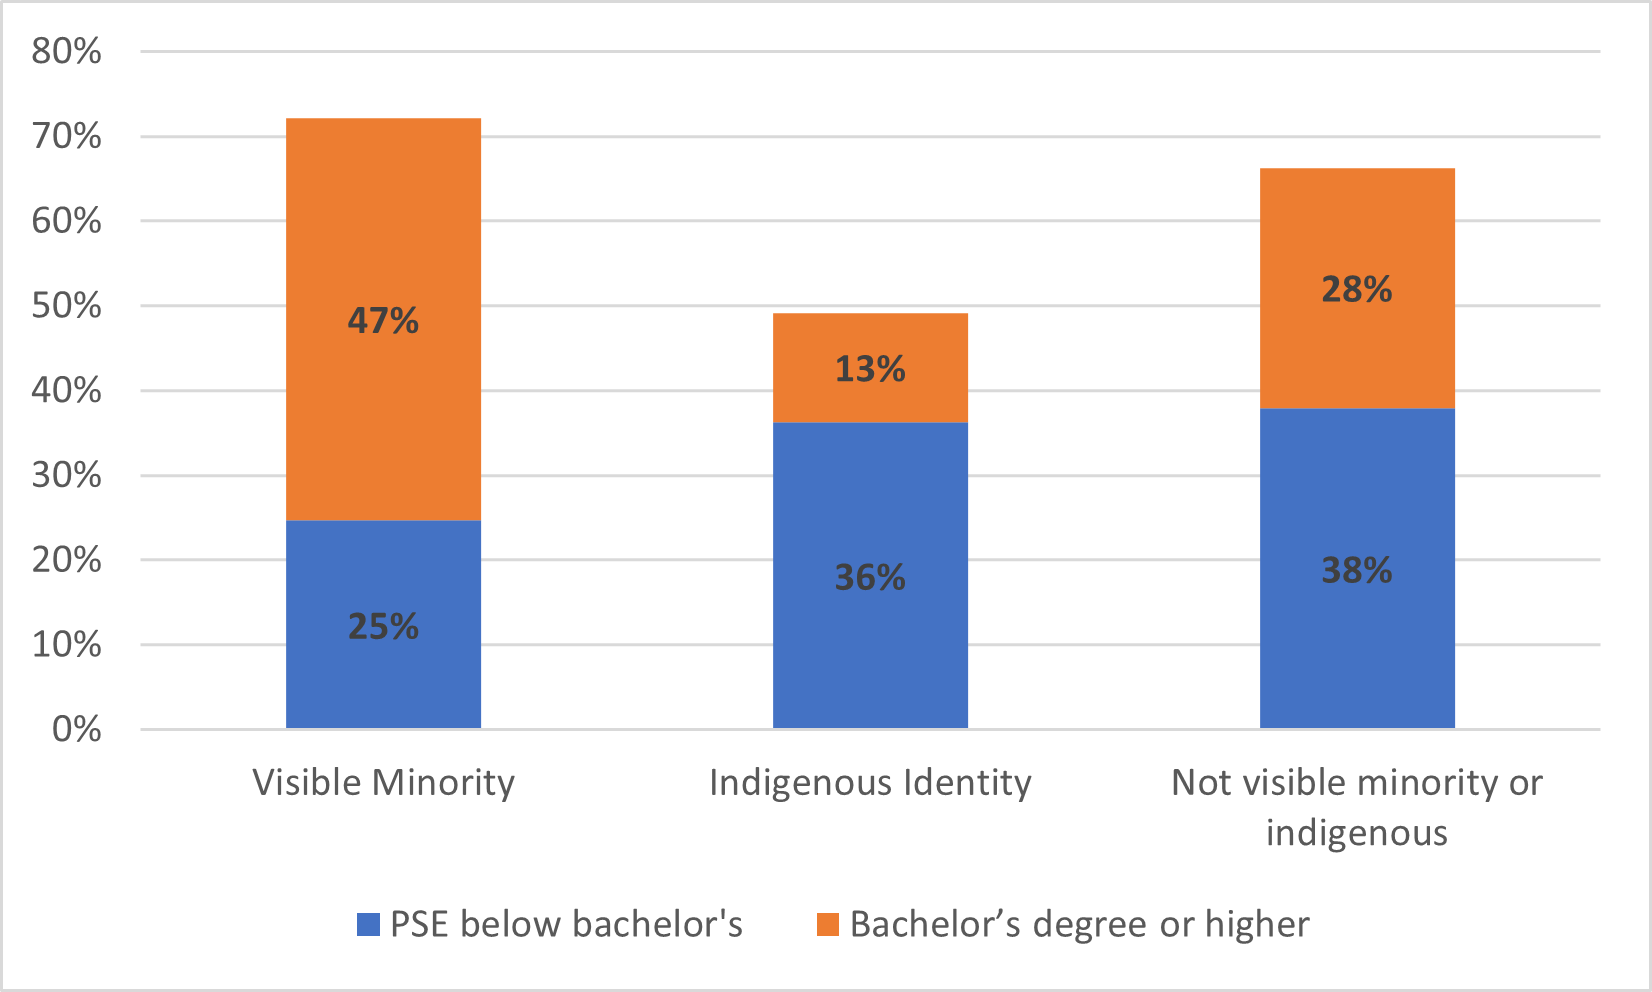
Figure 1 shows the attainment rates of the population aged 25-64, by visible minority status and Indigenous identity. What it shows is that there are some quite fascinating differences in attainment rates across different segments of the population. Individuals who self-declare as visible minorities are somewhat less likely than other Canadian to have a PSE credential below the bachelor’s level but substantially more likely to have a degree at the bachelor’s level or above. Those reporting Indigenous identity, meanwhile, have college credentials at higher levels similar to those of non-visible minority/non-Indigenous Canadians, but university attainment rates substantially lower than those of other Canadians. White Canadians have higher college attainment rates than visible minorities, but substantially lower university attainment rates.
Figure 1: Post-Secondary Education Attainment by Level, Visible Minority Status and Indigenous Identity, Canadians Aged 25-64, Census 2021
This is, by the way, quite different from the situation in basically any other developed country except perhaps Australia and New Zealand; in most other countries with large scale immigration, visible minority populations tend to have much lower levels of education that the mainstream population.
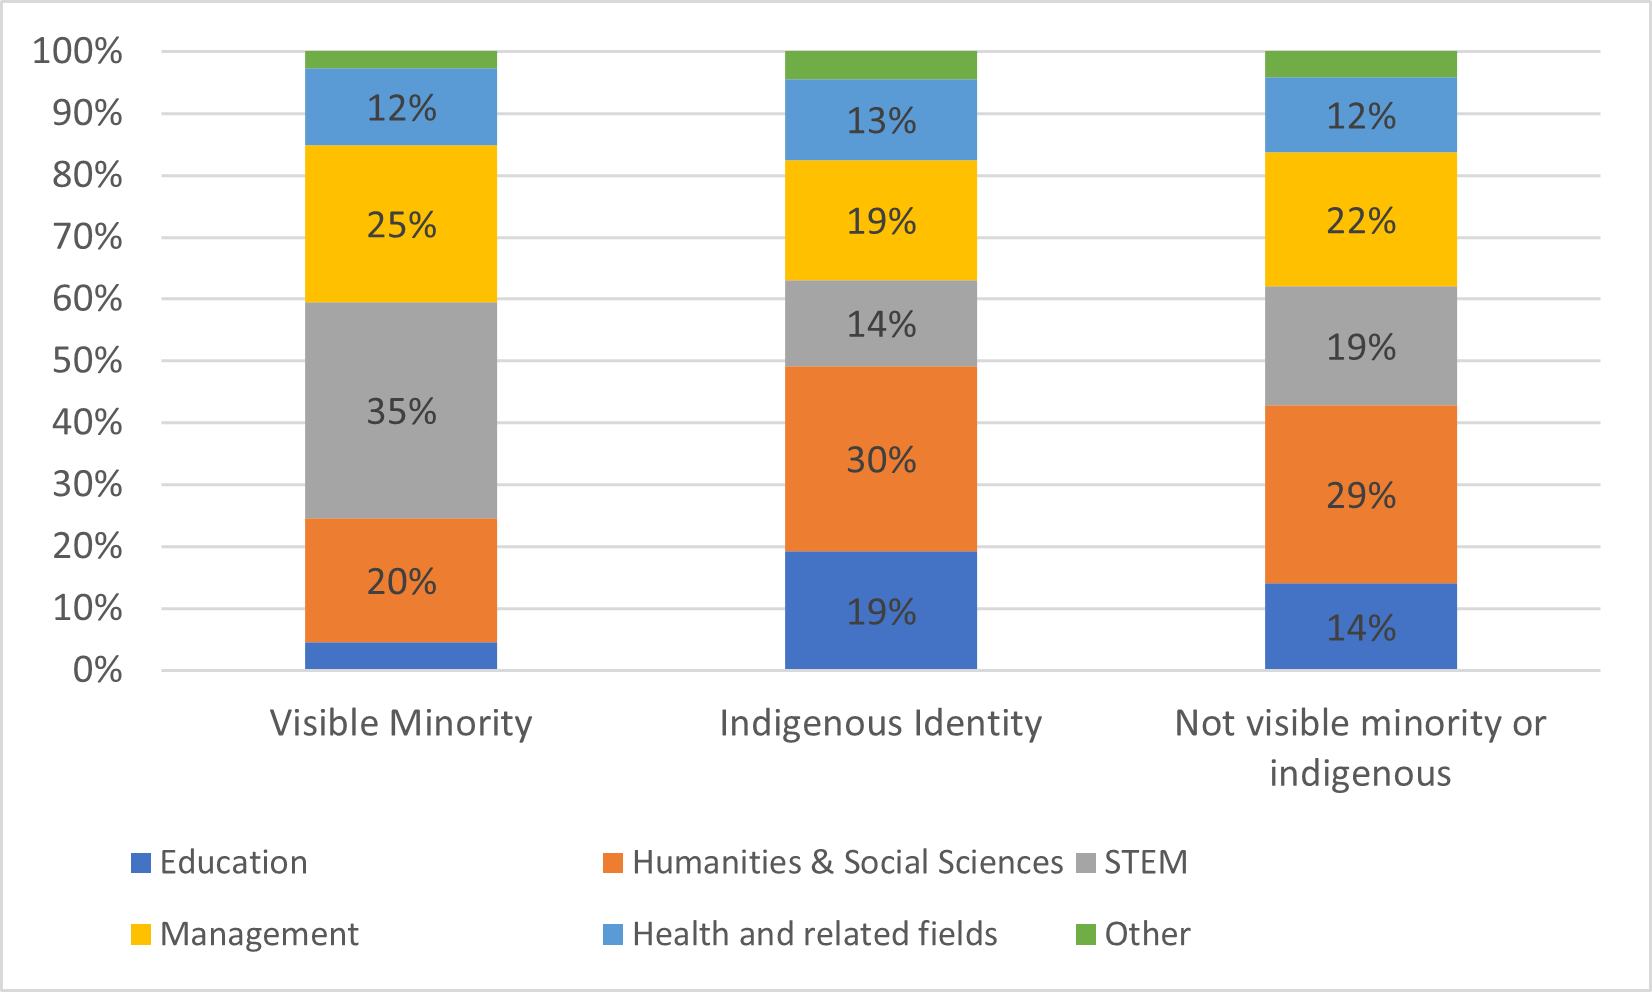
One of the interesting things about this census is that it permits analysis not just by level of education but also by field of study. Figure 2 runs the same analysis as figure 1, only examining the distribution of undergraduate degrees. Again, we see some interesting distributions by visible minority/Indigenous identity. The proportions of Canadians of various backgrounds who are in the fields of health and business are relatively consistent, but there are huge differences in the areas of education, social sciences/humanities and STEM. For those with Indigenous identities, 45% of all degrees are in education, humanities and social sciences, while only 14% of all degrees are in STEM; among visible minorities (who, recall, are more than 3 times as likely to have a degree as those with Indigenous identity), it is 25% in education, humanities and social sciences and 35% in STEM. Figure 2: Distribution of Degrees by Broad Field, Visible Minority Status and Indigenous Identity, Canadians Aged 25-64, Census 2021
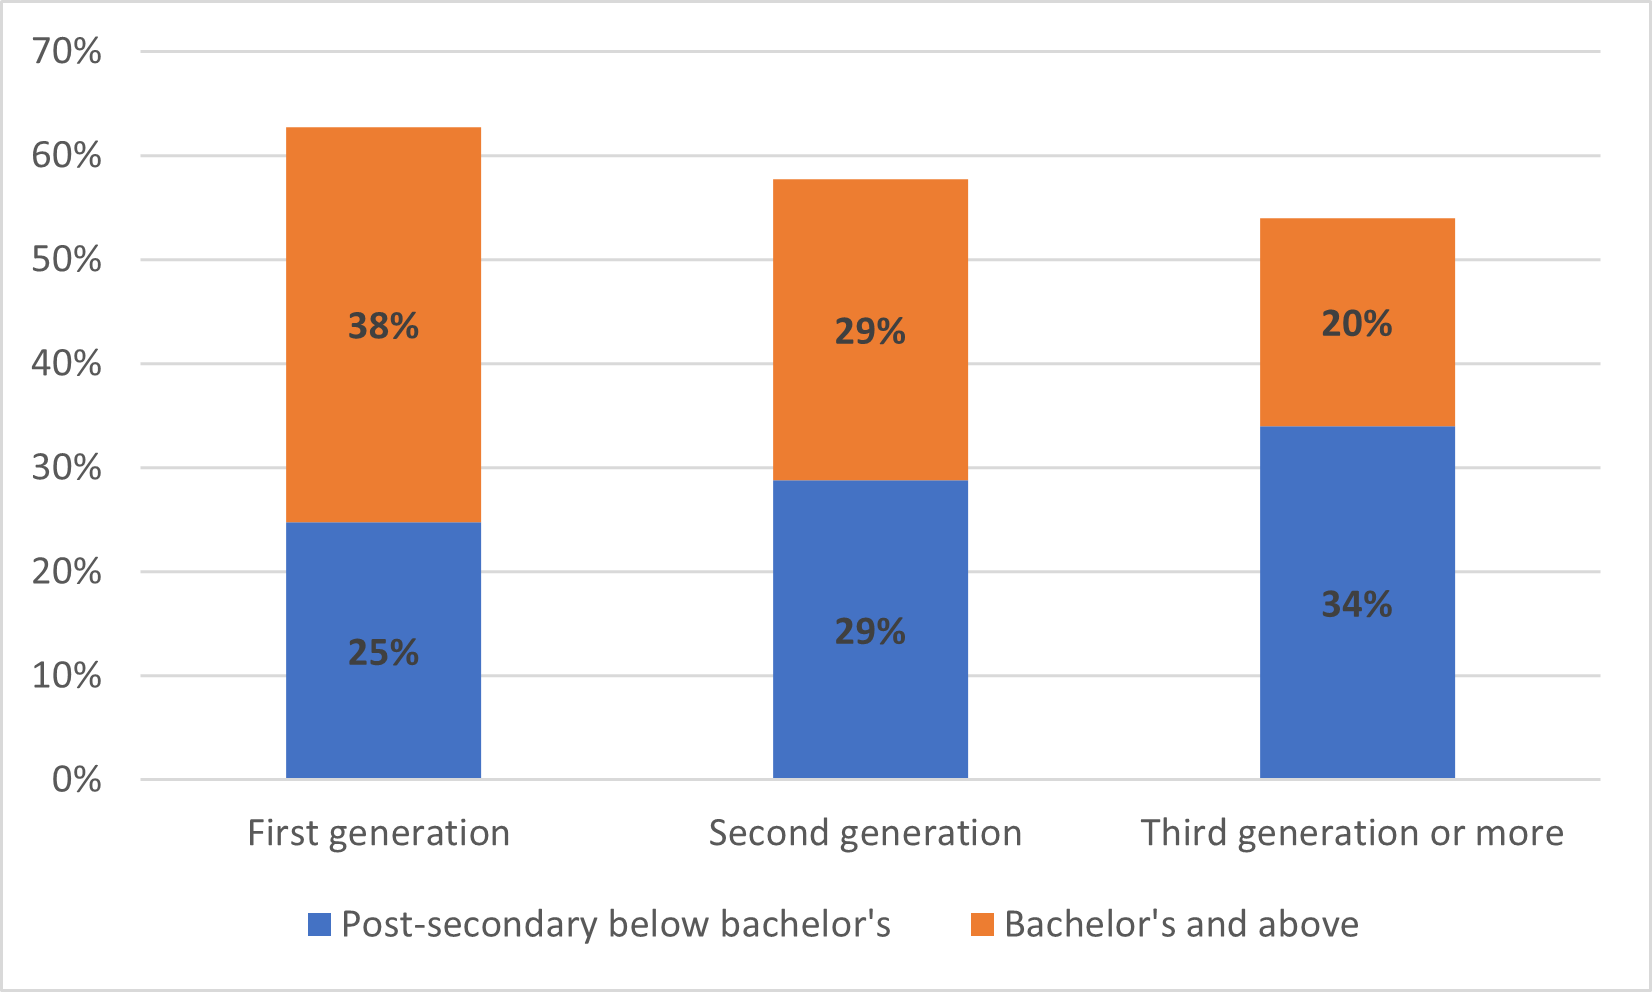
We can run the same kind of analyses by immigration status. In figures 3 and 4, we repeat the analysis in figures 1 and 2, only by immigration status. Statistics Canada divides Canadians into “first generation” (basically, individuals born outside Canada), “second generation” (at least one parent born outside Canada) and “third generation or more” (both parents born in Canada). That second category is – if you ask me – a heck of a hodge-podge, so focus on the difference between first and third generations.
Figure 3: Post-Secondary Education Attainment by Level and Immigration Generation, Canadians Aged 25-64, Census 2021
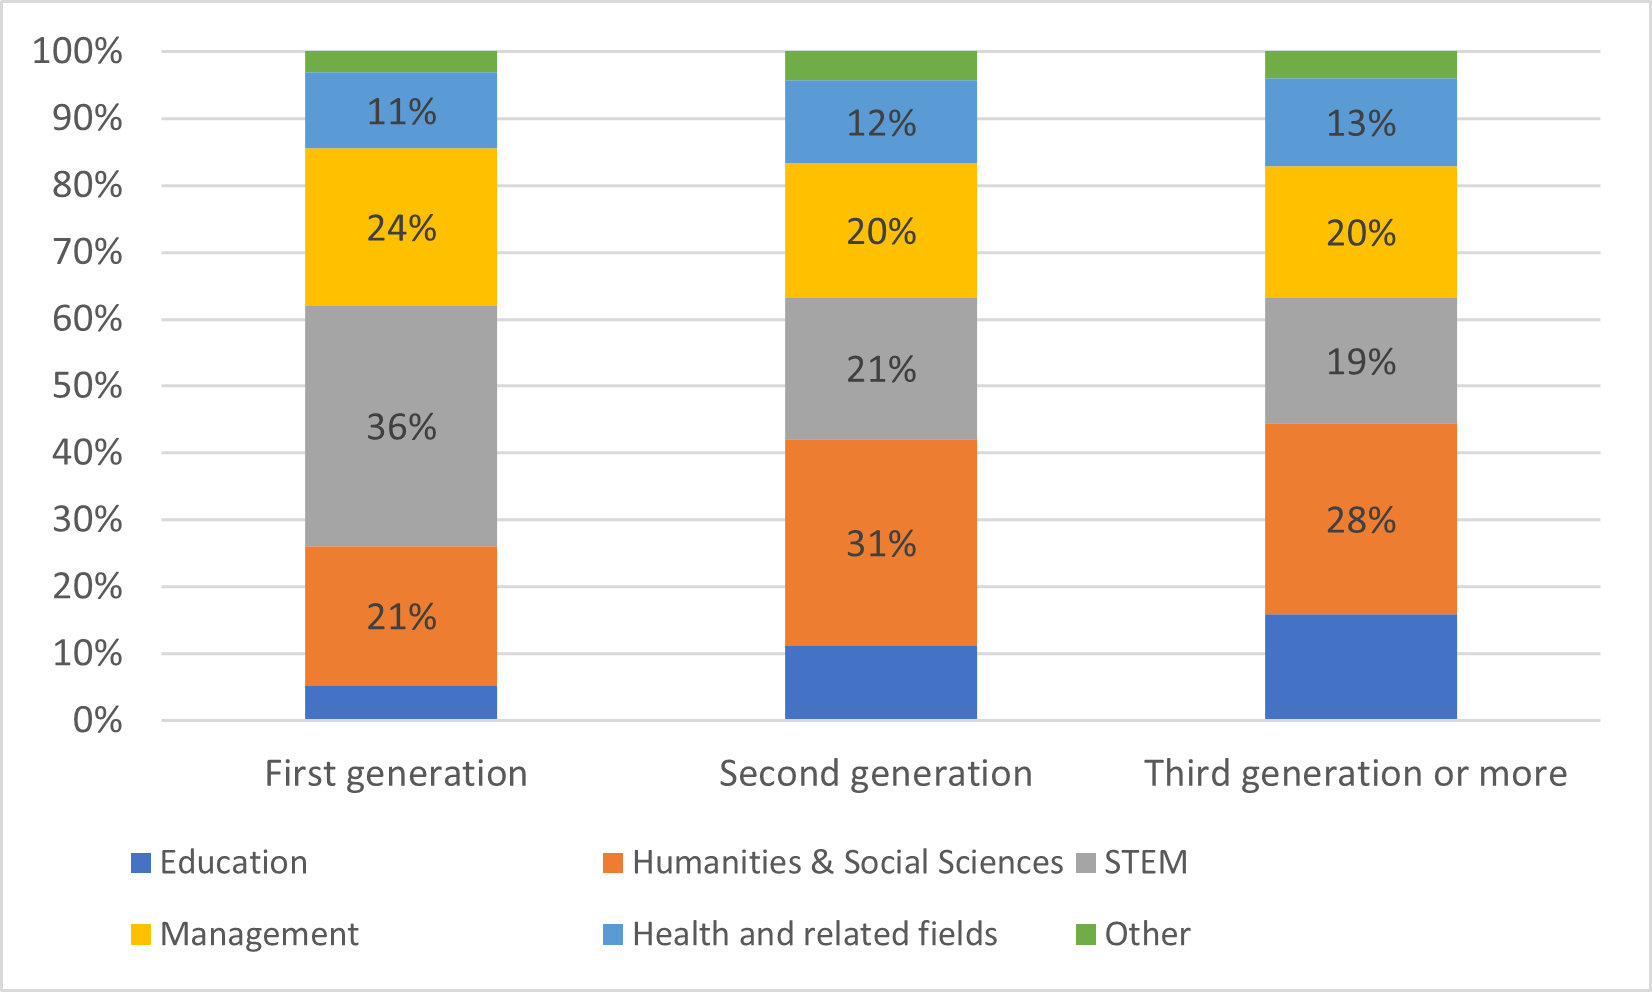
Figure 4: Distribution of Degrees by Broad Field and by Immigration Generation, Canadians Aged 25-64 Census 2021
There’s an old (American) cliche about how the first generation of immigrant families works hard in menial jobs to make sure their kids get ahead, the second generation works hard to get into professional schools and attract great wealth while the third generation goes to art school. By the looks of it, Canada’s points-based immigration system allows us to skip that first generation thus bringing immigrants into humanities and arts programs that much faster.
From the last data release of the census, with evidence of mismatches between immigration skills and occcupation:
Canada continues to rank first in the G7 for the share of working-age people (aged 25 to 64) with a college or university credential (57.5%). A key factor in this is Canada’s strong college sector: nearly one in four working-age people (24.6%) had a college certificate or diploma or similar credential in 2021, more than in any other G7 country.
From 2016 to 2021, the working-age population saw an increase of nearly one-fifth (+19.1%) in the number of people with a bachelor’s degree or higher, including even larger rises in degree holders in the fields of health care (+24.1%) and computer and information science (+46.3%).
Recent immigrants made up nearly half of the growth in the share of Canadians with a bachelor’s degree or higher. However, some immigrants’ talents remain underutilized, as over one-quarter of all immigrants with foreign degrees were working in jobs that require, at most, a high school diploma. This is twice as high as the overqualification rate for Canadian-born or Canadian-educated degree holders.
Even foreign-educated immigrants with credentials in high-demand areas such as health care faced high rates of job mismatch: 36.5% of immigrants with a foreign degree in registered nursing worked as registered nurses or in closely related occupations, and 41.1% of immigrants with foreign medical degrees worked as doctors. This compares with job match rates of approximately 9 in 10 for the population with Canadian nursing (87.4%) or medical (90.1%) degrees.
The share of Canadian-born young adults (aged 25 to 34) with a bachelor’s degree or higher is also rising (+2.7 percentage points from 2016 to 2021). The increase was larger among Canadian-born young women (+3.3 percentage points, reaching 39.7%) than Canadian-born young men (+2.2 percentage points, reaching 25.7%). Nonetheless, among young men the increase in this 5-year period from 2016 to 2021 was nearly as large as the increase during the 10-year period from 2006 to 2016 (+2.3 percentage points).
Educational gaps faced by First Nations people, Métis and Inuit are narrowing at the high school level. In 2021, over half of Inuit aged 25 to 64 had completed high school, up from 45.4% in 2016. At the same time, gaps are widening at the level of a bachelor’s degree or higher for all Indigenous groups.
People with credentials above the bachelor level were better able to weather the labour market shocks of the pandemic, partly due to working in industries that were more suited to remote work. They had higher employment rates and earnings in 2021 than 2016, while those with most other levels of education saw lower employment rates.
Of particular interest to me were the following elements:
Numbers of Canadian citizens born abroad: 322,530. This number quantifies those who will be impacted by the first generation cut-off introduced by the Conservative government in 2009 and thus not able to pass on their Canadian citizenship to their children. This is currently being challenged in court with profiles of families affected. IMO, the previous retention provisions were virtually impossible to administer consistently and efficiently, and the first generation cut-off is preferable.
Naturalization rate:
“Among all eligible immigrants admitted to Canada at least four years before a census year, 83.1% or just over 6.0 million immigrants reported Canadian citizenship in the 2021 census, while a larger proportion of the immigrant population reported Canadian citizenship in 2016 (85.8%) and 2011 (87.8%).”
Yet IRCC continues to use, in its annual reporting, the percentage of all immigrants, no matter whether they arrived five or 50 years ago, as its benchmark. Totally irrelevant to measuring IRCC’s performance. As I continue to argue, IRCC needs to set performance standards with respect to recent immigrants, based on the previous census period (essentially the approach StatCan uses).
Improved data on dual citizenship: The change from a simple question regarding dual citizenship to a more complex two-step set of questions has resulted in an increase in the number reporting dual citizenship. The results of this change:
“In 2021, 11.2% or 3.7 million Canadian citizens reported more than one country of citizenship. This was over double the number reported in 2016, when 4.5% or 1.4 million of all Canadian citizens identified as having more than one citizenship.”
I will be doing a more comprehensive analysis of 2021 Census citizenship data over the coming months, updating my analysis of the 2016 Census (What the census tells us about citizenship):
More than 450 ethnic or cultural origins were reported in the 2021 Census. The top origins reported by Canada’s population, alone or with other origins, were “Canadian” (5.7 million people), “English” (5.3 million), “Irish” (4.4 million), “Scottish” (4.4 million) and “French” (4.0 million).
In 2021, over 19.3 million people reported a Christian religion, representing just over half of the Canadian population (53.3%). However, this proportion is down from 67.3% in 2011 and 77.1% in 2001.
Approximately 12.6 million people, or more than one-third of Canada’s population, reported having no religious affiliation. The proportion of this population has more than doubled in 20 years, going from 16.5% in 2001 to 34.6% in 2021.
While small, the proportion of Canada’s population who reported being Muslim, Hindu or Sikh has more than doubled in 20 years. From 2001 to 2021, these shares rose from 2.0% to 4.9% for Muslims, from 1.0% to 2.3% for Hindus and from 0.9% to 2.1% for Sikhs.
Racialized groups in Canada are all experiencing growth. In 2021, South Asian (7.1%), Chinese (4.7%) and Black (4.3%) people together represented 16.1% of Canada’s total population.
The portrait of racialized groups varies across regions. For example, the South Asian, Chinese and Black populations are the largest groups in Ontario, while the largest groups are Black and Arab people in Quebec, Chinese and South Asians in British Columbia, and South Asians and Filipinos in the Prairies.
Highlights from StatsCan on the 2021 Census (starting to work though the data tables for further analysis):
Almost one in four people (23.0%) counted during the 2021 Census are or have been a landed immigrant or permanent resident in Canada. This was the highest proportion since Confederation, topping the previous record of 22.3% in 1921, and the largest proportion among G7 countries.
Just over 1.3 million new immigrants settled permanently in Canada from 2016 to 2021, the highest number of recent immigrants recorded in a Canadian census.
The share of recent immigrants settling in Atlantic Canada almost tripled in 15 years, rising from 1.2% in 2006 to 3.5% in 2021.
Over half of recent immigrants living in Canada were admitted under the economic category. Of these 748,120 economic immigrants, just over one-third (34.5%) were selected through skilled worker programs and another one-third (33.6%) through the Provincial Nominee Program.
The proportion of immigrants who first came to Canada temporarily on work or study permits or as asylum claimants before being admitted as permanent residents was especially high among recent immigrants who settled since 2016 (36.6%).
Asia, including the Middle East, remained the continent of birth for most recent immigrants (62.0%).
Almost one in five recent immigrants (18.6%) were born in India, making it the leading country of birth for recent immigration to Canada.
In contrast, the share of recent immigrants from Europe continued to decline, falling from 61.6% in 1971 to 10.1% in 2021.
The vast majority (92.7%) of recent immigrants are able to conduct a conversation in either English or French.
The share of second-generation Canadians (children of immigrants) younger than 15 years with at least one foreign-born parent rose from 26.7% in 2011 to 31.5% in 2021.
Overly dramatic header but as we see in initial reactions in Quebec, recent action/inaction by the federal government, and the ever increasing gap between immigration to English Canada compared to Quebec, the trendline is not encouraging:
Statistics Canada surely did not time the release of language data from the 2021 Census to coincide with the launch of an election campaign in Quebec. But its publication of findings that confirm the decline of French within the province and across Canada are sure to light a fuse on the campaign trail as Premier François Legault calls for Ottawa to cede more powers to Quebec.
Neither did the federal agency likely consider the optics of releasing its report on the heels of the Aug. 15 Fête nationale de l’Acadie, the annual celebration of francophones in Atlantic Canada that marks the 1755 expulsion of thousands of their ancestors from the region by the British. Many ended up in Louisiana, where the French-language is today spoken by only a tiny minority of their descendants.
In May, as he revealed plans to seek full control over immigration policy if his Coalition Avenir Québec wins the Oct. 3 election, Mr. Legault warned that Quebec runs the risk of becoming another Louisiana without the ability to choose its own immigrants, including those who come to Quebec through the federal family reunification program. “It is a question of survival for our nation,” he said then.
Statistics Canada’s Wednesday report, showing that more newcomers to Quebec are using English as their first official language, will only serve to buttress Mr. Legault’s argument. The proportion of Quebeckers who primarily spoke English rose to 13 per cent in 2021 from 12 per cent in 2016, topping the one-million mark for the first time. The share who spoke predominantly French at home fell to 77.5 per cent from 79 per cent, despite extensive government efforts to “francize” new immigrants.
More than 70 per cent of Quebeckers who speak English as their first official language live on the Island of Montreal or in the suburban Montérégie region. The concentration of English speakers in and around the Quebec metropolis has long created linguistic tensions. Protecting Montreal’s “French face” is seen as imperative by most francophone Quebeckers, but many allophone newcomers to the city still gravitate toward English, sometimes even after attending French public schools.
And as Montreal goes, many fear, so goes the province. Which is why Bill 96 – the law adopted by Mr. Legault’s government in June that caps enrolment in English-language junior colleges among dozens of other measures aimed at protecting French – is seen by many francophones as a strict minimum.
Across Canada, French has been on the decline for decades despite Liberal prime minister Pierre Trudeau’s government adoption of the Official Languages Act in 1969. In 1971, French was the first official language spoken by 27.2 per cent of Canadians. By 2016, the proportion had declined to 22.2 per cent. In 2021, it fell again to 21.4 per cent. Where will it stand in 2026? You don’t need a PhD to figure it out.
The dream of a bilingual Canada d’un océan à l’autre may never have been more than that. But the reduction of French to folkloric status everywhere outside Quebec and in pockets of New Brunswick and Northern Ontario is the writing on the wall. Between 2016 and 2021, the proportion of the population speaking French at home declined in every region of the country except Yukon, where it rose to 2.6 per cent from 2.4 per cent. In New Brunswick, Canada’s only officially bilingual province, the share speaking French at home fell to 26.4 per cent from 28 per cent.
It may be fashionable among English-Canadian elites to enrol their kids in French immersion classes. But anemic rates of bilingualism hors Quebec and New Brunswick speak for themselves. Outside Quebec, Canadians who claimed an ability to conduct a conversation in both official languages dropped to 9.5 per cent from 9.8 per cent and down from a peak of 10.1 per cent two decades ago.
Even the federal public service, which once aspired to set an example, no longer prioritizes Canada’s official languages equally. In May, a Radio-Canada report showed that francophones are underrepresented in the upper echelons of the federal bureaucracy. Now, there is a push to waive French-English bilingualism requirements if applicants speak an Indigenous language or aspire to.
Removing barriers to career advancement faced by Indigenous people in Canada is a legitimate objective. But francophones argue it should not mean the diminution of the status of French within the public service. They worry that the appointment of Mary Simon as Governor-General, despite her inability to speak French, paves the way for more such nominations. They are not wrong to worry.
The latest census figures will exacerbate feelings of linguistic insecurity among francophone Quebeckers in particular. There will be consequences. We may witness a few of them on the campaign trail.