Canadian Immigration Tracker First Quarter 2025

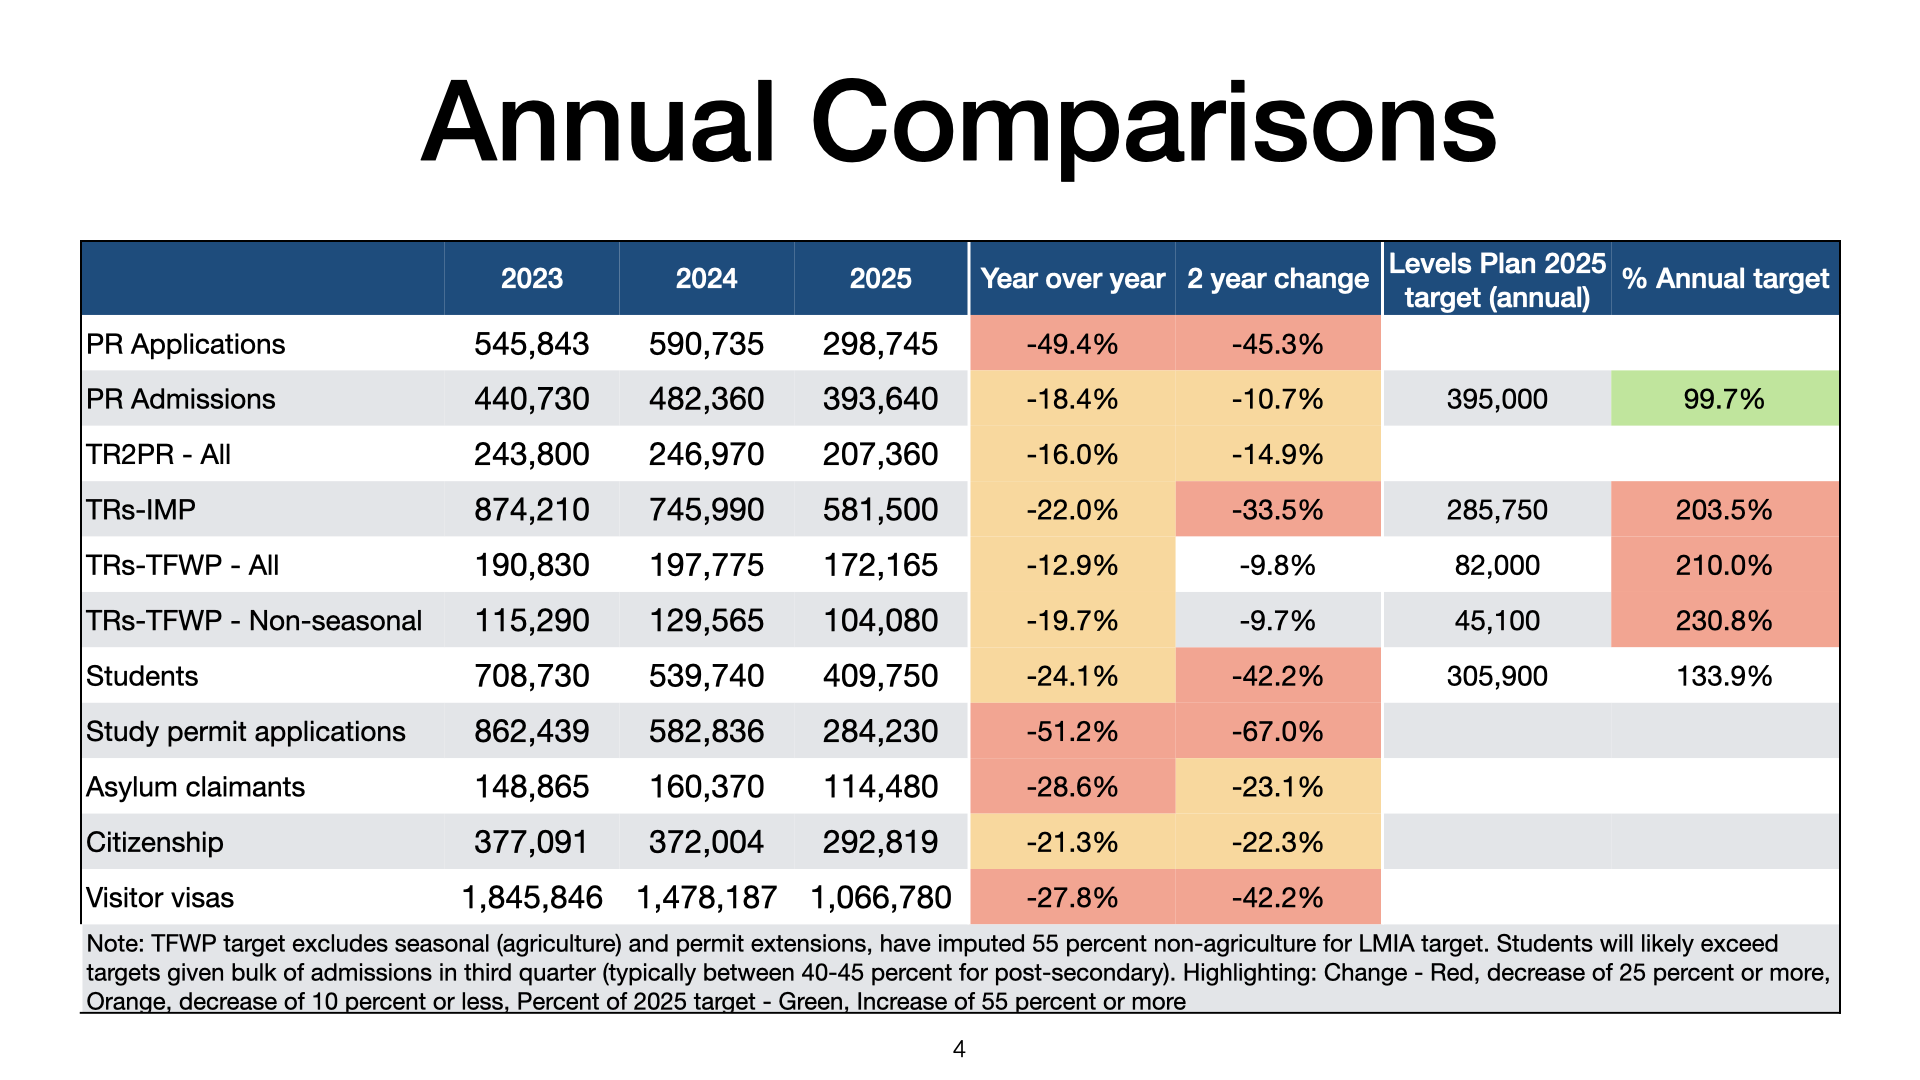
My regular update on key immigration programs. Given the various articles on whether or not the government is meeting the reductions announced earlier, here is where we stand for January to June for the current and previous two years:

Permanent residents admissions: From 255,015 in 2024 to 207,510 in 2025, decline 18.6 percent, (from 2023, decline 21 percent), about 50 percent of 2025 target  

TR2PR (Those already in Canada): From 148,020 in 2024 to 126,365 in 2025, decline of 14.6 percent (from 2023, decline 13 percent). 

TRs-IMP: From 420,070 in 2024 to 295,505 in 2025, decline of 29.7 percent (from 2023, decline 23.4 percent), already exceeds 2025 target

TRs-TFWP: From 110,910 in 2024 to 106,105 in 2025, decline of 4.3 percent (from 2023, decline 7.2 percent), already exceeds 2025 target for both agriculture and non-agriculture workers

Students: From 248,820 in 2024 to 152,775 in 2025, decline of 38.6 percent (from 2023, increase 26.1 percent), about 50 percent of 2025 target (likely to overshoot given third quarter has highest number of admissions (between 40-45 percent for post-secondary albeit only 34 percent in 2024)

Asylum Claimants: From 93,315 in 2024 to 57,810 in 2025, decline of 38 percent (from 2023, decline 3.7 percent)

Citizenship: From 205,363 in 2024 to 151,804 in 2025, decline of 26.1 percent (from 2023, decline 14.2 percent)

Visitor Visas: From 868,234 in 2024 to 568,195, decline of 34.6 percent (from 2023, decline 40.5 percent)

Canadian Immigration Tracker First Quarter 2025

My regular update on key immigration programs, now being updated on a quarterly basis.

Impact of government caps and restrictions can be seen for temporary workers and international students, with levelling off of new permanent residents.

Ministerial mandate letter and related public statements indicate that government likely to maintain current limits and levels until 2027.

This year’s levels plan, which will likely include temporary residents as was the case for last year, will provide confirmation of the government’s intention.

As usual, slide 3 highlights the changes by program.

Canadian Immigration Tracker – December 2024 update and full-year comparisons

Full Year 2024 annual comparisons

  • Permanent residents admissions: From 449,00 in 2023 to 482,000 in 2024 or 7.3 percent.   
  • TR2PR (Those already in Canada): From 244,000 in 2023 to 247,000 in 2024 or 1.3 percent. 
  • TRs-IMP: From 874,000 in 2023 to 746,000 in 2024 or -14.7 percent. Significant decrease in PGWP and spouses
  • TRs-TFWP: From 191,000 in 2023 to 198,000 in 2024 or 3.6 percent.
  • Students: From 709,000 in 2023 to 540,000 in 2024 or -28.9 percent. Post-secondary only: Decline from 544,000 to 387,000 or 23.9 percent.
  • Asylum Claimants: From 149,000 in 2023 to 175,000 in 2024 or 17.5 percent.
  • Citizenship: From 377,000 in 2023 to 372,000 in 2024 or -1.3 percent.
  • Visitor Visas: From 1,846,000 in 2023 to 1,478,000 in 2024 or -19.9 percent.
  • Note settlement services and citizenship application numbers for 2024 requested and will post when received.

Canadian Immigration Tracker – December 2024 update and full-year comparisons

Five years on, Chinese Canadians recall ridicule and racism over pandemic precautions

Another reminder. One of my memories was flying back from LA late January 2020 and we and Chinese were the only ones wearing a mask:

…Once the pandemic was officially underway, data would eventually emerge suggesting caution in Chinese communities had yielded results, notably in the Metro Vancouver community of Richmond, B.C.

The city’s population is 54 per cent ethnically Chinese, according to the 2021 census, making it the most Chinese city in North America.

More than two years into the pandemic, British Columbia’s COVID-19 case distribution report in July 2022 showed the city had an infection rate by far the lowest in the Lower Mainland, and less than half of that in nearby Surrey. In a colour-coded infection heat map from that time, Richmond stands out as a pale island, surrounded by more heavily infected neighbouring municipalities.

Zhang says he has no doubt why Richmond’s COVID-19 numbers were so low before the virus mutated and new variants resulted in much higher rate of spread worldwide.

“I believe the COVID-19 cases in the Chinese community were the lowest since we paid so much attention to the pandemic and we set up systems to protect ourselves from COVID-19,” he said.

Poutanen said the process of making health recommendations against a new, evolving virus was similar to shooting at a moving target.

Health officials in Canada initially recommended against mask use by healthy, asymptomatic individuals. That ran counter to what health officials were saying in China and Hong Kong.

“Initially the thought was (for) symptomatic masking, but general masking was not needed,” Poutanen said of the Canadian response.

“That was partly because the thought was symptomatic spread is predominantly how this was being transmitted, but that changed. I certainly think that no question, masking — the mask mandates and knowledge of what masking can do now — is one of the ongoing infection control measures that we continue to use that is effective.”

Wu and other Chinese community members pointed to memories of the SARS outbreak from 2002 to 2004 in Hong Kong and mainland China, where hundreds of people died, as the dominant factor in their response to COVID-19. SARS also killed more than 40 people in Canada.

Wu still winces at the thought of how she was treated in the earliest days of the COVID-19 pandemic.

“It was just like it happened from yesterday,” Wu said, recalling being “the centre of attention” when she went masked and gloved into a grocery store, other shoppers “rolling their eyes.”…

Source: Five years on, Chinese Canadians recall ridicule and racism over pandemic precautions

Canadian Immigration Tracker – November 2024

Highlights:

  • PR Admissions: Increase from 34,360 in October to 36,820 in November. November year-over-year change (change from 2022 in parentheses): Economic – PNP 25.0% (22.8%), Economic – Federal 38.2% (51.6%), Family 52.4% (84.0%), Refugees -19.3% (-12.6%)
    • Applications: Given time delays in entering application data, am using a six month time lag. Decrease from 54,001 in April to 44,040 in May. May year-over-year change (change from 2020): -10.7% (81.9%).
    • Express Entry and Arrima Invitations to Apply: Decline from 5,507 in November (0 Arrima) to 2,561 in December (0 Arrima). December year-over-year change (change from 2022): -84.2% (23.3%)
    • TR to PRs transition (i.e., those already in Canada): Increase from 13,135 in October (38.2% of all PRs) to 17,390 in November (47.2% of all PRs). November year-over-year change (change from 2022): 65.3% (347.0%)
  • Temporary Residents:
    • TRs/IMP: Decrease from 60,945 in October to 48,560 in November. November year-over-year (change from 2022): Agreements: 29.0% (-30.4%), Canadian Interests: -11.4% (-7.5%), Other IMP Participants -47.7% (105.2%), Not stated -39.8% (-43.4%)
      • IMP by occupation code: not meaningful given only about 10 percent have NOC codes
    • TRs/TFWP: Stable from 11,860 in October to 11,540. November year-over-year change (change from 2022): Caregivers 12.2% (19.6%), Agriculture -1.1% (-20.0%) and Other LMIA 6.3% (32.6%).
    • TRs by occupation code (September, updated quarterly): 39.8% low-wage (D), year-over-year (D) change (change from 2022) 14.0% (157.4%)
  • Students: Decrease from 32,100 in October to 28,470 in November. November year-over-year change (change from 2023): All -3.1% (22.0%), post-secondary -1.4% (22.7%)
    • Applications: Decrease from 40,846 in October to 39,759 in November. November year-over-year change (change from 2021): -53.6% (-49.3%)
    • Web Get a study permit: Increase from 29,396 in October to 51,416 in November. November year-over-year change (change from 2022): -0.1% (-25.0%) (December data not released)
  • Asylum Claimants: Decrease from 14,155 in October to 12,590 in November. November year-over-year change (change from 2022): -22.9% (28.5%)
    • Irregular arrivals (Roxham Road etc): Increase from 62 in October to 79 in November. November year-over-year change (change from 2021): 21.5% (-97.9%).
  • Settlement Services (2023): Increase from 1,941,480 in 2022 to 2,960,330 in 2023 (most recent data, services, not unique clients). 2023 year-over-year (change from 2021): 52.5% (53.3%)
  • Citizenship: Stable from 26,082 in October to 25,234 in November. November year-over-year change (change from 2022): -28.9% (-29.1%)
    • Applications (2023): From 264,231 in 2022 to 317,538 in 2023. 2023 Year-over-year change (change from 2021): 20.2%% (36.3%)
  • Visitor Visas: Stable from 102,304 in October to 100,845 in November. November year-over-year change (change from 2022): -34.2% (-24.9%).

https://www.slideshare.net/slideshow/canadian-immigration-tracker-key-slides-november-2024-pdf/274868539

Canadian Immigration Tracker – October 2024 Update

Year to date highlights:

  • Permanent residents admissions: Increase January-October from 404,000 in 2023 to 413,000 in 2024 or 2.3 percent.   
  • TR2PR (Those already in Canada): Increase January-October from 212,000 in 2023 to 219,000 in 2024 or 3.3 percent. 
  • TRs-IMP: Decrease January-October from 757,000 in 2023 to 648,000 in 2024 or -14.5 percent.
  • TRs-TFWP: Decrease January-October from 172,000 in 2023 to 165,000 in 2024 or -4.0 percent.
  • Students: Decrease January-October from 570,000 in 2023 to 461,000 in 2024 or -19.2 percent. Post-secondary only: Decline from 431,000 to 328,000 or 23.9 percent.
  • Asylum Claimants: Increase January-October from 117,000 in 2023 to 149,000 in 2024 or 27.3 percent.
  • Citizenship: Increase January-October from 317,000 in 2023 to 329,000 in 2024 or 3.7 percent.
  • Visitor Visas: Decrease January-October from 1,567,000 in 2023 to 1,290,000 in 2024 or -17.7 percent.

https://www.slideshare.net/slideshow/canadian-immigration-tracker-october-2024-pdf/274022459

COVID-19 Immigration Effects – September 2024 Third Quarter

Highlights (some data not yet posted on open data)

  • Permanent residents admissions: Increase January-September from 370,000 in 2023 to 379,000 in 2024 or 2.3 percent.   
  • TR2PR (Those already in Canada): Increase January-September from 199,000 in 2023 to 205,000 in 2024 or 3.3 percent. 
  • TRs-IMP: Decrease January-September from 681,000 in 2023 to 584,000 in 2024 or -14.2 percent.
  • TRs-TFWP: Decrease January-September from 160,000 in 2023 to 153,000 in 2024 or -4.0 percent.
  • Students: Decrease January-September from 544,000 in 2023 to 428,000 in 2024 or -21.3 percent. 
  • Asylum Claimants: Increase January-September from 100,000 in 2023 to 135,000 in 2024 or 34.6 percent.
  • Citizenship: Increase from 33,179 in June to 36,070 in July. July year-over-year change (change from 2022): 15.4% (25.0%). Year-to date 2024 compared to 2023 increase of 16 percent OPEN DATA NOT UPDATED FOR AUGUST AND SEPTEMBER
  • Visitor Visas: Increase from 118,402 in June to 127,399 in July. July year-over-year change (change from 2022): -19.7% (37.6%). OPEN DATA NOT UPDATED FOR AUGUST AND SEPTEMBER

https://www.slideshare.net/slideshow/canadian-immigration-tracker-key-slides-september-2024/273373580

COVID-19 Immigration Effects – July 2024 update

Highlights:

  • Permanent residents admissions: PR Admissions: Increase from 44,530 in June to 47,770 in July. July year-over-year change (change from 2022 in parentheses): Economic – PNP 34.9% (15.0%), Economic – Federal 11.7% (0.7%), Family 2.8% (-2.1%), Refugees 14.4% (30.8%)
  • TR2PR (Those already in Canada): Increase from 19,170 in June (43% of all PRs) to 22,100 in July (46.3% of all PRs). July year-over-year change (change from 2022): 10.6% (32.5%)
  • TRs-IMP: Decrease from 70,435 in June to 61,510 in July. July year-over-year (change from 2022): Agreements: 205.6% (-32.8%), Canadian Interests: -27.7% (29.9%), Other IMP Participants -56.1% (430.3%), Not stated -18.0% (-17.7%)
  • TRs-TFWs: Decrease from 19,230 in June to15,330 in July. July year-over-year change (change from 2022): Caregivers -18.8% (0.0%), Agriculture -23.0% (-19.5%) and Other LMIA -9.4% (79.4%).
  • NEW: TRs by occupation code (June, will be updated quarterly): 58 % low-wage (D), year-over-year change (change from 2022) 18.5% (571.3%): 
  • Students: Increase from 29,420 in June to 35,105 in July. July year-over-year change (change from 2023): -35.4% post-secondary -41.5% (-5.1%). Year-to date 2024 compared to 2023 decline of 4 percent 
  • Asylum Claimants: Stable, from 14,485 in June to 14,825 in July. July year-over-year change (change from 2022): 23.4% (90.1%)
  • Citizenship: Increase from 33,179 in June to 36,070 in July. July year-over-year change (change from 2022): 15.4% (25.0%). Year-to date 2024 compared to 2023 increase of 16 percent
  • Visitor Visas: Increase from 118,402 in June to 127,399 in July. July year-over-year change (change from 2022): -19.7% (37.6%).Slide 3 has the overall numbers and change.

https://www.slideshare.net/slideshow/canadian-immigration-tracker-key-slides-july-2024-pdf/271760138

Canadian Immigration Tracker: June 2024 Update

Half-year highlights, January to June year over year increase. Study permit applications and issues most notable change, highlighting impact of caps on international post-secondary students.

Summary tables of impact on international students (permits issued, applications and web interest), all showing a significant decline for the April-June quarter:

—–

Permanent residents: Slight decrease of 2.9 percent (likely to be made up in subsequent quarters)

TRs-IMP: Overall increase of 8.9 percent but April-June shows a decline of 8.5 percent compared to the 27.7 percent increase January-March

TRs-TFWs: Overall decrease of 3 percent, 1.4 percent in April-June

Students: Number of applications have decreased by 32 percent, but April-June highlights the impact of the cap announcement with a decline of 47.2 percent. With respect to post-secondary study permits issued, while the overall number decreased only by 1.7 percent, April-June declined by 21.4 percent, a sharp contrast with an increase of 34.3 percent January-March. 

Asylum Claimants: Increase of 55.4 percent, quarterly numbers largely the same

Citizenship: Increase of 16.2 percent, quarterly numbers largely the same

Visitor Visas: Decrease of 10.2 percent, with a greater decrease in the second quarter of 24 percent.

https://www.slideshare.net/slideshow/canadian-immigration-tracker-key-slides-june-2024/270924210

Canadian Immigration Tracker- May 2024 update

Highlights

Permanent Residents increased but percentage of TR2PR slipped to 53 percent of all Permanent Residents. 

Asylum claimants stable at about 16,000 per month.

Study permit applications increased (seasonal). Study permit web interests have declined by over 25 percent the past year, January to June).

IMP numbers have increased while TFWP numbers have decreased save for those with LMIA.

Citizenship numbers increased. 

Slide 3 has the overall numbers and change.

https://www.slideshare.net/slideshow/canadian-immigration-tracker-key-slides-may-2024-pdf/270213627