Statistics Canada — Police-reported data on hate crime and cybercrime, 2014
2016/04/14 Leave a comment
 In contrast to previous years, Statistics Canada does not provide a narrative analysis of what the current year reveals.
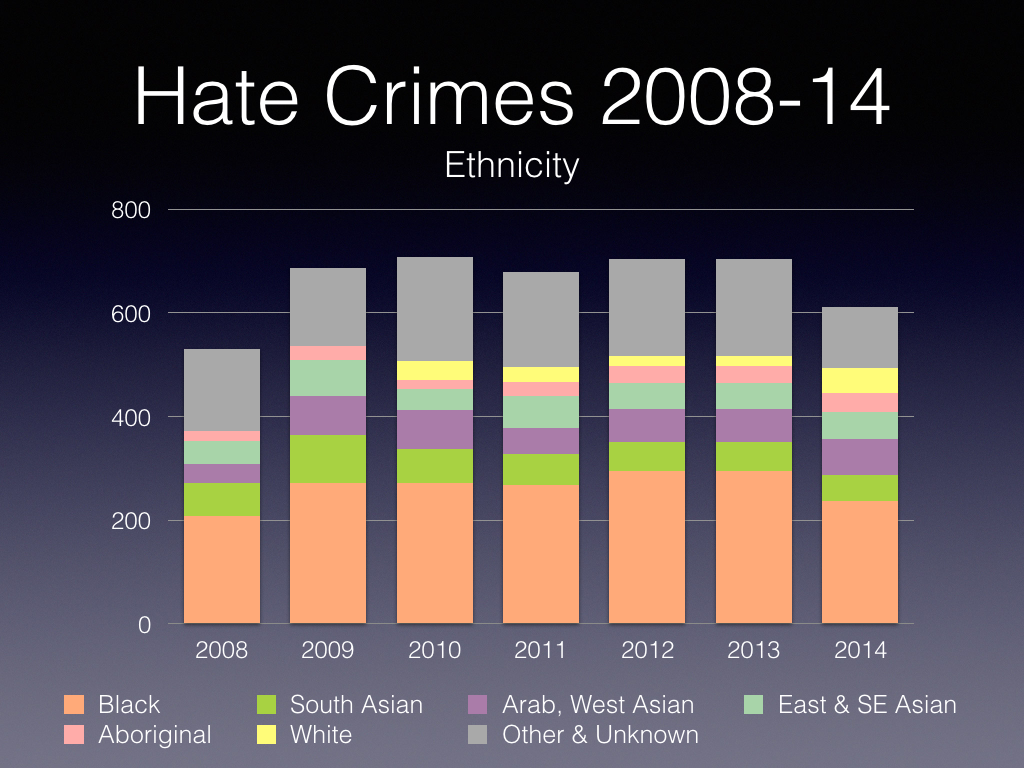
The chart above provides the data over the 2008-14 period, showing a slightly decreasing trend with respect to ethnicity related hate crimes and a corresponding slight increase in religion-related hate crimes. Overall numbers continue to remain largely flat at 1,295 (itself surprising given continued population growth).
About half are classified as mischief (612), with the remainder largely involving violence or threats of violence.
While Statistics Canada cautions against comparing year-to-year data, these trends over seven years are more reliable. Police-reported hate crime data tends to be more conservative than that collected by community organizations given the higher reporting burden on victims, so these figures likely under-estimate the number.
As is normal, the larger cities report more hate crimes (e.g., the GTA accounts for 26 percent, greater Montreal 8 percent, greater Vancouver 6 percent and Calgary also about 6 percent). On a per capita basis, larger cities tend to have lower rates than smaller centres. The table below lists communities with more than 10 hate crimes reported along with the per 100,000 rate:

The variation in the per capita rate may reflect a variety of factors ranging from greater willingness to report hate crimes, a more aware police force as well as possible underlying differences.
The following chart confirms again that anti-Black hate is the most common form of ethnicity-related hate crimes: about 50 percent.
Religion-based hate crimes are captured in the following chart, showing once again that Canadian Jews are the most targeted. However, in 2014, the relative share for Canadian Jews declined from being in the mid-to-high 50 percent range to just under 50 percent, with hate crimes against Canadian Muslims showing significant increases in the last two years, reaching 23 percent of all religious hate crimes in 2014.
 It remains to be seen how the events of 2015 and some of the language used by the previous government in the lead-up to and during the election campaign affects this trend in next year’s report.
Source: The Daily — Police-reported data on hate crime and cybercrime, 2014

