Police-reported hate-motivated crime rises sharply for second year in a row

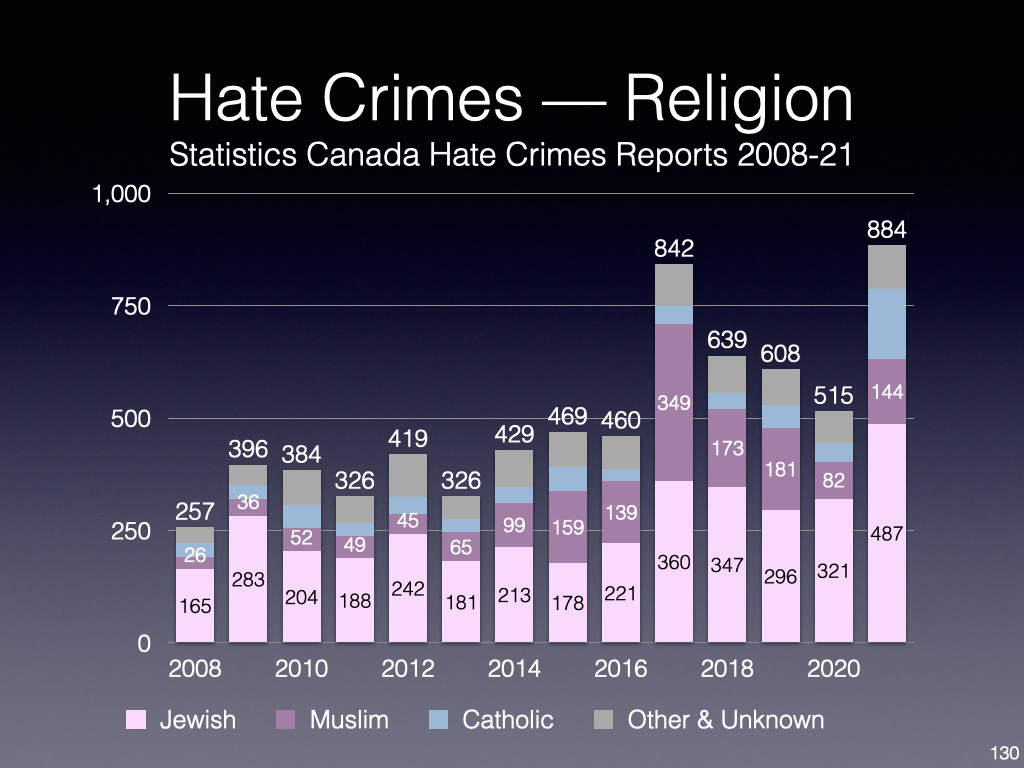
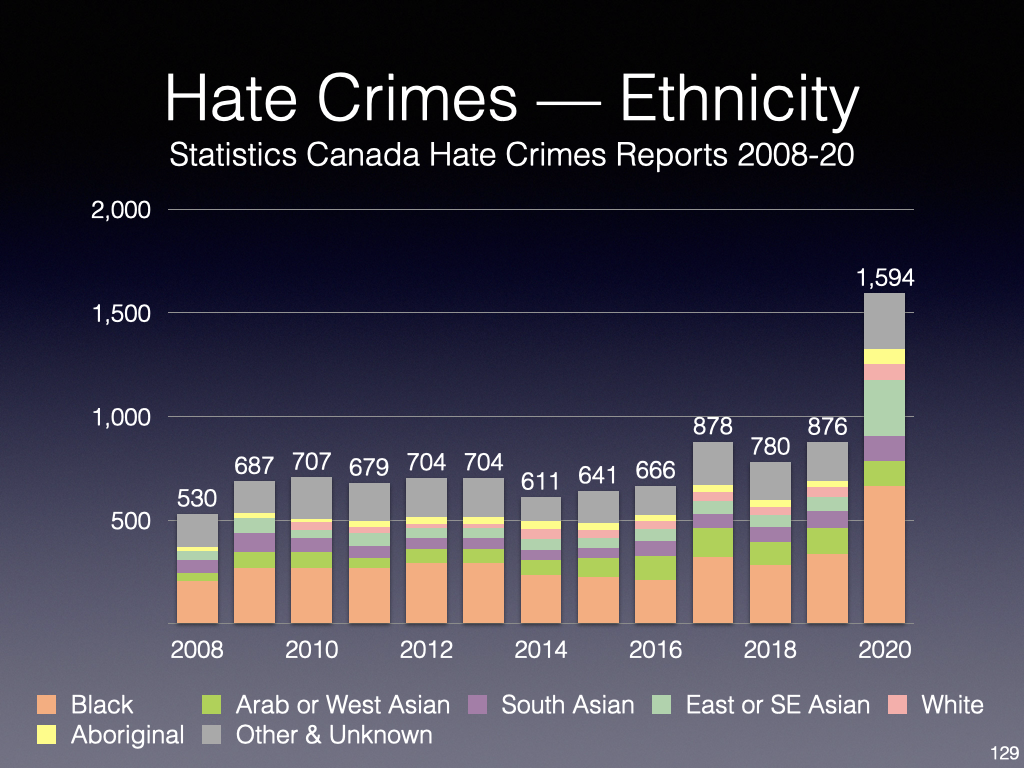
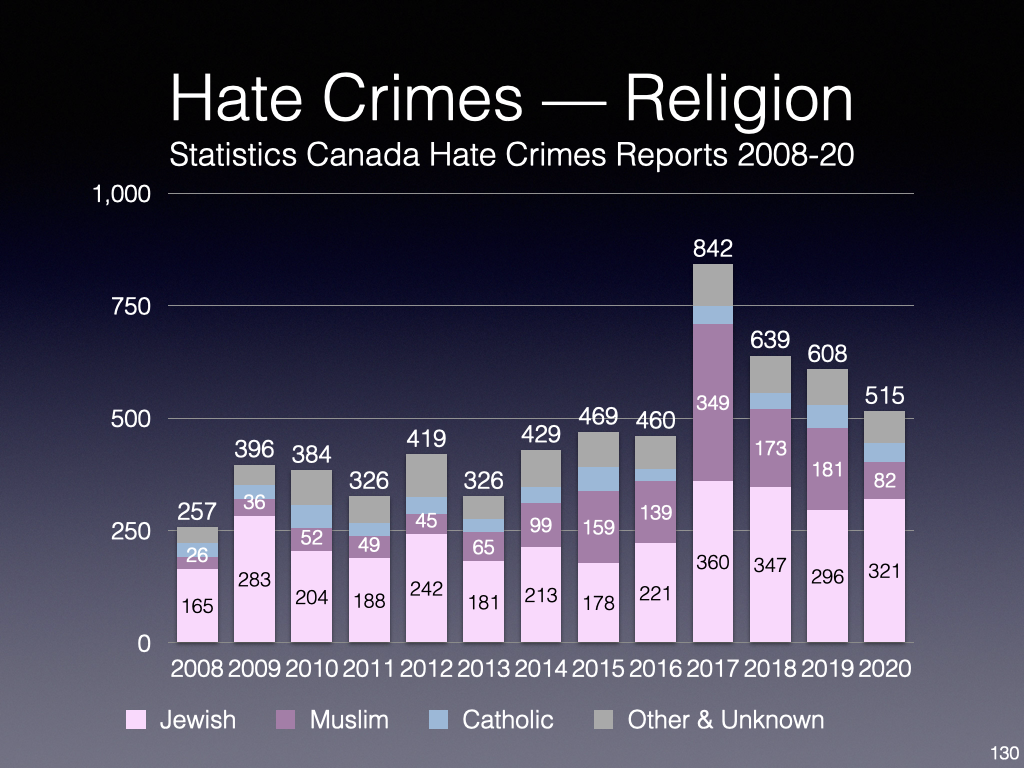
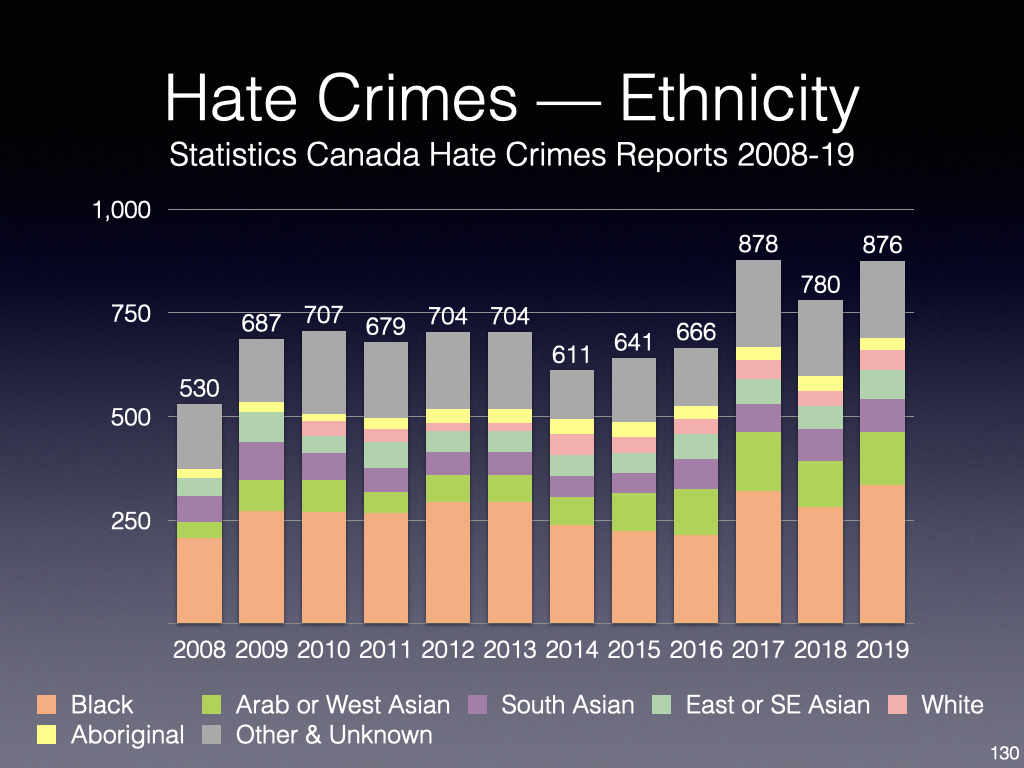
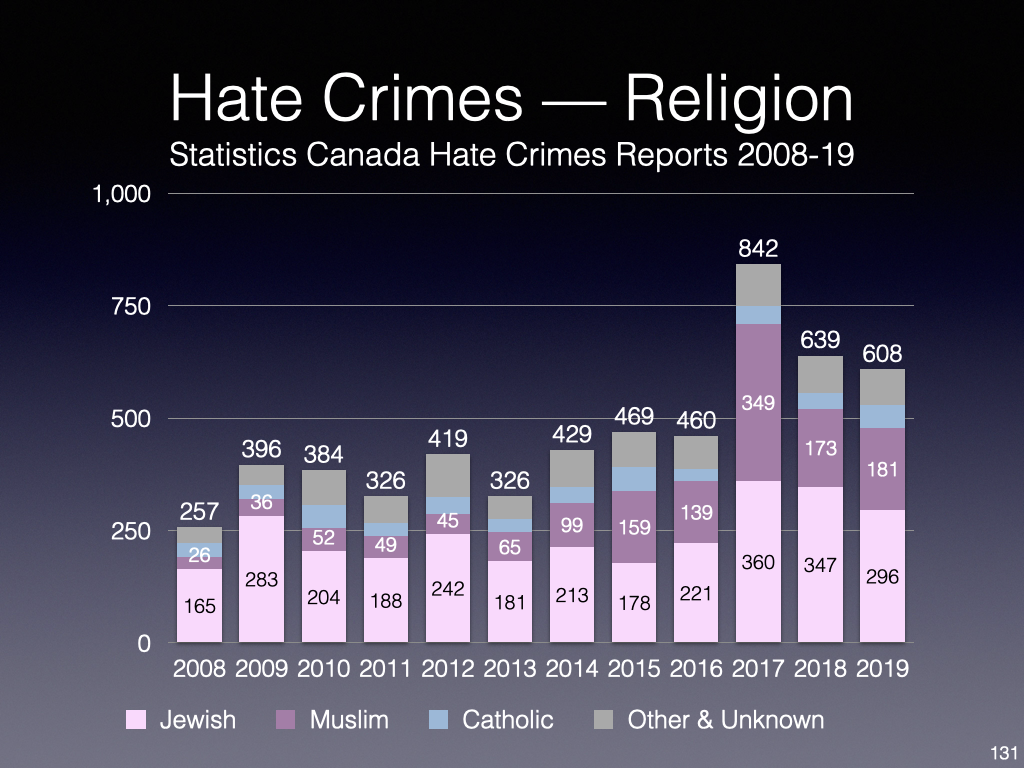
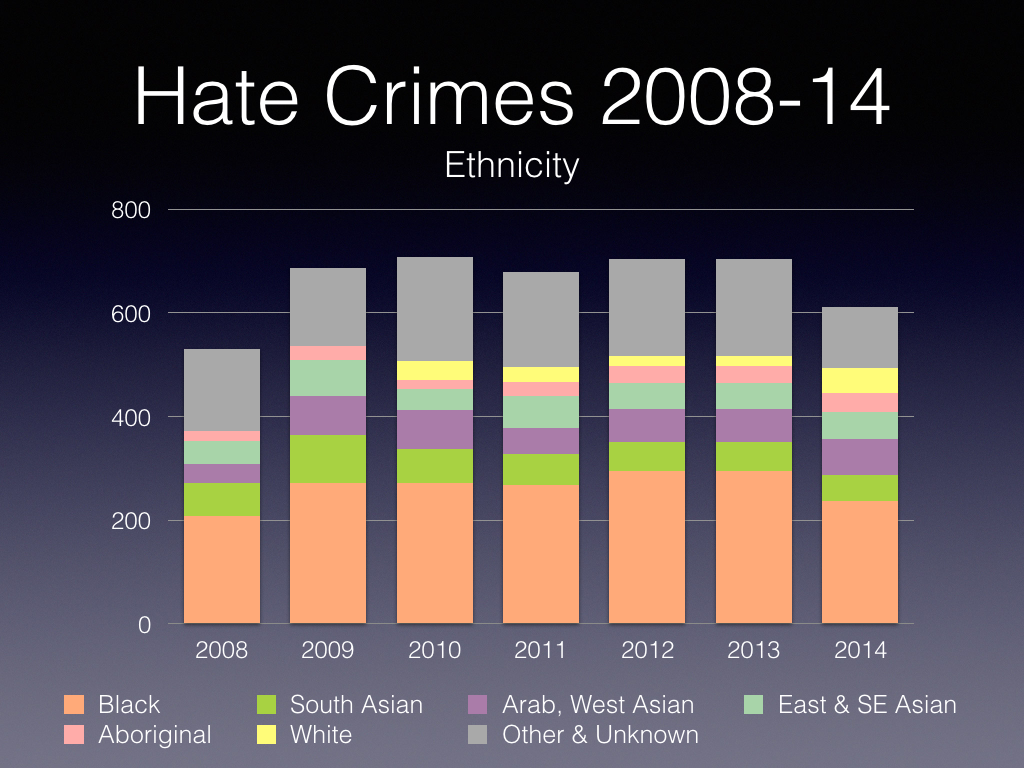
Latest numbers by StatsCan, showing particularly high increase in 2021 of religiously motivated hate crimes, with biggest relative increase for Catholics, likely due to the discovery of unmarked graves. In terms of ethnicity motivated, the rise of anti East and SE Asian hate crimes during pandemic stands out:

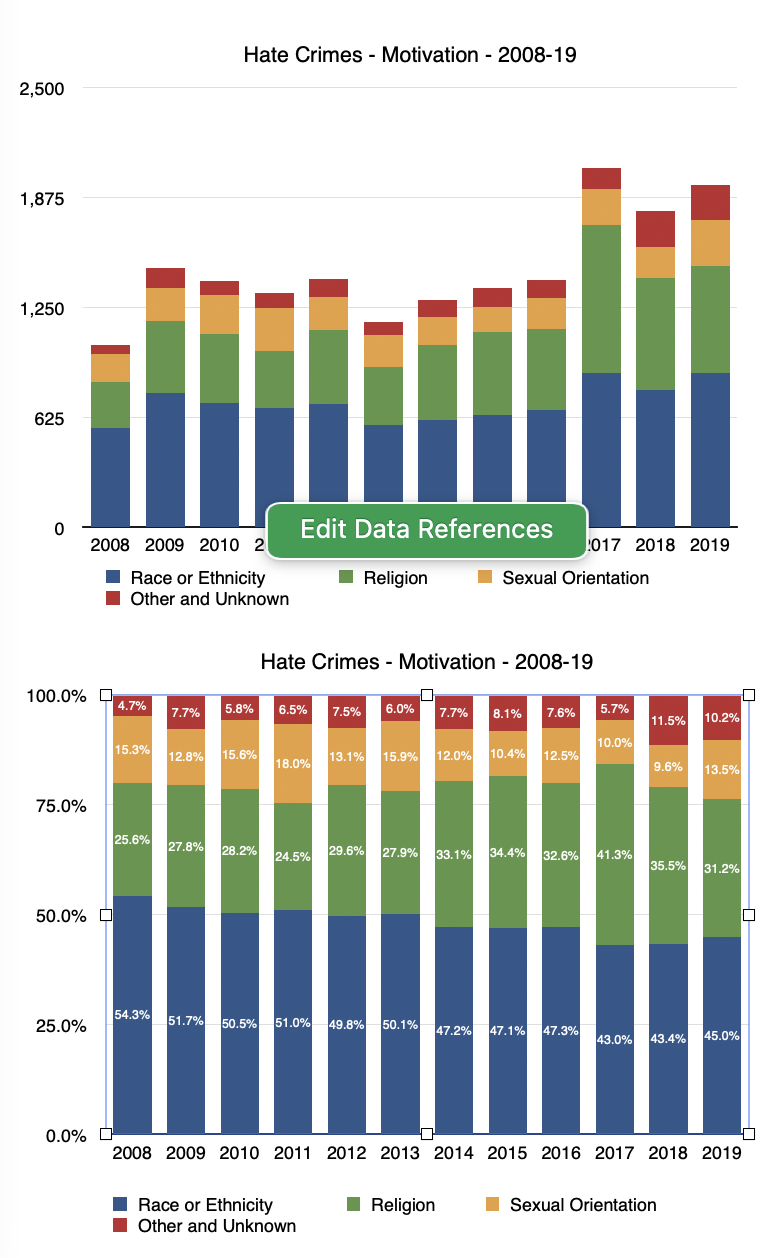
The number of police-reported hate-motivated crimes in Canada increased by 27%, up from 2,646 incidents in 2020 to 3,360 in 2021. This follows a 36% increase in 2020. In total, the number of police-reported hate crimes rose 72% from 2019 to 2021. Higher numbers of hate-motivated crimes targeting religion (+67%; 884 incidents), sexual orientation (+64%; 423 incidents) and race or ethnicity (+6%; 1,723 incidents) accounted for the majority of the increase. All provinces and territories reported increases in the number of hate crimes in 2021, except for Yukon, where it remained the same.

Police data on hate crimes reflect only those incidents that come to the attention of police and that are subsequently classified as hate crimes. As a result, fluctuations in the number of reported incidents may be attributable to a true change in the volume of hate crimes, but they might also reflect changes in reporting by the public because of increased community outreach by police or heightened sensitivity after high-profile events. Reporting may also be influenced by language barriers, issues of trust or confidence in the police, or fear of further victimization or stigma.

Source: Police-reported hate-motivated crime rises sharply for second year in a row

Reactions:

The head of the Canadian Race Relations Foundation is calling for action to combat hate and more federal help for victims, as new statistics show that hate crimes in Canada rose by 27 per cent last year. 

Executive director Mohammed Hashim warned that unless action is taken to combat hate-motivated abuse, including online, it will continue to spread.

He said the “slew of hate” online is so prevalent it risks becoming normalized and those affected are changing their behaviour to deal with it, including by not reading social media comments.

“It is a firehose of hate that is growing, honestly, like a wildfire,” he said. “And unmitigated it will grow even further to a point where we will normalize being in a wildfire.

“That is because we have left this environment unchecked.”

Statistics Canada reported a dramatic increase in hate crimes in 2021. Last year, the number of hate-motivated crimes reported to the police rose to 3,360 incidents from 2,646 in 2020. This followed a 36 per cent rise in 2020. 

In total, the number of hate-motivated crimes recorded by the police has gone up 72 per cent since 2019, according to the agency. 

Four Muslim Canadians from the same family were killed in June last year when a man rammed a truck into them in London, Ont. Police have said the attack was motivated by Islamophobia.

Public Safety Minister Marco Mendicino said the figures are “further evidence of the alarming and unacceptable rise of hate that marginalized communities have experienced in recent years.”

Mendicino said the federal government is taking action on a variety of fronts, led by new legislation to tackle the rise of hate speech and hate crimes.

“We will not rest until all Canadians feel safe in their communities,” he added. 

A report by the race relations foundation, published Tuesday, calls for greater federal help for victims of hate, many of whom do not qualify for financial compensation because their abuse does not count as a crime.

Hashim warned that “not supporting victims and leaving hate to proliferate freely disintegrates Canadian multiculturalism as a whole and a sense of collective belonging to this nation.”

Hate-motivated crimes targeting a person’s religious affiliation were up 67 per cent last year, according to Statistics Canada. Crimes based on a victim’s sexual orientation were up 64 per cent year over year. Another 1,723 recorded incidents targeted a person’s race or ethnicity, a six per cent increase, and together these categories made up the majority of the overall rise.

Marvin Rotrand of B’nai Brith Canada said Jews were the No. 1 target of hate crimes aimed at religious minorities. 

“All Canadians should be worried about the alarming explosion of hate crimes witnessed in 2021,” Rotrand said. “Our community comprises 1.25 per cent of the Canadian population but were the victims of 56 per cent of hate crimes aimed at religious minorities. That is more than all other religious groups combined.”

Shimon Koffler Fogel, president and CEO of the Centre for Israel and Jewish Affairs, said incidents targeting the Jewish community have risen by 47 per cent since 2020.

“Statistically, Canadian Jews were more than 10 times more likely than any other Canadian religious minority to report being the target of a hate crime,” he said.

All provinces and territories reported increases in the number of hate crimes in 2021, except for Yukon, where the numbers remained the same.

Hashim, who regularly tours the country speaking to victims of hate as well as community groups and police forces, said more focus must be put on victims. He said young women are facing huge amounts of abuse online, particularly young Black women. 

“Right now we talk a lot about hate crime statistics, how police are dealing with it or not dealing with it, being reported or not being reported,” he said. “What we are constantly missing is what is the effect on victims.”

The Department of Canadian Heritage is working on drafting an online hate bill to set up a framework to combat abuse online.

A previous anti-hate bill, introduced at the tail end of the last Parliament, died when the election was called. 

Heritage Minister Pablo Rodriguez appointed an expert panel to make suggestions for a future bill, including faster takedown obligations on platforms, in particular over child pornography.

During a consultation by the federal government last year, some minority groups raised concerns about directly involving the police to combat hate speech online.

Hashim warned against “digital carding” and a mass trawl of content online. He acknowledged there is concern about whether police should be able to access all takedown materials for investigative purposes.

“I don’t think that is the proper way of doing online safety. There need to be checks and balances between how much information is accessible to the police. That is why we have warrants,” he said.

“Just creating open access for all police, for all takedown data, for all social media platforms is overkill in my opinion.” 

The report commissioned by the Canadian Race Relations Foundation, and written by PricewaterhouseCoopers, said 80 per cent of hate crimes go unreported each year.

The report recommends Canada mirror Germany’s model for supporting victims of hate with millions of dollars of funding for community groups, which people who encounter hate “instinctively” reach out to, as well as a further victims fund. 

It says the government’s current compensation schemes exclude many victims of hate because few hate-motivated acts are designated as criminal.

The report also suggests the government establish an emergency response fund for communities hit by hate attacks on a large scale, as well as a central national support hub for victims.

Source: Race relations foundation urges more help for victims as hate crimes rise further

Police-reported hate crime, 2020

Although numbers have been out for some time, here is the StatCan analytical note:

In the first year of the COVID-19 pandemic, police reported 2,669 hate crimes in Canada, up 37% from 2019. This marks the largest number of police-reported hate crimes since comparable data became available in 2009. In 2020, police-reported hate crimes targeting race or ethnicity almost doubled (+80%) compared with a year earlier, accounting for the vast majority of the national increase in hate crimes.

Today, Statistics Canada released a detailed analysis in the Juristat article “Police-reported hate crime in Canada, 2020” and the accompanying infographic “Infographic: Police-reported hate crime in Canada, 2020.”

The pandemic further exposed and exacerbated issues related to community safety and discrimination in Canada, including hate crime. According to a crowdsourcing initiative conducted early in the pandemic, respondents belonging to visible minority groups were three times more likely to have perceived an increase in race-based harassment or attacks compared with the rest of the population (18% vs. 6%). This difference was most pronounced among Chinese (30%), Korean (27%), and Southeast Asian (19%) participants. Furthermore, people designated as visible minorities and Indigenous peoples considered their neighbourhoods to be less safe during the pandemic.

Chart 1 
Number of police-reported hate crimes, Canada, 2009 to 2020

Chart 1: Number of police-reported hate crimes, Canada, 2009 to 2020

Hate-motivated crime rises sharply, while other crime drops

While police-reported hate crimes increased sharply, the overall police-reported crime rate (excluding traffic offences) decreased by 10% from 2019 to 2020. In the first month and a half of the pandemic, in which initial lockdown restrictions were in place, the number of police-reported hate crimes and other crimes was lower compared with the same period in 2019. From May to December 2020, however, other crimes remained lower month to month compared with 2019 (-12%), while hate-motivated crimes increased substantially (+52%).

Chart 2 
Percentage change in number of police-reported hate-motivated crimes compared with other crimes, by month of reporting, Canada, 2019 to 2020

Chart 2: Percentage change in number of police-reported hate-motivated crimes compared with other crimes, by month of reporting, Canada, 2019 to 2020

As with other crimes, self-reported data provide further insight into hate-motivated crimes as a complement to police-reported data. While the number of hate crimes rose sharply in 2020, this may still represent an underestimation. Self-reported data show that the majority of criminal incidents perceived to be motivated by hate are not reported to police. Specifically, according to the 2019 General Social Survey (GSS) on Canadians’ Safety (Victimization), Canadians were the victims of over 223,000 criminal incidents that they perceived as being motivated by hate in the 12 months that preceded the survey (3% of self-reported incidents). Approximately one in five (22%) of these incidents were reported to the police.

Most provinces and two territories report increases in hate crimes

When population size is accounted for, the rate of police-reported hate crime in Canada from 2019 to 2020 rose 35% to 7.0 incidents per 100,000 population. The most notable increases in police-reported hate crime rates among the provinces were recorded in Nova Scotia (+70%; +23 incidents), British Columbia (+60%; +198 incidents), Saskatchewan (+60%; +20 incidents), Alberta (+39%; +84 incidents), and Ontario (+35%; +316 incidents). No increases were reported by Manitoba, Prince Edward Island, New Brunswick and the Northwest Territories. The relatively small population counts and number of hate crimes in the territories typically translate to more unstable rates, making year-over-year comparisons less reliable.

The rate of hate crime was highest in British Columbia (10.1 incidents per 100,000 population), Ontario (7.9 incidents per 100,000 population) and Alberta (6.6 incidents per 100,000 population).

While the majority (84%) of police-reported hate crimes in Canada occurred in large urban centres or census metropolitan areas (CMAs), rates increased the same (+35%) in CMAs and non-CMAs, which include smaller cities, small towns or rural areas.

Chart 3 
Rate of police-reported hate crimes, by province, 2017 to 2020

Chart 3: Rate of police-reported hate crimes, by province, 2017 to 2020

Non-violent and violent hate crimes up in 2020

More than half (57%) of all hate crime incidents reported by police were non-violent in 2020, while the remaining 43% were violent. These proportions were similar to recent years. Both non-violent (+41%) and violent (+32%) hate crimes increased compared with 2019, contributing fairly equally to the overall increase in hate crime in 2020.

The increase in non-violent hate crime was largely the result of more incidents of general mischief (+33%). The rise in violent hate crime was the result of more incidents of several violations, including criminal harassment (+70%), major or aggravated (level 2 and 3) assault (+58%), common assault (+23%) and uttering threats (+11%).

As is typical of police-reported hate crime historically, mischief (general mischief and mischief towards property used primarily for worship or by an identifiable group) was the most common hate crime-related offence, accounting for almost half (44%) of all hate crime incidents.

For all violent hate crimes reported by police between 2011 and 2020 and for which a victim was identified, 66% of victims were men or boys, and 34% were women or girls. Relative to other hate crime motivations, incidents targeting the Muslim population (47%) were more likely to involve women and girls. This was also the case for hate crimes targeting the Indigenous population, where 44% of victims were women or girls.

Crimes motivated by hatred of a race or ethnicity nearly double

The year 2020 was marked not only by the global pandemic, but also the rise of social movements seeking justice and racial and social equity. It is not possible to link police-reported hate crime incidents directly to particular events, but coverage and public discourse around particular issues can increase awareness and exacerbate or entice negative reactions from people who oppose the movement.

The number of police-reported hate crimes targeting race or ethnicity almost doubled (+80%) in 2020 compared with a year earlier, accounting for the vast majority of the national increase. Police reported 1,594 crimes motivated by hatred of a race or ethnicity. Much of the rise in these types of hate crimes was the result of crimes targeting the Black population (+318 incidents or +92%), the East or Southeast Asian population (+202 incidents or +301%), the Indigenous population (+44 incidents or +152%), and the South Asian population (+38 incidents or +47%). In 2020, police reported the highest number of hate crimes targeting each of these population groups since comparable data became available.

Chart 4 
Number of police-reported hate crimes, by type of motivation, Canada, 2017 to 2020

Chart 4: Number of police-reported hate crimes, by type of motivation, Canada, 2017 to 2020

Despite an increase, hate crimes targeting Indigenous populations continue to account for relatively few police-reported hate crimes

The number of police-reported hate crimes targeting Indigenous people—First Nations people, Métis or Inuit—more than doubled from 29 in 2019 to 73 in 2020. Despite the increase, incidents against Indigenous people continued to account for a relatively small proportion (3%) of police-reported hate crimes. Self-reported data indicate that rates of violent victimization among Indigenous people were more than double that among non-Indigenous people, but also showed that Indigenous people have lower confidence in police, the justice system and other institutions than their non-Indigenous counterparts. Different degrees of confidence in the police or other institutions among different populations may affect the likelihood that a particular crime is reported to the police.

Hate crimes targeting religion down for the third year in a row

Following a peak in 2017, hate crimes targeting religion declined for the third year in a row, dropping 16% in 2020. Despite the recent declines, the 515 incidents targeting religion in 2020 remained higher than the number of incidents recorded annually prior to 2017. Among reported hate crimes targeting a religion in 2020, the Jewish and Muslim populations continued to be the most frequent targets, accounting for 62% and 16% of crimes against a religion, respectively.

These results mirror findings on self-reported discrimination from the 2019 GSS on Victimization. According to the GSS, the Jewish and Muslim populations were significantly more likely to report experiencing discrimination on the basis of their religion than most other religious affiliations.

The decrease in hate crimes targeting a religion was primarily because hate crimes targeting the Muslim population dropped by 55% in 2020, from 182 incidents to 82 incidents. Declines were mostly in Quebec (-50 incidents), Ontario (-27 incidents) and Alberta (-19 incidents).

In contrast, incidents targeting the Jewish population increased 5% in 2020, from 306 to 321 incidents. Among the provinces and territories, notable changes occurred in Ontario (+15 incidents), Quebec (+10 incidents) and Manitoba (-13 incidents).

Slight decrease in crimes motivated by hatred of a sexual orientation

According to the 2018 Survey of Safety in Public and Private Spaces, an estimated 1 million people in Canada reported their sexual orientation as lesbian, gay, bisexual, pansexual, asexual, a sexual orientation on the asexual spectrum, or a sexual orientation that is not otherwise classified. Compared with heterosexual Canadians, this population was more likely to report having been violently victimized in their lifetime and were more likely to have experienced inappropriate behaviours in public and online. At the same time, they were less likely to report being physically assaulted to the police.

Although the number of police-reported hate crimes targeting sexual orientation was down by 2% in 2020, the 259 incidents were the second highest reported since comparable data have been available since 2009. About 8 in 10 (81%) of these crimes specifically targeted the gay and lesbian community, while the remainder targeted the bisexual orientation (2%) and other sexual orientations, such as asexual, pansexual or other non-heterosexual orientations (9%). An additional 7% were incidents where the targeted sexual orientation was reported as unknown.

As was the case in previous years, violent crimes accounted for almost 6 in 10 (58%) hate crimes targeting a sexual orientation. In comparison, one-fifth (20%) of hate crimes targeting religion and less than half (47%) of those targeting race or ethnicity were violent.

Source: Police-reported hate crime, 2020

Police-reported hate crime, 2019

2017 marked a major change since when these statistics were collected as shown in the above charts. Pre-COVID so recent spike in anti-Asian hate crimes not captured but largely post Black Lives Matter (but pre-George Floyd killing):

There were 1,946 police-reported hate crimes in Canada in 2019, up 7% from a year earlier. Other than a single peak of 2,073 hate crimes in 2017, police-reported numbers are the highest since 2009.

Today, Statistics Canada released a detailed analysis in the Juristat article “Police-reported hate crime in Canada, 2019” and the accompanying infographic “Infographic: Police-reported hate crime in Canada, 2019.”

Statistics Canada collects data on the number and nature of hate crimes reported to police in any given year and monitors trends over time. The following statistics from 2019 do not reflect the large-scale societal impacts, both nationally and globally, of the COVID-19 pandemic, as this information is not yet available. The 2019 police-reported hate crime data will, however, be a key reference point for 2020, to identify possible changes in Canadian crime patterns as a result of factors related to the pandemic. 

Results from a recent crowdsourcing survey show that, since the start of the pandemic, the proportion of participants designated as visible minorities who perceived an increase in race-based harassment or attacks was three times larger than the proportion among the rest of the population (18% versus 6%). This difference was most pronounced among Chinese (30%), Korean (27%), and Southeast Asian (19%) participants. In addition, some police services and media outlets, such as those in Vancouver(PDF 1,787 KB), Ottawa and Toronto (PDF 1,702 KB), have indicated significant increases in hate crime incidents in 2020.

Hate crimes target the integral and visible parts of a person’s identity and may disproportionately affect the wider community. A hate crime incident may be carried out against a person or property and may target race, colour, national or ethnic origin, religion, sexual orientation, gender identity or expression, language, sex, age, mental or physical disability, or any other similar factor. In addition, four specific offences are listed as hate propaganda or hate crimes in the Criminal Code of Canada: advocating genocide, public incitement of hatred, willful promotion of hatred and mischief motivated by hate in relation to property used by an identifiable group.

Hate-motivated crime up from 2018 and remains higher than previous 10-year average

The number of police-reported hate crimes in Canada was up 7% in 2019, rising from 1,817 incidents to 1,946. Since comparable data became available in 2009, the number of hate crimes has ranged from 1,167 incidents in 2013 to 2,073 in 2017. On average, 1,518 hate crime incidents have been reported annually by police since 2009.

Chart 1  
Number of police-reported hate crimes, Canada, 2009 to 2019

Chart 1: Number of police-reported hate crimes, Canada, 2009 to 2019

As with other crimes, self-reported data provide further insight into hate-motivated crimes. According to the 2014 General Social Survey on Canadians’ Safety (Victimization), Canadians reported being the victim of over 330,000 criminal incidents that they perceived as being motivated by hate in the 12 months that preceded the survey (5% of the total self-reported incidents). Two-thirds of these incidents were not reported to the police, a rate similar to that for victimization overall.

Hate-motivated crime accounts for a small proportion of all police-reported crime (around 0.1% of all non-traffic-related offences). However, police data on hate crimes reflect only those incidents that come to the attention of police and are classified as hate crimes. As a result, fluctuations in the number of reported incidents may be attributable to a true change in the volume of hate crimes, but they might also reflect changes in reporting by the public because of increased community outreach by police or heightened sensitivity after high-profile events.

Most provinces and all territories report increases in hate crimes

In 2019, eight provinces and all three territories posted increases in police-reported hate crimes. The largest contributors to the national increase were British Columbia (+49 incidents), Ontario (+43 incidents) and Quebec (+23 incidents). Alberta reported 38 fewer incidents and Nova Scotia had no change from the previous year.

Accounting for population size, hate crime rates were highest in British Columbia (6.1 incidents per 100,000 population), Ontario (5.9 incidents), Quebec (4.8 incidents) and Alberta (4.7 incidents). While the vast majority (84%) of hate crimes occurred in a census metropolitan area (CMA), non-CMA areas (small cities, small towns and rural areas) accounted for two-thirds (67%) of the increase in hate crime incidents in 2019. Stated another way, areas outside CMAs recorded 86 more incidents in 2019, while CMAs recorded 43 more incidents.

Police-reported hate crimes targeting race or ethnicity and sexual orientation were up compared with the previous year, accounting for most of the national increase. Hate crimes targeting religion were down because of fewer incidents targeting the Jewish population. There were more incidents targeting the Muslim population.

Chart 2  
Police-reported hate crimes, by region, 2017 to 2019

Chart 2: Police-reported hate crimes, by region, 2017 to 2019

Non-violent and violent hate crimes up in 2019

Non-violent hate crime accounted for over half (56%) of all hate crimes in 2019, the same proportion as in 2018. Both non-violent (+6%) and violent (+8%) hate crimes increased in 2019, contributing nearly equally to the overall increase in hate crime.

The increase in non-violent hate crime was largely the result of more incidents of general mischief (+7%). The rise in violent hate crime was driven by more incidents of common assault (+24%) and uttering threats (+12%).

As is typical of police-reported hate crime historically, mischief (general mischief and mischief towards property used primarily for worship or by an identifiable group) was the most common hate crime-related offence, accounting for almost half (45%) of all hate crime incidents.

Police-reported hate crimes motivated by hatred of a race or an ethnicity increase

Individuals designated as visible minorities generally report higher levels of discrimination than the non-visible minority population (20% versus 12%). Specifically, those who identified as Arab or Black were most likely to report having experienced discrimination, with four in five Black Canadians who had experienced discrimination indicating that their race or skin colour was the basis of the discrimination.

Almost half (46%) of all police-reported hate crime was motivated by hatred of a race or an ethnicity in 2019. Police reported 876 crimes motivated by hatred of a race or an ethnicity, up 10% from 2018, and 2 fewer than the record high in 2017. The rise was largely attributable to 40 more hate crimes targeting the Black population (+14%) and 35 more incidents targeting the Arab and West Asian populations (+38%).

With 335 police-reported incidents, hate crimes targeting the Black population reached their highest number recorded dating back to 2009. Hate crimes targeting the Black population accounted for 18% of all hate crimes in Canada, and this population was the most targeted group overall in 2019. Ontario (+29 incidents) and British Columbia (+16 incidents) accounted for the largest increases in hate crimes against the Black population, while Alberta (-19 incidents) reported the largest decrease.

The number of police-reported hate crimes against the Arab and West Asian populations rose from 93 to 128, following a 35% decrease a year earlier. This was the second-highest number dating back to 2009. These crimes accounted for 15% of hate crimes targeting race or ethnicity, and 7% of all hate crimes in 2019.

While the number of hate crimes targeting race or ethnicity rose in 2019, victimization data from the same year suggest that population groups designated as visible minorities were significantly less likely to report having a great deal of confidence in the police (35%), compared with non-visible minorities (44%). Perceptions of personal safety, prior victimization or discrimination, and confidence in the police can all impact the likelihood of an individual reporting a crime to the police.

Hate crimes targeting the Indigenous population continue to account for relatively few police-reported hate crimes

Incidents against Indigenous people—those who are First Nations, Métis or Inuit—continued to account for a relatively small proportion of police-reported hate crimes (2%), decreasing from 39 incidents in 2018 to 30 incidents in 2019.

Police-reported violent hate crimes against Indigenous people are more likely than most other hate crimes to involve female victims. From 2010 to 2019, 45% of victims of violent hate crimes against Indigenous people were female, compared with 32% of all victims of violent hate crimes.

According to the most recent victimization information, Indigenous victims of non-spousal violence were less likely to report the crime to police than their non-Indigenous counterparts. Furthermore, Indigenous people were less likely to report having a great deal of confidence in the police compared with their non-Indigenous counterparts. Previous research has described the relationship between Indigenous people and the police as one of mistrust because of a range of systemic issues that have contributed to experiences of social and institutional marginalization, discrimination, violence, and intergenerational trauma. It is therefore unclear how the number of police-reported hate crimes may be impacted.

Record high number of hate crimes targeting sexual orientation

According to the 2018 Survey of Safety in Public and Private Spaces, an estimated 1 million people in Canada are sexual minorities—that is, they reported their sexual orientation as gay, lesbian, bisexual or a sexual orientation that is not heterosexual. Compared with heterosexual Canadians, sexual minority Canadians were more likely to report having been violently victimized in their lifetime and were more likely to have experienced inappropriate behaviours in public and online. At the same time, sexual minority Canadians were less likely to report having been physically assaulted to the police.

Police reported 263 hate crimes targeting sexual orientation in 2019, up 41% from a year earlier. This was the highest number of hate crimes targeting sexual orientation dating back to 2009. Nearly 9 in 10 (88%) of these crimes specifically targeted the gay and lesbian community, while the remainder comprised incidents targeting bisexual people (2%); people with other sexual orientations, such as asexual, pansexual or other non-heterosexual orientations (6%); and people whose sexual orientation was unknown (4%).

As was the case in previous years, violent crimes accounted for more than half (53%) of hate crimes targeting sexual orientation. In comparison, just over one-quarter (27%) of hate crimes targeting religion and just over half (52%) of hate crimes targeting race or ethnicity were violent.

Hate crimes targeting religion down for the second year in a row, with fewer anti-Semitic hate crimes

In 2019, 608 hate crimes targeting religion were reported by police, down 7% compared with 2018. Although this was the second year-over-year decrease in a row, following a peak of 842 incidents in 2017, the number was higher than those recorded prior to 2017. Victimization information has shown that people affiliated with a non-Christian religion were significantly more likely than Christians to report having experienced discrimination on the basis of their religion (11% versus 1%).

Following a 63% jump in 2017 and a 3% increase in 2018, the number of incidents targeting the Jewish population decreased 20% in 2019, from 372 to 296. The decline was the result of fairly widespread decreases, including fewer incidents in Alberta (-29), British Columbia (-20), Ontario (-19) and Quebec (-18). While police-reported metrics indicate a decrease in hate crimes targeting the Jewish population, an annual audit conducted by B’Nai Brith Canada reported a record number of anti-Semitic incidents for the fourth consecutive year.

In contrast, following a large decrease in hate crimes against the Muslim population in 2018, police reported 15 more incidents in 2019, for a total of 181 (+9%). The increase in police-reported hate crimes against Muslims was largely the result of more incidents in Quebec (+15 incidents).

Violent incidents targeting the Muslim population were more likely than other types of hate crimes to involve female victims. From 2010 to 2019, almost half (47%) of victims of violent hate crimes targeting the Muslim population were female, compared with one-third (32%) of all hate crime victims.

Source: https://www150.statcan.gc.ca/n1/daily-quotidien/210329/dq210329a-eng.htm?CMP=mstatcan

Hate Crimes: Motivation 2008-19

While the detailed breakdowns breakdowns by visible and religious minorities are not yet released, the overall numbers for 2019 by motivation are, showing relative stability in race or ethnicity hate crimes, a decline over the past three years in religion-based hate crimes, and a recent increase in other (language, disability, sex, age).

Source: https://www150.statcan.gc.ca/n1/daily-quotidien/201124/dq201124h-cansim-eng.htm

FUREY: What they’re not telling you about Canada’s hate crime stats

While there are limitations in the annual police reported hate crimes, by and large they provide a reasonable albeit imperfect indicator. The threshold of reporting to the police is higher than reporting to community organizations, particularly for communities that have lower levels of trust in police (e.g., Blacks).

While it would be nice to have data on charges laid and convictions, unlikely that such data would indicate large numbers of fraudulent claims that Furey intimates. StatCan in fact did such an analysis in its Police-reported hate crime in Canada, 2017, showing this not to be a major issue.

As to his critique of the Canadian Anti-Hate Network’s call for an annual survey, I agree that this should not replace the police-reported reports, again given the higher threshold.

And we do get some data from the General Social Survey on discrimination and dealing with the police, depicted below:

StatCan did a useful analysis of the 2017 and earlier report (Police-reported hate crime in Canada, 2017) that provided a breakdown of violent vs non-violent hate crimes by group, showing, for example, a greater proportion of violent hate crimes against Muslims (40 percent) than Jews (15 percent):

Hate crimes targeting the Black population and religion more often non-violent

Non-violent crimes accounted for 62% of crimes targeting the Black population from 2010 to 2017. A significant portion (53%) of these non-violent crimes were mischief. Non-violent crimes most often occurred in a single-family home (18% of incidents), in schools outside of school hours (14%), and on the street (14%). Of the 38% of hate crime targeting the Black population that were violent crimes, common assault was the most common type (14%). One quarter of violent hate crimes targeting the Black population took place on the street, 16% in a single-family home and 12% in a dwelling unit.

During the same period, 60% of crimes against the Muslim population were non-violent while the other 40% were violent. The most common violent hate crimes were uttering threats (18%) and common assault (8%) (see note 20). The most frequent locations of violent incidents were the street (19%) or at a single-family home (17%). The most frequent non-violent crimes were mischief (35%) and public incitement of hatred (9%). Non-violent crimes targeting the Muslim population occurred most often at religious institutions (17%).

From 2010 to 2017, 85% of hate crimes against the Jewish population were non-violent. The majority of these hate crimes were mischief (70%). The second and third most frequent offences against this population were uttering threats (6%) and hate-motivated mischief relating to property primarily used for religious worship or by an identifiable group (5%). While a notable proportion of non-violent hate crimes targeting the Jewish population occurred at a single-family home (18%), on the street (13%), or in schools outside of school hours (11%). Violent crimes most often occurred in a single family home (21%), businesses (17%), or on the street (15%).

Hopefully, StatCan will do an update of this analysis for 2018, including a data table:

It’s that time of the year again, when Canada’s annual hate crimes statistics are released and advocacy groups send out their press releases and take to the airwaves to break down what it all means.

While there’s often an alarming tone to the occasion, this year’s conversation will likely be more muted than in previous years because the latest numbers have gone down by 13%, from 2,073 in 2017 to 1,798 in 2018.

That said, as StatsCan explains: “Even with this decline, the number of hate crimes remains higher (with the exception of 2017) than any other year since 2009, and aligns with the upward trend observed since 2014.”

When broken down by identifiable group, Monday’s release means a 50% drop in hate crimes targeting Muslims, 15% fewer targeting sexual orientation, 12% fewer against black individuals and a 4% drop in incidents against Jews.

But this time around, before we take these numbers and try to craft a narrative around them, let’s take a step back and look at how they’re put together in the first place. Because there’s a lot StatsCan isn’t telling you in their release that doesn’t make its way into the basic reporting.

For starters, an overview of hate crimes will cover broad terrain – from graffiti that harms no one to violent incidents like the Quebec mosque massacre. They’re both bad and it’s right to have a zero-tolerance attitude to all categories, but obviously, the first one is cause for much less concern than the second one.

The numbers have always shown that, thankfully, the more severe forms of hate crimes are much rarer. Out of the 1,798 number, there were 138 incidents in 2018 that involved bodily harm to an individual and only 2 of those resulted in deaths. Compare that to “mischief/mischief to religious property”, which had 782 incidents. Threats alone made up for 251 incidents.

There’s another problem with all of this data though, one that calls into question not just how we talk about specifics, but the validity of the entire conversation itself.

The StatsCan release on Monday added some interesting context: “Police data on hate-motivated crimes include only those incidents that come to the attention of police services.” In other words, there could be more hate crimes happening that the police never heard about.

That’s a fair point. But they don’t offer the flip side of the coin, and they should. Which is that these stats aren’t “hate crimes” full stop. They’re “police-reported hate crimes”.

What does that mean? It means what it sounds like. Someone calls the cops and says a hate crime occurred.

It doesn’t mean these are all cases where someone was found guilty of perpetrating a hate crime. It doesn’t have to even mean the police properly investigated the incident. For many of these cases, it just means someone said something happened and the police jotted it down.

When I made a media request to Statistics Canada last year to ask for the number of actual charges, convictions and acquittals related to hate crimes I learned that they don’t compile these figures. This means they don’t tally the proven cases – they count when everything is still at the potential stage.

Prior to the release of this year’s data, the Canadian Anti-Hate Network – our version of the controversial left-leaning Southern Poverty Law Center – called on Statistics Canada to revise their methodology. They recommend that instead of using police-reported data, StatsCan does an annual survey that “asks Canadians if they’ve been the victim of a hate crime and takes a believe-the-victims approach”.

Is this a wise idea? Wouldn’t that only further muddy the waters? The facts tell us that alleged victims can and do lie.

A special prosecutor is currently being assigned to investigate the Jussie Smollett case. A Winnipeg couple has been charged for allegedly staging an anti-Semitic attack against their own cafe. And everyone remembers the hijab hoax case in Toronto that saw none other than Prime Minister Justin Trudeau weigh in on an assault that never happened.

One expert on the issue recommends Canadians ask critical questions of these statistics. “What’s the rate of hoax? That’s a blunt question but it’s extremely useful,” says Wilfred Reilly, a professor of political science at Kentucky State University, in an interview with the Sun.

Reilly studied American hate crime statistics in-depth, resulting in the publication of his new book Hate Crime Hoax: How the Left is Selling a Fake Race War.

“I would put the confirmed hoax rate at about 15% – cases that definitely unraveled and were provably debunked,” explains Reilly. “5% result in convictions and the rest are ambiguous.” He suggests the Canadian figures could likely be similar.

If we’re going to have a national conversation about hate crimes every year, we’re going to have to get better data. Or, at the very least, let Canadians know the facts behind the numbers we’re discussing so they can determine their usefulness.

Could the real number of hate crimes happening be significantly higher? Certainly. Or could we be overrun with hoaxes? That’s also possible. Given what we’re working with, we just don’t know.

Source: FUREY: What they’re not telling you about Canada’s hate crime stats

Hate-motivated crimes down after peaking in 2017, but still higher than in 2016

The latest numbers from StatCan:

Following a 47% increase in 2017, the number of police-reported hate crimes in Canada was down 13% in 2018, from 2,073 incidents to 1,798. Even with this decline, the number of hate crimes remains higher (with the exception of 2017) than any other year since 2009, and aligns with the upward trend observed since 2014.

The year-over-year decrease was almost entirely a result of declines in Ontario. Nationally, the number of hate crimes targeting the Muslim population fell 50% after spiking in 2017 because of large increases in Ontario and Quebec. In 2018, there were also fewer police-reported hate crimes targeting Blacks (-12%) and fewer targeting sexual orientation (-15%). Hate crimes targeting the Jewish population accounted for 19% of hate crimes in 2018, down 4% from 2017. In 2018, non-violent hate crimes (-23%) declined more than violent hate crimes (-7%).

Police data on hate-motivated crimes include only those incidents that come to the attention of police services. These data also depend on police services’ level of expertise in identifying crimes motivated by hate.

For more information on hate crime, see data tables 35-10-0066-01, 35-10-0067-01 and 35-10-0191-01.

Canada’s 10 worst cities for hate crime

More details from the latest police reported hate crimes report:

Four out of the 10 Canadian urban areas with the highest hate crime rates are in the Greater Toronto Area or Greater Golden Horseshoe, Statistics Canada data supplied to Maclean’s shows.

Police services covering Hamilton, Peterborough, the York region and Guelph all recorded hate crime rates per 100,000 that put their cities among the top 10 highest in the country in 2017, the most recent year with statistics available. Hamilton, Ont. saw the highest rate of any jurisdiction in the region and the third highest in the country, at 16 incidents per 100,000 people.  

Several GTA/Golden Horseshoe cities were also among the country’s urban areas with the fastest-growing hate crime rates. In 2016, only one GTA/Greater Golden Horseshoe city—Hamilton—made the top 10 for hate-crime rates.

Barbara Perry, director of the Centre on Hate, Bias and Extremism at the University of Ontario Institute of Technology, said she wasn’t surprised.

“These are very active areas for the organized far right movement,” Perry said. “Their very visibility and blatancy, I think, over the past couple of years, has contributed to that normalization of hate, that normalization of negative sentiment directed at targeted communities.”

Maclean’s analyzed numbers from police services covering a population of 50,000 people or more in order to avoid large fluctuations in the hate crime rate caused by one or two additional incidents in small towns. The analysis is based on a more detailed version of the annual hate crime data posted publicly by Statistics Canada in late November.

The increases are part of a drastic nation-wide rise in hate crime, with Statistics Canada reporting 47 per cent more incidents from 2016 to 2017. The data captures only hate incidents that were reported to the police.

Statistics Canada did not release data showing the type of incidents or motivations broken down at the police service level. Nation-wide, the government agency reported 38 per cent of hate crimes were violent, with criminals most likely to target Jews, Muslims, Black people and people with marginalized sexual and gender identities.


Police services in the GTA/Greater Golden Horseshoe region contacted by Maclean’sconfirmed that national trends in hate crime motivations were mirrored in their communities. Superintendent Ricky Veerappan, who oversees the York Regional Police’s diversity, equity and inclusion bureau, said the force launched an anti-hate campaign in 2016 in response to rising negative sentiment towards Syrian refugees.

Veerappan said some of the large increase in police-reported hate crimes in the York region might be because of those outreach campaigns, in addition to an increase in the incidents themselves. “People are maybe a little bit more comfortable in connecting with the police, knowing the resources that are available, knowing the numbers to call and knowing members of our diversity unit are very accessible,” he said.

Josh Fraser, public information officer with the Guelph Police Service, said his force also participates in anti-hate public education campaigns. He noted that while Guelph’s hate crime rate of 11.8 incidents per 100,000 people is the eighth highest for any police service covering a population of 50,000 or more, 12 of the city’s 16 incidents were graffiti-related and seven took place on the University of Guelph’s campus.

“The year before it was 10 [incidents],” Fraser said. “I’m not trying to downplay it, but it’s six more. It’s not like it jumped from 50 to 100.”

Perry, the hate crime expert, said it’s important to remember that a handful of additional spray-painted swastikas reported to the police in a city like Guelph likely represents a much larger increase. She said her research and studies conducted by anti-hate groups suggest the true total number of hate crimes in Canada may be five to seven times greater than the official police-reported figure.

“It’s the tip of the iceberg,” she said. “There’s something real going on there.”

Source: Canada’s 10 worst cities for hate crime

Statistics Canada — Police-reported data on hate crime and cybercrime, 2014

Hate Crimes Comparison.002In contrast to previous years, Statistics Canada does not provide a narrative analysis of what the current year reveals.

The chart above provides the data over the 2008-14 period, showing a slightly decreasing trend with respect to ethnicity related hate crimes and a corresponding slight increase in religion-related hate crimes. Overall numbers continue to remain largely flat at 1,295 (itself surprising given continued population growth).

About half are classified as mischief (612), with the remainder largely involving violence or threats of violence.

While Statistics Canada cautions against comparing year-to-year data, these trends over seven years are more reliable. Police-reported hate crime data tends to be more conservative than that collected by community organizations given the higher reporting burden on victims, so these figures likely under-estimate the number.

As is normal, the larger cities report more hate crimes (e.g., the GTA accounts for 26 percent, greater Montreal 8 percent, greater Vancouver 6 percent and Calgary also about 6 percent). On a per capita basis, larger cities tend to have lower rates than smaller centres. The table below lists communities with more than 10 hate crimes reported along with the per 100,000 rate:

cansim-2520091-eng-8622528054705954879_-_Police_Services_with_more_than_5_incidents

The variation in the per capita rate may reflect a variety of factors ranging from greater willingness to report hate crimes, a more aware police force as well as possible underlying differences.

The following chart confirms again that anti-Black hate is the most common form of ethnicity-related hate crimes: about 50 percent.

Hate Crimes Comparison.003

Religion-based hate crimes are captured in the following chart, showing once again that Canadian Jews are the most targeted. However, in 2014, the relative share for Canadian Jews declined from being in the mid-to-high 50 percent range to just under 50 percent, with hate crimes against Canadian Muslims showing significant increases in the last two years, reaching 23 percent of all religious hate crimes in 2014.

Hate Crimes Comparison.004It remains to be seen how the events of 2015 and some of the language used by the previous government in the lead-up to and during the election campaign affects this trend in next year’s report.

Source: The Daily — Police-reported data on hate crime and cybercrime, 2014

2013 Hate Crimes Statistics

Hate Crimes Comparison.001

Interesting that in 2013, the number of hate crimes fell by 17 percent, reflecting a 30 percent decline in non-violent hate crimes (mainly mischief-related). For most groups, the per capita rate remained relatively constant, with the most notable decline with respect to Canadian Jews.

B’nai Brith statistics (2014 Audit of Antisemitic Incidents) however show an increase compared to earlier years (their statistics are always higher than police-reported hate crimes).

The National Council of Canadian Muslims recently launched a similar initiative to report on anti-Muslim incidents (NCCM Launches National Hate Crimes Awareness Project) to encourage more reporting (hate crimes against Canadian Muslims increased in this year).

The explanation for the overall decline in reported hate crimes is not clear beyond that it is the minor hate crimes that account for most of the decline.

While self-reporting by different groups is important to raising awareness of, and improving confidence within groups to report hate crimes to the police, there is merit to the consistent reporting  across different groups and categories contained in this report by Statistics Canada.

Chart of the Day: Hate crimes – Five-Year Trends

Source: StatsCan Police-reported hate crimes in Canada (2008-12)

Source: StatsCan Police-reported hate crimes in Canada (2008-12)

Thanks to New Canadian Media, the Statscan 2012 hate crimes report is getting some attention (reporting Share News):

There were 82 more hate crime incidents in Canada in 2012 than in 2011. Some of the increase is partly due to improvements in reporting by some police services.

The study lists Hamilton, Thunder Bay and Peterborough as having the highest incidents of hate crime in Canada.

And the majority, or 82 per cent of hate crimes, occurred in major cities with Toronto, Montreal, and Vancouver leading the way.

Of the hate crimes reported and examined, 75 per cent had been confirmed by police as hate-motivated; and the remaining 25 per cent were recorded as suspected, Statistics Canada said.

Looking at the report, and comparing with the previous four years, some observations:

  • the overall level of hate crimes is remarkably stable (about 1,400 per year);
  • mischief continues to be the most common hate crime;
  • race and ethnicity continue to account for around 50 %;
  • black victims consistently account for about 40 %;
  • Jewish victims range from 53 to 71%, with no trend line ;
  • Muslim victims range between 9 and 15%, similarly with no trend line; and,
  • while victims of hate crimes, save for sexual orientation, are relatively distributed in terms of age, those accused of hate crimes are overwhelmingly young. In both cases, males are predominant.

Some of the disparities in reporting rates (these are police reported hate crimes) reflects the comfort different communities have in reporting to the police.

Muslim hate crimes are likely relatively under-reported given the newness of the community to Canada and likely trust issues with the police.

In contrast,  Canadian Jews are more well established and comfortable reporting to the police, in part given the work of B’nai Brith.

Hate crimes increasing against Blacks and Jews – StatsCan | Share News.

Direct link to the StatsCan report (worth reading):

Police-reported hate crime in Canada, 2012