New Crop of Immigrants in Parliament Is Seen as Reflection of Canada – The New York Times

New York Times coverage of Canada’s many immigrant and visible minority MPs (and always nice to be quoted!):

Many factors contributed to the sweeping victory last month by the Liberals, whose leader, Justin Trudeau, will take office as prime minister on Wednesday. But several analysts said that one of the most important factors was the immigration and refugee policies of the losing Conservative government.

In a country that generally prizes immigrants as a source of economic growth and officially encourages newcomers to maintain their ethnic identities, the Conservatives and Prime Minister Stephen Harper were widely seen as anti-Muslim, especially after they made an issue of the face coverings worn by some Muslim women.

“The Conservative government tried to use wedge politics, but in the end, it backfired,” said Andrew Griffith, a former director general of the government office that oversees citizenship matters and the author of a book about multiculturalism in Canada. “It should give any political party in Canada food for thought, food for reflection.”

The move was uncharacteristic even for the Conservatives, who assiduously courted immigrant communities even before they first won power in 2006, particularly in two areas that often decide the balance of power in Parliament: the suburbs of Toronto and Vancouver, British Columbia. The Liberals and the New Democratic Party also seek support there, but the Conservatives often found that their more traditional approach to many social issues found an eager audience.

Canadian law makes it relatively easy to move from landed immigrant to citizen, and Mr. Griffith said that many newcomers became politically active once they could vote. Because Canada’s immigration rules favor well-educated and affluent migrants, ethic communities are also an important source of donations to political parties, not least because the country’s campaign finance laws ban contributions from corporations or unions and set a relatively low ceiling for individuals.

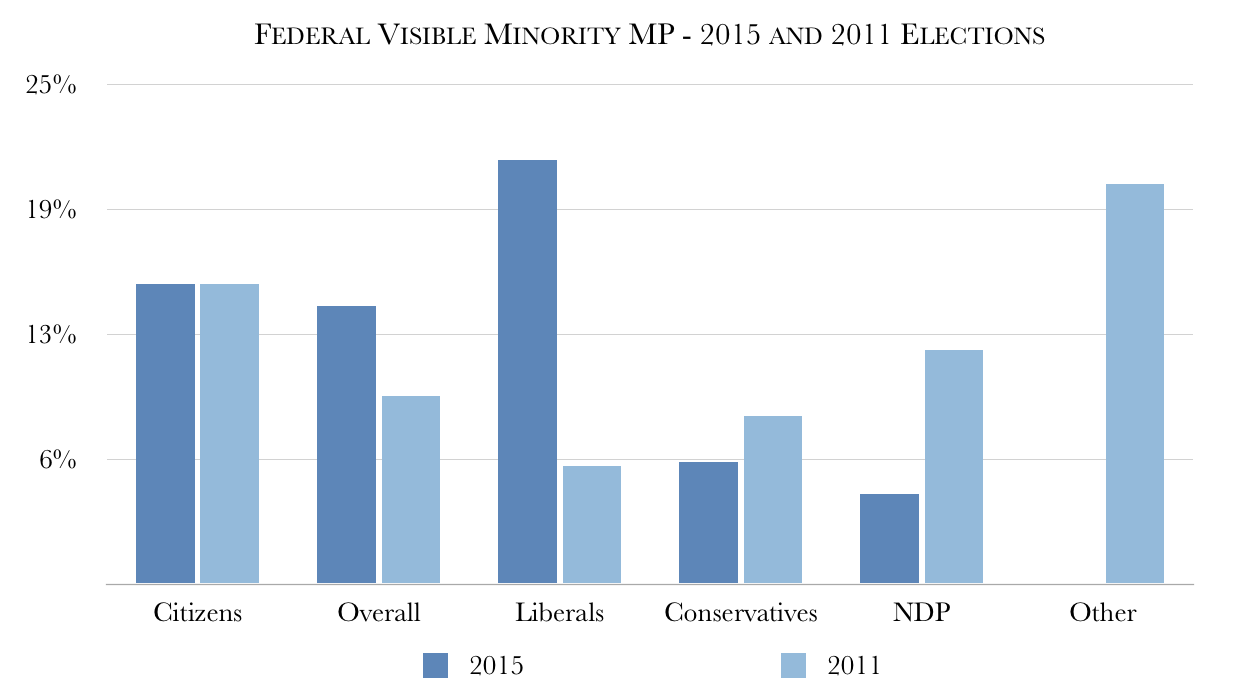
“It’s empowering in that there are groups that can no longer be ignored,” said Arif Virani, 43, a newly elected Liberal lawmaker from Toronto who came to Canada with his parents as an Ismaili Muslim refugee from Uganda in 1972. He noted that in some constituencies, all three major parties ran minority candidates.

At times over the past decade, Jason Kenney, a Conservative cabinet minister, seemed to be appearing at just about every ethnic celebration in the country — a butter-chicken circuit that appeared to take a toll on his waistline. But Mr. Kenney’s courtship of ethnic minorities, Mr. Griffith said, was undone when the Conservative government decided to make it harder for recent immigrants to bring in relatives, when it was slow to accept Syrian refugees and when it tried to ban the niqab, or face covering, during citizenship ceremonies. Mr. Harper’s use of the phrase “old-stock Canadians” on the campaign trail made matters worse.

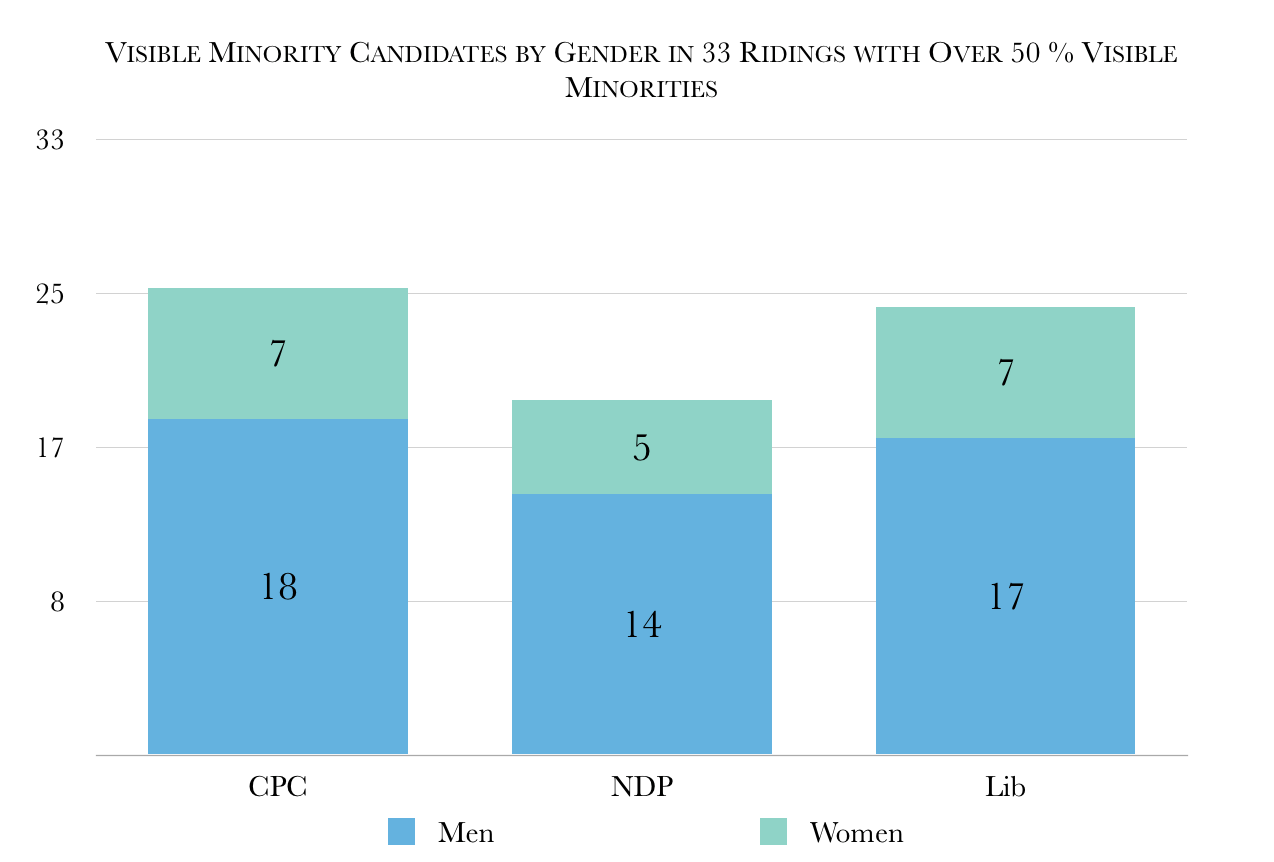
Mr. Griffith reckons that there are 33 electoral districts where a majority of voters belong to what are known in Canada as visible minority groups — people who are not of white European extraction. All 33 districts are in the suburbs of Toronto or Vancouver, and many were held by Conservatives until last month, when Liberals won in all but three of them.

Canada first introduced a policy of official multiculturalism, recognizing the differences in Canadians’ heritage, in 1971 under Pierre Elliott Trudeau, a Liberal prime minister and the father of Justin Trudeau. Initially, the policy provided funds for programs like language classes, but it has since evolved into a broad legal protection of religious and ethnic differences.

Though it was contentious at first, the policy is now frequently cited by Canadians as a defining characteristic of their country — though both Mr. Griffith and Mr. Virani say it has limits.

Canadians tend to think that, where the United States assimilates immigrants’ cultures in a melting pot, Canada allows all cultures to flourish. But Mr. Virani said that the contrast was “a little bit more gray than that.”

Voters appeared to reject Mr. Harper’s plan to ban face coverings during citizenship ceremonies, but Mr. Griffith said there was still widespread unease about the practice of wearing them, which many Canadians believe limits the participation of Muslim women in society.

Still, despite the tenor of the Conservatives’ last campaign, all the major Canadian political parties favor encouraging immigration. New arrivals account for two-thirds of Canada’s population growth, an important factor in a country where there are now more citizens over 65 than under 15. Geography helps form that pro-immigration consensus by making it difficult to slip into the country as an illegal immigrant or a refugee.

“You can’t walk to Canada, apart from the U.S., so we don’t have a neighbor that generates a lot of refugees or immigrants coming across,” Mr. Griffith said. “That helps the discussion.”

Source: New Crop of Immigrants in Parliament Is Seen as Reflection of Canada – The New York Times

My article: Visible minorities elected to Parliament close to parity, a remarkable achievement

My article in today’s Hill Times (note updated 25 Oct with the addition of one Conservative MP):

In contrast to the 2011 election, where 9.4 percent of all MPs were visible minorities, 2015 representation is aligned to the number of visible minority citizens (14 percent compared to 15 percent). Moreover, the success of the Liberal Party in decisively winning the visible minority vote  suggests that the Conservative Party’s extensive outreach to immigrant and visible minority communities had limited impact in stemming losses, and that concerns over the impact of changes to citizenship and immigration may have played a part.

Moreover, the percentage of visible minorities elected was identical to the percentage of visible minority candidates, which also had increased to 14 percent from 10 percent in the elections of 2004, 2006, 2008 and 2011 (see Visible Minority Candidates – 2015 Election – Background Note for details). The Liberal party had the most visible minority candidates (16 percent) with the Conservative party and the NDP had slight under-representation (13 percent)

For comparison, the number of women and Aboriginal MPs only slightly increased in 2015. Analysis by Equal Voice shows the number of elected rose from 25 percent in 2011 to 26 percent today (88 women). Representation of Aboriginal peoples also increased to 10 seats (3 percent) from 7.

To assess visible minority representation I have used candidate names, photos and biographies to identify visible minority candidates. Although not as exact as identifying women candidates (e.g., subjectivity in analyzing photos), it nevertheless provides a reasonably accurate indication of how well Canadian political party candidates represent the population of visible minorities who are also Canadian citizens (15 percent). I was not able to break this down by those who are first generation immigrants and those who were born in Canada (second generation).


Federal Election 2015 and 2011 ComparisonThe chart above contrasts the 2015 visible minority representation with the 2011 election results. Not surprisingly, the Liberals, given their overall strong election result, will have the caucus with the largest number of visible minority MPs: 39 or 21.2 percent, significantly above the percentage of visible minority citizens (and Liberal candidates). Conversely, given their poor results, both the Conservatives and the NDP elected less than half of their visible minority candidates.

Federal Election 2015 VisMin Mps GenderLooking at 2015 results only, the chart above provides the comparative numbers for each party in the 47 ridings that elected visible minority MPs, minority, broken down by gender. As others have noted, given that the overall number of visible minority MPs is comparable to the number of visible minority candidates (14 percent), visible minority candidates ran in ridings where they can be elected,.

While 23 of these 47 MPs come from ridings where 50 percent are visible minority, 15 come from ridings between 20 to 50 percent visible minority. Surprisingly, nine come from ridings with less than 20 percent visible minority, and five of those with less than five percent. In other words, visible minorities were even elected in ridings where over 80 percent are non-visible minorities.

Visible minority MPs are 68 percent men, 32 percent women, higher than the percentage of all women MPs (26 percent).

Liberal visible minority candidates won 39 seats (83 percent), the Conservatives five (13 percent), the NDP 2 (4 percent).

Table 1 2015 Election – List of Visible Minority MPs lists the ridings, their percentage of visible minorities, and the MPs elected.

Turning to the 33 ridings where visible minorities comprise more than 50 percent of the population  (which we will call visible majority ridings), the following characteristics emerge:

  • Both two-thirds of candidates (68) and two-thirds of elected MPs (23) are visible minority;
  • 48 percent are visible minority men, 21 percent visible minority women;
  • The Liberals took all but three of these ridings (two went Conservative, one NDP);
  • The popular vote for these 33 ridings shows stronger support for Liberals among visible majority ridings (52.3 percent) compared to overall results (39.5 percent). Riding-by-riding, the winning Liberal candidate won over 50 percent of the vote, a majority not just a plurality;
  • In contrast, the popular vote for the Conservatives in these ridings is virtually identical (31.6 percent) to their overall results (31.9 percent). It would appear their base vote is the same among visible minorities as the general population.
  • The NDP did less well in these ridings (15.9 percent) compared to their overall results (19.7 percent);
  • Out of the 9 ridings where Chinese Canadians formed the dominant group, 3 Chinese Canadians were elected. In contrast, out of the 14 ridings where South Asians formed the dominant group, 8 were elected, mainly Sikh Canadians; and,
  • 10 non-visible minority MPs were elected in these ridings.

Table 2 2015 Election – 33 Ridings more than 50 percent visible minorities provides the demographics of these ridings, along with the names of elected MPs and their share of the popular vote.

Implications

In many ways, this is a remarkable achievement, achieving close to parity in parliamentary representation of visible minorities. No other comparable country is as representative of its population.

Visible minority MPs, as all MPs, will be expected to play not only on the issues of interest to their constituents but also on broader policy issues and debates. And hopefully, the incoming government will provide greater latitude for all MPs for debates and discussion, rather than the excessive reliance on centralized talking points under the Conservative government.

They can be expected also to play on foreign policy and diaspora issues of interest to their community, much as other ethnic communities such as Ukrainian Canadians and Canadian Jews continue to do.

Secondly, with 39 visible minority MPs in the incoming Liberal government, we will need to see how many are appointed to cabinet and to which positions, and how this is balanced against other cabinet representation issues like regional representation (PM Trudeau has already committed to gender parity). The Conservative government relegated visible minorities to junior positions (multiculturalism, sport, seniors) and it remains to be seen whether Liberal Prime Minister Trudeau will appoint a visible minority member to a more senior position.

Thirdly, the Conservative party needs to reflect on the effectiveness of the extensive outreach of Minister Kenney and others to new Canadian communities. Being 20 percent behind the Liberals in many of these ridings means that ‘being there’ is not enough. While some of this shift reflects the general trend in urban Canada, it also likely reflects changes to citizenship and immigration policy which impact on these communities (e.g., more difficult family reunification and citizenship). And overplaying the niqab and related issues in such an obvious wedge politics manner can hardly have helped.

One thing is clear. Visible minorities are an intrinsic part of electoral and political strategies. No party can afford to ignore them, given their size and political weight. And one of the election’s lessons is that the divisiveness of wedge politics is not a winning strategy among visible minority and other voters. Hopefully, that will be an enduring lesson, sparing Canadians of whatever origin, of such approaches in the future, and strengthening overall integration.

Source: Visible minorities elected to Parliament close to parity, a remarkable achievement | hilltimes.com

Canada federal election candidates include more visible minorities in 2015 than in the past four votes | National Post

More on visible minority candidates, with good commentary by Erin Tolley, Chris Cochrane and Priya Ramanujan:

Notably, this is the first time that the proportion of visible minority candidates in Parliament reflects the per cent of visible minority candidates who ran for election. Usually, a far greater proportion runs than is actually elected, said Erin Tolley, an expert on visible minorities in Canadian politics at the University of Toronto.

“It’s great to benchmark how many arrive in Parliament, but also to think about the mechanism through which they got there,” added Tolley, explaining that the success of visible minority MPs may have had more to do with the Liberal wave than with conscious effort. In 2011, the NDP were hailed for bringing several young MPs into Parliament, but they had “won by accident, by surprise” because of an unexpected surge of support in ridings they hadn’t expected to win.

Thirty nine visible minority MPs, the bulk of those elected yesterday, belong to the Liberal party, which has long had the support of more visible minorities than the other major federal parties.

“A Liberal victory like we saw last night unsurprisingly is going to return a particularly high number of visible minority candidates to Parliament,” said Cochrane.

“As visible minorities become more entrenched, they’re here for many generations. They’ve been living in their neighbourhoods for decades. That’s all a recipe for increased engagement in federal politics,” he added.

Priya Ramanujam, production editor of New Canadian Media, a news website focused on immigrants, said she’s seen such change unfold in her own neighbourhood, which is part of the GTA’s Scarborough North riding.

Until 2011, the area, where more than 70 per cent of voters belong to visible minorities, was represented by a non-visible minority MP. This year all three major parties ran visible minority candidates. And it’s not just the parties who are trying to get more in tune with locals.

“I have definitely noticed an increase in people getting involved in politics, both young people and adults right up to seniors, and that’s across ethnicities,” said Ramanujam, who says that youth are far more engaged than when she was in high school in the late 1990s and early 2000s.

But Tolley said what happens next will dictate how much influence visible minorities have in practice. “To me, a commitment to diversity and equality goes beyond just putting people in the House of Commons. It means giving them a voice of power,” she said.

Visible minorities held token positions under the previous government, she said. “There were visible minorities sitting in cabinet, but those visible minorities had cabinet portfolios that were extremely limited.”

“The visible minorities that tend to get access to power are not the full range of people of colour that we see in Canada,” added Tolley, warning that advancements for minorities in general can distract from the plight of marginalized groups, such as Black Canadians, very of few of which have been elected to parliament.

The Oct. 19 election saw the three major parties field more visible minority candidates than in the past four federal elections, according to a study by Andrew Griffith, former director general for citizenship and multiculturalism at Citizenship and Immigration Canada. The National Post used data from the study to tally the number of visible minority MPs.

In total, 143 of the 1014 candidates that ran for the Conservative, Liberal and NDP parties belong to a visible minorities with 68 of them running in 33 ridings where more than half of residents belonged to visible minorities.

Source: Canada federal election candidates include more visible minorities in 2015 than in the past four votes | National Post

Record number of visible minority MPs elected to Commons

A dramatic increase from the 2011 election. In addition to the overview, some good personal vignettes of newly elected visible minority MPs.

Visible_Minority_MPs_-_2015_Election

I am working on a more detailed analysis that should be ready in a day or so but the chart above provides the overall numbers by party:

Their family histories and beginnings tie them to countries plagued by conflict and upheaval, but in Canada they are making history: the first-ever MPs of Afghan, Somali and Iranian heritage.

Those firsts come on the back of a jump in visible-minority representation in the incoming 42nd Parliament – a measure of growing integration and participation among minority communities. At least 46 visible-minority MPs were elected on Monday, the vast majority of them being Liberal. That figure is 13.6 per cent of the total of 338 seats.

That is a record for visible-minority representation, according to data going back to 1993. Research by now-retired McGill University political scientist Jerome Black showed that the 2011 election was what he called the high watermark – when 28 visible-minority MPs were elected, representing 9.1 per cent of the total number. But 2015 has surpassed that total.

“Having visible minorities in Parliament, whether first- or second-generation, helps ensure their perspective is part of [the] discussion and debate,” said Andrew Griffith, a former federal Canadian civil servant who worked on issues of multiculturalism and citizenship.

“It also facilitates greater identification with Canadian political institutions among visible minorities as they can see themselves reflected in these same institutions,” he added.

Some experts argue that the visible minority representation in the incoming parliament still falls short of the 19 per cent that make up Canada’s total visible minority population.

Source: Record number of visible minority MPs elected to Commons – The Globe and Mail

Study says Canada’s three major parties are fielding more visible minority candidates | National Post

My short study quoted in the National Post, along with Chris Cochrane’s analysis (I will do a piece tomorrow analyzing the results and how many visible minority candidates were elected):

Fourteen per cent of the 1014 candidates – or 143 possible Members of Parliament – running for the Conservative, Liberal and NDP parties are members of visible minorities, according to an analysis by Andrew Griffith, former director general for citizenship and multiculturalism at Citizenship and Immigration Canada.

The proportion of visible minority candidates is roughly on par with the electorate, 15 per cent of which consists of visible minority voters.

“All parties are trying to compete for this (visible minority) vote,” says Griffith, who has written a book on multiculturalism in Canada.

Griffith’s study found the Liberals were leading with sixteen per cent of Liberal candidates – or 55 candidates – from visible minorities. The Conservatives and the NDP were lagging behind with 44 visible minority candidates each, amounting to 13 per cent of their total candidates. The Bloc Quebecois fare the worst, with only two visible minority candidates.

The Liberal lead is unsurprising given that “multiculturalism is part of their DNA,” says Griffith.

Visible minority representation is even higher in the 33 ridings in which more than half of the residents are from visible minorities. In these areas, 68 of the 99 major party candidates, including 19 women, are from visible minorities. All of the major parties are represented by a minority candidate in 15 of these ridings.

“These are all battleground ridings where all three parties, at least at the beginning of the campaign, were reasonably competitive,” says Griffith.

Twenty-three of these 33 ridings are in the Greater Toronto Area, a key battleground for the major parties. In these ridings, the Conservatives are fielding the most visible minority candidates, with 25 in the race, but are closely followed by the Liberals, who are running 24 candidates. The NDP lag behind with 19 candidates.

“You really have to hand it to (Conservative) Jason Kenny and the people who have made that outreach in those communities,” says Griffith.

But Chris Cochrane, a political science professor at the University of Toronto, says it’s important to distinguish between immigrants and visible minorities, some of whom may have lived in Canada for generations and make up a Liberal stronghold.

“Conservatives increased their vote share spectacularly among immigrants going into the last election but they didn’t do nearly so well among visible minorities,” he says.

Source: Study says Canada’s three major parties are fielding more visible minority candidates | National Post

Visible Minority Candidates in the 2015 Election: Making Progress

Is the increased number of visible minorities being reflected in party candidates? Which ridings are these candidates running in? And do these candidates reflect the largest groups in their ridings?

Now that we know the names of all candidates, we can answer these and related questions.

But first, as a basis for comparison, how has women’s representation increased in 2015 candidates? The analysis by Equal Voice shows that overall representation from the 2011 election has slightly increased from 31 to 33 percent (still far away from equality), with the relative ranking of parties below.

Women Candidates 2015 Election

To assess visible minority representation I have used candidate names, photos and biographies to identify visible minority candidates. Although not as exact as identifying women candidates (e.g., subjectivity in analyzing photos), it nevertheless provides a reasonably accurate indication of how well Canadian political party candidates represent the population of visible minorities who are also Canadian citizens (15 percent).

Building on an earlier study by Jerome Black (“Racial Diversity in the 2011 Federal Election: Visible Minority Candidates and MPs”) showing the diversity in earlier elections, I went through the candidate lists using the criteria above, concentrating on the more diverse ridings.

Out of a total of 1014 candidates for the three major parties, 142 or 13.9 percent were visible minorities. The chart below shows a growth in visible minority candidates for the three major parties plus the Bloc.

VisMin Candidates 2004-2015.001

For the 2015 election, the Liberal party has the most visible minority candidates, slightly greater at 16 percent than the number of visible minority voters who are citizens. The Conservative party and the NDP have slight under-representation (13 percent) while the Green party has greater under-representation (11 percent). The Bloc québécois only appears to have a two visible minority candidates (under three percent of Quebec’s 78 seats).

The chart below provides the comparative numbers for each party in the 33 ridings that are more than 50 percent visible minority, broken down by gender.

VisMin Candidates Top 33 RidingsAdditional characteristics of these ridings, in terms of the candidates, include:

  • Out of the 99 candidates from the three major parties, 68 are visible minorities (over two-thirds). These account for just under half of the 142 visible minority candidates in all ridings.
  • 19 candidates are women (19.2 percent)
  • In 15 of these ridings, all major party candidates are visible minorities;
  • Only one riding, Scarborough Guildwood, has no visible minority candidates;
  • The Conservative Party has the most visible minority candidates (25), followed by the Liberal Party (24) and the NDP (19); and,
  • In general but by no means universally, many candidates come from the larger communities in these ridings, particularly South Asian ridings as this table 2015 Ridings with More than 50% Visible Minorities and Their Candidates shows.

Happy election viewing and seeing how these (and other) ridings go.

Myth-busting ridings: Shedding light on visible minority women in federal politics

Worth noting (apart from my book being quoted!):

A new myth-busting study by Equal Voice, a national, multi-partisan organization dedicated to electing more women to all levels of political office in Canada, provides a fresh way of looking at female representation on the federal stage. In analyzing Canada’s 33 most ethnically diverse ridings, they found that, contrary to stereotypes that visible minority communities are less open to women leaders, representation of female visible minority candidates is far higher than that of the non-visible minority candidate pool. Part of the reason? Political parties cultivate visible minority women in these communities in a way we don’t see them do with so-called “old stock” Canadians, to employ the risible term used by Stephen Harper in a recent leaders’ debate.

The Equal Voice study was undertaken to determine candidate diversity in diverse ridings, says its executive director Nancy Peckford. Researcher Grace Lore, a Ph.D. political science student at the University of British Columbia, crunched data on 33 ridings where more than 50 per cent of the population is visible minority as identified by Andrew Griffith in Multiculturalism in Canada: Evidence and Anecdote —23 ridings in Ontario, eight in B.C., one in Quebec and one in Alberta. Forty per cent of visible minority candidates were women; among candidates of the non-visible minority pool, women comprised just 21 per cent. These aren’t lame-duck contenders, says Lore: “Many of the visible minority women in those 33 ridings are absolutely in winnable ridings.”

Parties are strategic in these ridings, says Peckford, many of which are battlegrounds in the current federal campaign: “Parties inherently understand that to be competitive they need to reflect the community back to them,” she says. “I think there is a lot of diligence to ensure they’re choosing candidates who have fairly comprehensive reach.” The effort seems to be encouraging women to come forward, she says: “It’s auspicious. We need more of it.”

Asked why less diverse ridings don’t field women, Peckford is quick to answer: “I don’t think they have to try as hard,” she says.

The study’s finding is consistent with research documenting that female visible minority MPs are better represented in Parliament than in the general population. A 2008 study, “Ethnoracial minorities in the 38th Parliament: Patterns of change and continuity,” by Jerome Black reveals that representation of minority women doubled between 1993 and 2004, from just 4 per cent to 8 per cent (though, as Lore points out: “that’s hardly a level to cheer about”). By 2004, minority women comprised 40 per cent of minority MPs. “Given that, in 2004, women overall comprised just 21 per cent of all MPs, that’s pretty incredible,” Lore says. Minority women have done better than minority men, she points out: “So the way we can phrase this is when we do more to get more women, we end up with more diverse candidates overall.”

Have Canada’s changing demographics made it time to retire the concept of ‘visible minority’?

This issue comes up periodically. However, it would require legislative changes to the Employment Equity Act, among others, and thus would be controversial.

More substantively, the advocates are correct in noting that lumping all communities together under visible minorities does not account for the differences in outcomes of groups and that relations between different groups are as important to integration as the old mainstream/visible minority dichotomy presented.

One of Kenney’s most substantial changes to multiculturalism was to recognize this and ensure that integration meant between all communities.

Some of the traditional equity challenges remain, but given the difference in communities, more targeted initiatives are part of the mix.

See the 2011 comparative analysis by CIC: Table 5: Ethnic Community Specific Challenges.

In 2011, the percentage of visible minorities was 19.1%, according to Statistics Canada. By 2031, that number is expected to grow to 30.6%, with South Asian and Chinese immigrants driving much that growth. Vancouver and Toronto are expected to become “majority-minority” cities with three out of five people — 60% — belonging to a visible minority group by then.

Compare that to 50 years ago, when the visible minority population was just 2%, and the majority of immigrants were from Europe.

“Personally, I have never liked the term ‘visible minority,’” says Frank Trovato, a sociology professor at the University of Alberta. “I doubt that most people belonging to these groups actually think of themselves as such. It may be that in the future Canadians will simply do away with this concept.”

The official use of the term can be traced back at least as far as the 1980s when federal lawmakers established the Employment Equity Act, which set out to remove barriers in the labour market for four “disadvantaged” groups: women, aboriginals, people with disabilities and visible minorities.

The act was a response to the recommendations of the 1984 Royal Commission on Equality in Employment, led by Justice Rosalie Abella, who wrote, “Ignoring differences and refusing to accommodate them is a denial of equal access and opportunity. It is discrimination. To reduce discrimination, we must create and maintain barrier-free environments so that individuals can have genuine access free from arbitrary obstructions to demonstrate and exercise fully their potential.”

On visible minorities, Judge Abella wrote of the need to attack racism, which she described as “pervasive,” to provide language training for immigrants, to accommodate religious and cultural differences, and to find a better way to assess qualifications of those who did not attend school in Canada or who have no work experience in Canada.

Three decades later, many of the gaps in workforce representation have narrowed and there are some visible minority groups that are doing just as well as their white counterparts, says Frances Woolley, an economics professor at Carleton University, who favours retiring the term “visible minority.”

“[The Act] was written for another time … when the workforce was majority male, when the population was overwhelmingly white,” Ms. Woolley said.

There are still some groups that are disadvantaged — such as African-Canadian men — but the legislation “lumps everybody together in this visible minority category when some people are doing just fine and other people aren’t,” she said.

Have Canada’s changing demographics made it time to retire the concept of ‘visible minority’?

Canadian-born visible minority youth facing an unfair job future

Diversity by City

Some good analysis of income gaps between visible minorities and the “mainstream” by Andrew Jackson of the Broadbent Institute:

… while members of visible minority groups are more likely to be recent immigrants than other Canadians, a high and rising proportion of non-whites were born in Canada.

Forty per cent of visible minority youth age 20 to 24 were born in Canada and thus have the same educational experience as other Canadians. Many others came to Canada as young children and were mainly educated in Canada. But they still encounter greater problems in the job market than whites.

2011 was a year of partial recovery from the Great Recession of 2008-09, and the overall unemployment rate averaged 7.8 per cent.

The NHS data show that the unemployment rate in 2011 was 9.9 per cent for visible minority workers compared to 7.3 per cent for white workers, a difference of 2.6 percentage points. The difference in unemployment rates between visible minorities and white workers was significantly greater for women 10.6 per cent vs. 6.7 per cent than for men 9.3 per cent vs. 7.8 per cent.

The unemployment rate in 2011 was especially high for Arabs 14.2 per cent, blacks 12.9 per cent and South Asians 10.2 per cent.

A high level of education did not narrow the unemployment rate gap between visible minority and white workers. In fact, the gap 7.9 per cent vs. 4.1 per cent was greater for workers with a university degree.

Strikingly, there was a big difference in unemployment rates in 2011 between visible minority workers who were born in Canada and white non-immigrants – 11.8 per cent compared to 7.4 per cent.

The gap was a bit smaller but still significant for young visible minority workers age 20 to 24 born and educated in Canada and white workers in the same age group, also born and educated in Canada – 17.2 per cent compared to 14.1 per cent.

Canadian-born visible minority youth facing an unfair job future – The Globe and Mail.

Ontario election: Which party’s candidates are the most diverse?

Ontario_election__Which_party’s_candidates_are_the_most_diverse____canada_com

A study of the diversity of candidates in the forthcoming ON election:

Although women were greatly underrepresented, the racial diversity of the candidates better reflected Ontario’s population, though some fell shorter than others. In the 2011 census, approximately 30 per cent of Ontarians were described as visible minorities.

The Liberal party was closest to reflecting the number, with 24 per cent of their candidates being visible minorities. For the NDP, 19 per cent of declared candidates are visible minorities and the PCs trail with about 17 per cent representation.

Diversity was concentrated around the Greater Toronto Area, with nearly all the candidates for ridings in Scarborough and Brampton being people of colour. The Toronto downtown, though, is overwhelmingly white.

The further away from Toronto a riding is, the more likely it is to have all-white candidates. Even the Ottawa area only has three out of 14 candidates who are visible minorities.

One of the success stories of the federal Conservatives lies in recruitment and election of many first and second generation immigrants, including visible minorities (in the 2011 election, CPC visible minority candidates were 10.1 percent of total CPC candidates, see Racial Diversity in the 2011 Federal Election: Visible Minorities for more details):

Ontario election: Which party’s candidates are the most diverse? | canada.com.