Congress Can’t Solve Immigration. Maybe the States Can.

Seeing more arguments in US media regarding providing a role for states in selecting immigrants, citing Canada’s Provincial Nominee Program as a model. Given the political dynamics, hard to see this getting much traction as presume there would need to be legislative authority for such a change:

“A moral failing and a national shame.” During his 2020 campaign, that was how Joe Biden characterized America’s immigration policies in the Trump era. On his first day in office, the new president announced an ambitious reform. The U.S. Citizenship Act of 2021 would include a pathway to citizenship for undocumented immigrants. It would raise caps on legal immigration. It would increase aid for Central America. It touched all the progressive erogenous zones.

And it was dead on arrival. “It’s such a progressive wish list that it’s almost counterproductive,” a pro-immigration lobbyist told me. By summer, the reform effort had stalled, migrants were flooding the border, the Democrats were divided, and the Republicans were demagoguing. Just like always.

For the country, as well as for immigrants and their families and employers, the cost of our never-ending immigration crisis has been very high. Among its consequences was the presidency of Donald Trump, who could not have reached the White House without the disruptive energy that immigration unleashed. In fact, if you had to pick a date when America launched itself toward Trumpism, June 28, 2007, would be a good choice.

Immigration was on the floor of the Senate. A bipartisan coalition had revived what was then—and still is—the logical compromise: stricter controls at the borders and at job sites, more legal immigration (especially of skilled workers), and a path to citizenship. Had the compromise passed, “it would have changed the politics,” Jim Kolbe, who was then a House Republican representing an Arizona border district, recently told me. “It would have been seen as putting the immigration issue behind us.”

Instead, the bill failed, badly. A disappointed Mitch McConnell, then the Senate minority leader, said, “I had hoped for a bipartisan accomplishment, and what we got was a bipartisan defeat.”

Before 2007, immigration had been a controversial issue but also a normal one—susceptible to bargaining and compromise. Congress had passed major reform under President Ronald Reagan in 1986, and then a series of tune-ups in the ’90s. After 2007, paralysis set in. For conservatives, the stalemate became emblematic of the country’s inability to secure its borders and enforce its laws. For liberals, it was emblematic of the country’s inability to deal humanely with millions of immigrants. And for moderates, it was a symbol of congressional incompetence. According to the Pew Research Center, two-thirds of the public wants a pathway to citizenship and better border control. “Everyone knows what has to be done,” Kolbe told me, “but no one has the will to do it.”

This dispute has now inflamed our whole body politic. “I think the immigration debate is a bigger problem for the country than any of the failures of the immigration system,” Yuval Levin of the American Enterprise Institute told me. In other words, the country needs a resolution to the political crisis around immigration at least as much as it needs a solution to the policy mess. As long as voters believe Washington is too incompetent and venal to handle immigration, they will not trust it to do anything else, and the door will stay open to demagogues and nihilists.

So now what? Plan A, comprehensive progressive reform, will not work. Plan B, comprehensive conservative reform, will not work. Plan C, compromise, should work but has failed time and again. That leaves Plans D, E, and F: piecemeal reforms for groups such as “Dreamers” and farmworkers, and the kinds of patchwork changes that congressional Democrats were seeking to include in their budget-reconciliation package this fall. They may be the best we can do.

But there is one piecemeal proposal that deserves special attention. I think of it as Plan Z, because it reframes the whole problem.

In 2019, representative John Curtis, a Republican from Utah, introduced what he called the State-Sponsored Visa Pilot Program Act. It would have allowed a new avenue for immigration by authorizing states to sponsor people for three-year, renewable work visas. The bill found no co-sponsors and never came up for debate, but Curtis told me he intends to reintroduce it in the current Congress.

Delegating immigration authority to the states is not a new concept; Senator Ron Johnson, a Republican from Wisconsin, introduced a similar plan in 2017. According to Alex Nowrasteh of the Cato Institute, a libertarian think tank, bills seeking authority to issue work visas have been introduced in 11 state legislatures since 2008, and three such bills have been voted into law. But the federal government has ignored them.

One problem is that people just can’t get their mind around letting someone other than the federal government decide who comes and stays. You can’t have individual states picking immigrants for the whole country! What about security? What about fairness? Could a conservative state discriminate on the grounds of, say, race or religion?

But the idea is not really that dramatic. This proposal wouldn’t encroach on the existing federal systems for visas, refugees, or family reunification. Any state-sponsored work permits would be in addition to the current number. The federal government would still vet the applications and control permanent residency and citizenship. Federal law and the Constitution would still forbid discrimination.

When I asked Mitch Daniels, the president of Purdue University, in Indiana, and a former Republican governor of the state, whether policy makers there would participate in such a program, he replied with a prompt yes. “The one thing” keeping Indiana from economic competitiveness, he said, “is that we don’t have enough people with the right skills.” Besides, he added, universities and businesses can already sponsor immigrants for visas; why shouldn’t states have the same authority?

how would state-sponsored visas work? In Curtis’s 2019 version, every state would have the option of sponsoring 5,000 work visas a year, plus an additional allotment based on its population, up to a nationwide total of 500,000. No state would be obligated to sponsor anyone, so states could shut their doors if they chose to. They could favor tech workers, farmworkers, family members; they could even use their visas to temporarily legalize undocumented workers already living there. The only requirements would be that the visas couldn’t be employer-specific (so bosses couldn’t use them to blackmail workers with deportation threats) and that the immigrants holding them live and work in the state that sponsored them.

How would the plan prevent immigrants from moving out of state? Each state would be required to report where its visa holders live and work, and if it couldn’t account for them, it would lose visas the next year. States that administered their programs well would be rewarded with more visas.

In any case, immigrants who settle into jobs and communities are not all that inclined to move. In Canada, which has allowed its provinces to sponsor immigrants since 1996 and which does not restrict where visa holders reside, more than 80 percent of them stay put for more than 10 years. “The vast majority,” a government report on the program said in 2017, “have become established economically, with high employment rates and earnings that increase over time.”

Even if this system isn’t perfect, the politics would be healthier than at present, when the federal government is making decisions, or nondecisions, and the states have no voice. “We’ve been so wrapped around the axle on immigration law and policy for so long that it might be very constructive to look at it through a different lens,” Janet Napolitano, a former governor of Arizona and secretary of homeland security in the Obama administration, told me. “Maybe it avoids some of the hard lines that both sides have drawn.”

State-sponsored immigration is not a cure-all. It would not remedy Congress’s deficiencies or resolve difficult questions about border control, asylum, or citizenship. What it would do is make American communities feel that they have some influence. It might dispel the rancid air that has suffocated reform. And it might begin to free our national politics from the curse of immigration gridlock.

Jonathan Rauch is a contributing writer at The Atlantic and a senior fellow at the Brookings Institution. He is the author of The Constitution of Knowledge: A Defense of Truth.

Source: Congress Can’t Solve Immigration. Maybe the States Can.

When the ‘Silent Majority’ Isn’t White

While focus is on the USA, fundamental point regarding political diversity within minorities also applies in Canada:

In her 1990 book “Fear of Falling,”Barbara Ehrenreich detailed how the widely broadcast violence at the 1968 Democratic National Convention in Chicago led to an immediate, dramatic paradigm shift in media coverage. In the month before the event, Mayor Richard Daley had denounced the various anti-Vietnam War protest groups who were planning to converge outside the city’s International Amphitheater. When those protesters arrived, Daley fought back with his police force who, on Aug. 28, attacked protesters in Grant Park.

In scenes that would be echoed a half-century later during the George Floyd protests, the police beat, detained and intimidated everyone from the Yippies to the Young Lords to Dan Rather. In both 1968 and 2020, the press heightened its critique against the police and the mayor once they saw their own being attacked in the streets.

Then came the reckoning. Ehrenreich writes:

Polls taken immediately after the convention showed that the majority of Americans — 56 percent — sympathized with the police, not with the bloodied demonstrators or the press. Indeed, what one could see of the action on television did not resemble dignified protest but the anarchic breakdown of a great city (if only because, once the police began to rampage, dignity was out of the question). Overnight the press abandoned its protest. The collapse was abrupt and craven. As bumper stickers began to appear saying “We support Mayor Daley and his Chicago police,” the national media awoke to the disturbing possibility that they had grown estranged from a sizable segment of the public.

Media leaders moved quickly to correct what they now came to see as their “bias.” They now felt they had been too sympathetic to militant minorities (a judgment the minorities might well have contested). Henceforth they would focus on the enigmatic — and in Richard Nixon’s famous phrase — silent majority.

The following months would provide even more evidence that the media had misjudged the moment. A New York Timespoll conducted a day after showed an “overwhelming” majority supported the police in Chicago. CBS reported that 10 times as many people had written to them disapproving of their coverage of the events as had written in approval.

In response, the media class spent the next few years, in Ehrenreich’s words, examining “fearfully and almost reverently, that curious segment of America: the majority.” The problem, of course, was that the same people who had just believed the world ended at the Hudson were the same people who now would be tasked with discovering everything beyond its banks. As a result, the media’s coverage of “the silent majority” was abstract and almost mythic, which allowed it to be shaped into whatever was most convenient.

There are a couple of obvious questions here: A year after the nationwide George Floyd protests, has mass media, which I’ll define here as the major news outlets and TV networks, undergone a similar paradigm shift? And if there is a new “silent majority” whose voices must be heard, who, exactly, is it?

Are we seeing a media backlash to the summer of 2020?

A quick caveat before we go much further into this: I am generally skeptical of the types of historical matching games that have become popular these days, especially on social media, where false symmetries can be expressed through heavily excerpted screenshots or video. Just because something looks vaguely like something that happened in the past doesn’t mean that the two events are actually analogous. More important, I do not see the need to take every current injustice by the hand and shop it around to a line of older suitors — if nothing else, the act of constant comparison can take away from the immediacy of today’s problem.

But regardless of whether the comparison between 1968 and 2020 is apt, plenty of people made it. Most notably, Representative Jim Clyburn of South Carolina, who, after what was seen as a disappointing result in a handful of House races, compared the slogan “defund the police” to “burn, baby, burn” from the 1965 Watts riots and said such talk was “cutting the throats of the party.” Omar Wasow’s work on voting patterns during the civil rights movement and how the public and media responded to different images of violence also became a central part of opinion discourse.

As was true in 1968, we’ve also seen a shift in public opinion polls, perhaps confirming Wasow’s claim that while images of law enforcement committing violence against protesters will generate a significant upsurge in sympathy, images of looting and rioting will have the opposite effect. A Washington Post-Shar School poll conducted in early June of 2020 found that 74 percent of respondents supported the protests, including 53 percent of Republicans­­ — stunning results that suggested a radical shift in public opinion had taken place — and the media followed suit with an enormous amount of coverage.

Writing in The Washington Post,Michael Heaney, a University of Glasgow lecturer, wrote, “Not since the Kent State killings, in which National Guard troops shot and killed four student protesters in May 1970, has there been so much media attention to protest.” Heaney also pointed out that the coverage had been “generally favorable.” But as of this summer, polling of white Americans on support for Black Lives Matter and policing reform had reverted to pre-2020 levels. Has media coverage followed suit?

We might look at coverage of the recent New York City mayoral race as a kind of case study. The campaign of Eric Adams, a former N.Y.P.D. officer who largely positioned himself against his more progressive opponents on public safety and school issues, was cast as a referendum on last summer. The media attributed Adams’s victory in the Democratic primary almost entirely to his pro-police platform. In June, a Reuters headline read, “Defying ‘Defund Police’ Calls, Democrat Adams Leads NYC Mayor’s Race.” In July, The Associated Press wrote that Adams’s win was part of a “surge for moderate Democrats” and said the centerpiece of his campaign was a rejection of activists’ calls to defund the police.

This echoed the coverage of Clyburn’s declarations after the election and fell in with a spate of media coverage about the shift in opinions on policing. So, some regression of media sympathy toward the summer of 2020 does seem underway — although we shouldn’t believe the media underwent some fundamental change during the summer of 2020, or, for that matter, in the months leading up to the 1968 Democratic National Convention. Those moments should be seen, instead, as flare-ups that subsequently shamed the media into seeking out “the real America” or whatever.

Who is the silent majority in 2021?

In 1968, the turn in opinion came mostly at the expense of Black radicals and young protesters in favor of what was largely then assumed to be white working-class voters.

Today’s silent majority certainly does include white voters, but this time, recent coverage suggests that the media is reproaching itself for a somewhat different failing: neglecting the perspective of more-moderate voters of color.

The post-mortem of the 2020 election — in which more immigrants than anticipated, whether Latinos in Florida and Texas or Asian Americans in California, voted for Donald Trump — coincided with the need to make some sense of what had happened to public opinion after last summer. Connections were made. By the time Adams gave his victory speech, a narrative about the diverse silent majority had taken hold: People of color supported the police, hated rioting and wanted more funding for law enforcement. They did not agree with the radical demands of the Floyd protests — in fact, such talk turned them off.

There’s a lot of truth to the concerns about how much the mass media actually knows about minority voters. When the Latino vote swings from Texas and Florida came to light on election night, Chuck Rocha, a political strategist who specializes in Latino engagement, went on a media tour and placed the blame on “woke white consultants” who believed that a broad message of antiracism would work for “people of color.” As I wrote in a guest essay, a similar pattern held in Asian American communities — it turns out that Vietnamese refugees who reside in Orange County, Calif., might have different opinions on Black Lives Matter, capitalism or abortion rights than, say, second-generation Indian Americans at elite universities.

These mistakes came from a grouping error: Liberal white Americans in power, including members of the media, tended to think of immigrants as huddled masses who all shook under the xenophobic rhetoric of the Republican Party and prayed for any deliverance from Donald Trump. They did not see them as distinct populations who have their own set of political priorities, mostly because they took their votes for granted.

So, if the media is actually overlooking an entire population and sometimes misrepresenting them, what’s the big deal if it’s now correcting for this?

A few things can be true at once: Yes, the media overwhelmingly misconstrued the actual beliefs of minority voters, particularly in Latino and Asian American communities. Yes, those voters tend to have more moderate view on policing.

The problem isn’t one of description, but rather of translation. The media took a normal regression in polling numbers, mixed it with some common sense about how minority populations actually vote and created a new, diverse “silent majority.” This is a powerful tool. These unheard, moderate minorities carry an almost unassailable authority in liberal politics because of the very simple fact that liberals tend to frame their policies in terms of race. If those same objects of your concern turn around and tell you to please stop what you’re doing, what you’ve created is perhaps the most powerful rebuttal in liberal politics. Over the next few years, I imagine we will see an increasing number of moderate politicians and pundits hitch their own hobbyhorses to this diverse silent majority. The nice thing about a vaguely defined, still mysterious group is that you can turn it into anything you want it to be.

Some version of this opinion engineering, I believe, is happening with the police and public safety. There’s not a lot of evidence that Latino and Asian voters care all that much either way about systemic racism or funding or defunding the police. (Black voters, on the other hand, listed racism and policing as their top two priorities leading up to the 2020 election.) Polls of Asian American voters, for example, show that they prioritize health care, education and the economy. Latino voters listed the economy, health care and the pandemic as their top three priorities. (“Violent crime” ranked about as high as Supreme Court appointments.) If asked, a large number of people in both of these groups might respond that they support the police, but that’s very different from saying they base their political identity on the rejection of, say, police abolition. If they’re purposefully voting against the left wing of the Democratic Party, it’s more likely they are responding to economic or education policy rather than policing.

And so it may be correct to say that within the new, diverse “silent majority,” attitudes about the police and protest might be much less uniform than what many in the mass media led you to believe in the summer of 2020. It may also be worth pointing out that reporters, pundits and television networks should probably adjust their coverage to accurately assess these dynamics, just as I’m sure there were legitimate concerns with media bubbles in 1968. But it also seems worth separating that assessment from the conclusion that the media should now see the summer of 2020 as political kryptonite and cast the millions of people who protested in the streets as confused revolutionaries who had no real support.

After 1968, the mass media’s turn away from the counterculture of the ’60s and its indifference to the dismantling of Black radical groups narrowed the scope of political action. This constriction would be aided over the next decade by lurid, violent events that all got thrown at the feet of anyone who looked like a radical. When Joan Didion wrote of the Manson murders, “Many people I know in Los Angeles believe that the Sixties ended abruptly on Aug. 9, 1969, at the exact moment when word of the murders on Cielo Drive traveled like brushfire through the community, and in a sense this is true. The tension broke that day. The paranoia was fulfilled,” she was saying that all the fears of the so-called silent majority had come to pass.

We are living through some version of that today. But what seems particularly telling about this moment is that the retreat no longer requires Charles Manson, the fearmongering over Watts or the police riots at the 1968 Democratic National Convention. Those images hover above the public’s consciousness as evergreen cautionary tales; the paranoia they fulfilled will do just fine.

The question at the outset of this post, then, has a split answer: Yes, we seem to be reliving a moment of media revanchism in the name of the (diverse) silent majority, but it is also a replay of a replay, akin to filming a television screen with your phone’s camera, with all of its inherent losses in resolution, clarity and immediacy.

Source: https://www.nytimes.com/2021/08/30/opinion/silent-majority-white-media.html

Why Racial Inequities Still Persist in Health Care

Likely fewer disparities in Canada given medicare but some commonaliyies:

Two decades ago, only 9 percent of white Americans rated their health as fair or poor. But 14 percent of Hispanic Americans characterized their health in those terms, as did nearly 18 percent of Black Americans.

In recent years, access to care has improved in the wake of the Affordable Care Act, which reduced the number of uninsured Americans across all racial and ethnic groups. But the racial health gap has remained, according to a series of studies published on Tuesday in the journal JAMA.

A dismal picture of persistent health disparities in America was described in an issue devoted entirely to inequities in medicine. The wide-ranging issue included research on spending and patterns of care, comparative rates of gestational diabetes and the proportion of Black physicians at medical schools.

The journal’s editors committed to a sharper focus on racism in medicine after a controversy in June, in which a staff member seemed to suggest that racism was not a problem in health care. The ensuing criticism led to the resignation of the top editor and culminated with a pledge to increase staff diversity and publish a more inclusive array of papers.

“The topics of racial and ethnic disparities and inequities in medicine and health care are of critical importance,” Dr. Phil B. Fontanarosa, interim editor in chief of JAMA, said in a statement. He noted that JAMA has published more than 850 articles on racial and ethnic disparities and inequities in the past.

The new issue offers studies on disparities in the utilization of health care services and in overall health spending. Together, the findings paint a portrait of a nation still plagued by medical haves and have-nots whose ability to benefit from scientific advances varies by race and ethnicity, despite the fact that the A.C.A. greatly expanded insurance.

The racial health gap did not significantly narrow from 1999 to 2018, according to one study whose author said it was tantamount to “a comprehensive national report card.”

“We’re failing,” added Dr. Harlan Krumholz, the study’s senior author.

“If our national goals are to improve the population’s health and promote more health equity, then we have to admit that whatever we’re doing now is not doing the trick,” he said. “This should wake us up, and spark us to think of new and better approaches.”

Other studies in the journal teased apart factors that may be contributing to the gap, including different patterns of care-seeking. White Americans, for example, are more likely than members of minority groups to visit primary care physicians and specialists in the community, rather than a hospital or emergency room.

Source: Why Racial Inequities Still Persist in Health Care

Census Shows Sharply Growing Numbers of Hispanic, Asian and Multiracial Americans

Good overview:

Of note, particularly the significant increase of the number of people reporting they were more than one race. In Canada, the category “multiple visible minorities” is minuscule, less than one percent of the total population and only three percent of visible minorities (2016 census):

The United States grew significantly more diverse over the past decade, as the populations of people who identify as Hispanic and Asian surged and the number of people who said they were more than one race more than doubled, the Census Bureau reported on Thursday.

Overall population growth slowed substantially over the past decade, but the growth that did occur — an increase of about 23 million people — was made up entirely of people who identified as Hispanic, Asian, Black and more than one race, according to the data, the first racial and ethnic breakdown from the 2020 census.

The white population declined for the first time in history. People who identify themselves as white on the census form have been decreasing as a share of the country’s population since the 1960s, when the United States lifted strict ethnic quotas aimed at keeping the country Northern and Western European.

That drop, of 2.6 percent, was driven in part by the aging of the white population — the median age was 44 in 2019, compared with 30 for Hispanics — and a long-running decline in the birthrate. Some social scientists theorized that another potential reason for the decrease was that more Americans who previously identified as white on the census are now choosing more than one race.

The single biggest population increase was among people who identified as more than one race, a category that first appeared on census forms 20 years ago, and now is the fastest-growing racial and ethnic category.

People who identify as white now make up 58 percent of the population, down from 64 percent in 2010, and 69 percent in 2000.

“We are in a weird time demographically,” said Tomás Jiménez, a sociologist at Stanford University who writes about immigrants, assimilation and social mobility. “There’s more choice about our individual identities and how we present them than there has ever been. We can presume far less about who somebody is based on the boxes they check compared to previous periods.”Where the Racial Makeup of the U.S. Shifted in the Last DecadeMaps show a rise in the share of people of color in nearly every county across the United States, as the nation records its first drop in the white population.

The data also showed that just under a majority of people under the age of 18 checked boxes other than white — multirace, Hispanic, Asian, or Black — a milestone that is the result of a substantially more diverse younger American population. A decade ago, 65 percent of children were white. Overall, the number of Americans under the age of 18 declined, partly an effect of the drop in the birthrate, according to William Frey, chief demographer at the Brookings Institution.

Thursday’s numbers provide this census’ first picture of changes in the American population below the level of states.

The five largest cities in the country are now New York, Los Angeles, Chicago, Houston and Phoenix. Philadelphia is now the sixth largest city, bumped from fifth by Phoenix, which was the fastest growing of the top 10 largest cities. Its population rose by 11.2 percent.

The Villages, a retirement community in Florida, was the fastest-growing metropolitan area in the country over the decade.

The data, charting which parts of the country have seen growth and decline, have a practical use in politics. They are the basis for redistricting, a process in which state legislatures redraw voting lines based on changes in their states’ populations.

The new data show that Hispanics accounted for about half the country’s growth over the past decade, up by about 23 percent. The Asian population grew faster than expected — up by about 36 percent, a rise that made up nearly a fifth of the country’s total. Nearly one in four Americans now identifies as either Hispanic or Asian. The Black population grew by 6 percent, an increase that represented about a tenth of the country’s growth. Americans who identified as non-Hispanic and more than one race rose the fastest, jumping to 13.5 million from 6 million.

And in what appears to be a big shift in how Hispanics think of their racial identity, one third of Hispanics reported being more than one race, up from just 6 percent in 2010. That means that Hispanics are now nearly twice as likely to identify as multiracial than as white.

Hispanic origin is counted as an ethnicity, and is a distinct category from race. But Hispanics can also check race boxes.

Richard Alba, a sociologist who has studied demographics and the fluidity of racial categories, said the rise in multiracial Americans was a logical extension of the substantial mixing that has been happening for years in the United States.

Among Asians and Hispanics, more than a quarter marry outside their race, according to the Pew Research Center. For American-born Asians, the share is nearly double that.

The jump in the multirace category is partly to do with the Census Bureau collecting more detailed data, Professor Alba said, and analyzing answers more deeply. He said he believed that part of the decrease in the white population was people switching from the category of white to the category of more than one race.

“The census is doing a much better job at reflecting the growing complexity of the population,” he said. “They are really trying to acknowledge that the world is changing out there.”

The nation has been growing more diverse for decades, but recently the pace has accelerated. Non-Hispanic white people accounted for 46 percent of population growth in the 1970s, 36 percent in the 1980s, 20 percent in the 1990s, but just 8 percent of the growth in the first decade of this century and now zero in the 2010s.

Immigration is a force that has bolstered the American population, and boosted the economy, bringing a younger work force that is helping support a growing older population.

Despite the dramatic slowdown in immigration at the end of the decade, the proportion of U.S. residents born in foreign countries is still at its highest point since the last big immigration wave around the turn of the 20th century.

Immigrants who have arrived in more recent years have largely been from countries in Asia and Latin America and have tended to settle in large cities, like New York and Los Angeles.

But over time, Hispanic and Asian immigrants and their children have fanned out broadly across the country, to smaller towns and rural areas.

That migration has helped support the numbers of people in rural places: Over the past decade, rural places lost both Black and white residents — their populations in those places each dropped by about five percent — but the numbers of people who identify as Hispanic and Asian continued to rise. In 2000, Hispanic and Asian residents made up just 6 percent of the rural population. Now it’s nearly 10 percent.

But that increase was not enough to stem the tide out of rural places, which ultimately lost population over the decade, a change from the previous decade, when rural places made modest gains.

The biggest winners in population growth were suburbs and retirement communities in the South and the West. In counties considered to be retirement destinations, the population jumped by 17 percent.

Industrial cities in the Midwest and Mid-Atlantic regions saw the biggest population losses, places such as Saginaw, Flint and Detroit in Michigan; Gary, Ind.; and Youngstown, Ohio.

The counties that have changed the most demographically over the past decade tended to be places that started out overwhelmingly white. Counties like Luzerne in Pennsylvania and Forsythe in Georgia are among the biggest gainers of diversity since 2010. Also high on the list are two counties in North Dakota, Cass and Ward, and Livingston Parish in Louisiana.

Now, about 98 percent of Americans live in a county with an increasing number of Latinos, and 95 percent live in a county where the Asian population is on the rise. Diversity is rising in 19 out of every 20 counties.

Still, growth slowed dramatically, even for Hispanics and Asians, driven in part by declining birthrates, as well as a drop in immigration. For example, the population of Asian people grew at just half the rate of the previous decade, when it rose by about 43 percent. Growth in the Hispanic population had an even steeper decline.

Growth in the Black population slowed too, but was still broad. All but nine states gained Black residents and the Black share of the population went up in 32 states. While half the nation’s population growth occurred in the South, 70 percent of Black population growth occurred in those states. The vast majority of the Black population growth was suburban. It increased by 6 percent overall but 12 percent in suburban neighborhoods.

And in a new twist likely to draw demographers’ attention, the Black population fell in Black-majority neighborhoods but rose in neighborhoods where Black people made up less than 10 percent of the population.

The white population may have declined nationally, but it grew in certain parts of the country. As in previous decades, the vast majority of white population growth occurred in neighborhoods that were mostly white to begin with — largely exurbs at the outer edges of metro areas.

Nearly three dozen states lost white population and all but the District of Columbia, which is treated as a state for statistical purposes, saw the share of white residents drop.

Race may be socially constructed but the understanding of it has important political effects. One change that has been politically resonant has been the shrinking share of the white population, with the right seeing the shift as a threat and the left celebrating it as a kind of demographic destiny in which growing numbers of people of color will vote for Democrats.

Professor Jiménez, whose county, Santa Clara, in California, became minority white more than 20 years ago, said these two views are most common among highly politicized Americans, and that most people don’t notice diversity.

“You go to places that have been majority-minority for a long time and the diversity is banal — it’s not like everyone has bumper stickers saying celebrate diversity,” he said. “It’s not something they celebrate or panic over. It’s mostly just a fact of life.”

Source: https://www.nytimes.com/2021/08/12/us/us-census-population-growth-diversity.html?action=click&module=Top%20Stories&pgtype=Homepage

American Muslims Are 2 Times More Likely To Have Attempted Suicide Than Other Groups

Of note. Wonder if there are compable studies for Canada:

For an entire year that involved emergency room visits, legal proceedings, involuntary unemployment and the death of loved ones, Mehran Nazir struggled with a depressive episode. He would find his mind flooded with self-destructive thoughts. He’d faintly hope his plane from Newark to San Francisco would crash or that he would doze off at the wheel of his car and end up in a fatal accident.

The normally extroverted Nazir would lie paralyzed in bed for hours doing nothing, not wanting to speak with family and canceling plans with friends.

It came to a head when Nazir found himself on the brink of suicide. In his darkest moment, he drafted a will and decided where it would happen.

Eventually, Nazir found comfort in journaling. And when he shared his writings online, he quickly found that other Muslims shared his struggles.

“I realized that this is not something that is unique in my history,” Nazir told NPR. “This was not a random occurrence.”

Nazir was right. U.S. Muslims are two times more likely to have attempted suicide compared with other religious groups, according to a study published last month in JAMA Psychiatry. Nearly 8% of Muslims in the survey reported a suicide attempt in their lifetime compared with 6% of Catholics, 5% of Protestants and 3.6% of Jewish respondents.

“Anecdotally and in clinical settings, we’re definitely seeing an uptick in suicides and suicide attempts,” Dr. Rania Awaad told NPR. She’s the director of the Muslim Mental Health & Islamic Psychology Lab at Stanford University and a researcher on the study.

At the heart of these numbers are several issues

Researchers attribute the high suicide attempt rate to two factors: religious discrimination and community stigma — both of which, they say, prevent Muslim American communities from seeking mental health services.

Earlier this year, a murder-suicide involving a Muslim family in Allen, Texas, sent shock waves through the community. Brothers Farhan Towhid, 19, and Tanvir Towhid, 21, both of whom reportedly battled depression, made a pact to die by suicide and kill the rest of their family so they wouldn’t have to live with the grief. Since then, public discussions on mental health, trainings on suicide response and healing circles have taken on new urgency.

“We have a very long way to go,” Awaad said. “There is just the beginning of a discussion that is happening now.”

There’s still a community stigma surrounding mental health

Naureen Ahmed, now 39, remembers how her family would visit her mother, Seema, at a psychiatric hospital. But the family never openly discussed why she was there.

Some days, Seema would sing along to Bollywood music at home wearing red lipstick. Other days, she’d walk around the house brandishing knives — or jump out of the car on the highway, threatening to kill herself.

Ahmed, a social butterfly at school, was hesitant to invite friends over because she never knew which side of her mother she would get that day.

It wasn’t until she was 25 that Ahmed finally learned why her mom acted that way: she had bipolar depression and schizoaffective disorder, her grandparents told her.

“It was difficult to say it out loud, this secret that I had held inside my entire life,” Ahmed told NPR.

Of the many factors that prevent families or individuals from seeking mental health treatment, stigma is “perhaps the most significant,” according to a 2013 study that looked at the cultural backgrounds of Muslims.

“If you believe that your mental illnesses will bring shame on you or your family, then you tend to stay silent about it,” said Dr. Farha Abbasi, founder of the Muslim Mental Health Conference. Through the conference, hosted by Michigan State University for 13 years, Abbasi hopes to destigmatize mental illness within the Muslim community using open dialogue.

After Ahmed’s mother died in 2012, she created SEEMA to support families like hers who are shamed by the stigma of mental illness, are isolated by their communities or are suffering alone.

SEEMA, launched in 2018, hosts support groups with licensed therapists at community centers and mosques and awareness workshops highlighting the importance of mental health and how to care for someone struggling with a mental illness.

“We need to have these conversations to destigmatize and bring awareness because people think that they’re alone,” Ahmed said.

Religious discrimination makes them more vulnerable

Abbasi, who has studied the impact of growing Islamophobia on Muslims’ mental health, says she was not surprised by the results of the Stanford study.

“Right now, the exposure to toxicity is making us more vulnerable,” Abbasi told NPR.

U.S. Muslims were more likely to report suicide attempts than those from Muslim-majority countries, according to the Stanford study. As a religious minority in the U.S., Muslims are highly vulnerable to religious discrimination, which is associated with depression, anxiety and paranoia.

According to 2020 polling from the Institute for Social Policy and Understanding, 60% of Muslims reported personally experiencing religious discrimination. And the FBI’s latest hate crime statistics in 2019 suggest that, of the reported 1,715 victims of anti-religious hate crimes, 13.2% were victims of anti-Muslim bias.

“There’s just trauma over trauma over trauma,” Abbasi says. “The impact of growing Islamophobia, the violence that is being directed against Muslims, all that is having a huge impact on mental health.”

They sometimes find it hard to reconcile their feelings and their faith

Last November, 39-year-old Chicago investor Jessica Ali broke down after separating from her husband.

“I felt that I was unworthy and there was no reason for me to live,” she said. Ali, a mother of three, had attempted suicide for a third time. The first two were in 2008 and 2018. “I started believing that I was crazy, that I must be a bad Muslim.”

That was until she joined a Muslim support group. It was there that Ali, who was diagnosed with severe depression, first came to terms with her mental illness.

“It’s very likely that when you’re sitting at the masjid, somebody in your praying row has felt this way,” Ali told NPR.

Now, Ali takes medication and visits a therapist.

But unlike Ali, some Muslims may not get the help and support they need.

To help jump over these hurdles, Muslim mental health professionals across the country are providing more culturally appropriate and religiously sensitive resources for Muslims.

Culturally appropriate resources can help

Dr. Sameera Ahmed, executive director of The Family & Youth Institute, a Muslim nonprofit, developed a suicide prevention toolkit in 2017 that helps Muslim American families navigate suicide risks, intervention, assessment and prevention.

“There may be mental health providers available, but if an individual doesn’t trust the system, they’re not going to use it,” Ahmed told NPR. “We try to translate the research into culturally and religiously tailored mental health resources that are community informed and disseminated by Muslim American mental health professionals.”

In 2017, the Khalil Center, which offers Muslims faith-based mental health services, launched a hotline that provides a “safe and empathic space” for those in crisis situations. “There’s more awareness happening,” Khalil Center psychologist Dr. Fahad Khan told NPR. “We have seen a rise in those who are seeking services.”

Imams have an integral role in community mental health because Muslim Americans may be more willing to seek help from religious leaders. That’s why Awaad started a campaign to train 500 Muslim leaders on suicide response in their communities by 2022.

“A number of imams came forward and said, ‘We as the religious and community leaders of the Muslim community really need to step up to this discussion,’ ” Awaad said.

Dr. Heather Laird, founder of the Center for Muslim Mental Health and Islamic Psychology, found that Muslims were more likely to seek psychotherapy if it aligned with Islamic values. So she ignited a movement toward Islamic psychology. By Laird’s definition, Islamic psychology is the treatment of the mind and soul within an Islamic context.

As for Nazir, he uses a combination of therapy and journaling to tend to his psychological wounds.

“This battle for mental health is not necessarily you solve it, you cure it, you move on,” Nazir said. “For me, it’s an ongoing journey.”

Source: American Muslims Are 2 Times More Likely To Have Attempted Suicide Than Other Groups

The U.S. Attracts Fewer International Students, Loses Billions In Revenue. Here’s Why

Of note:

The Biden administration is hoping to attract tens of thousands of international students who stayed away from U.S. campuses during the pandemic. Foreign enrollment plummeted by 20% last year costing nearly $10 billion dollars in lost revenue. Though some students are starting to return, recovery might not be so easy. Even before the pandemic, international students were already turning away from the U.S.

In the 2018-2019 school year, foreign enrollment peaked at 1.1 million students and it’s been declining ever since as countries like Australia, Canada and the U.K gain more foreign students.

That’s a challenge for American colleges. But it also could be a blow to U.S. competitiveness. ​​​​Foreign students often go on to build their lives in the United States, filling our faculty offices, our laboratories, our boardrooms. One in five entrepreneurs who founded start-ups in the United States is an immigrant — and three-quarters of them first came to America as students.

International students are more likely than Americans to pay full freight. At public universities, the out-of-state tuition they pay has helped make up for a drop in state funding, especially after the Great Recession.

“They [colleges] need the tuition. They need full four-year out of state tuition payers,” says Robert Daly who directs the Kissinger Institute on China and the United States at the Wilson Center. Daly argues that colleges have become too reliant on students from one country: China. “They’ve become addicted to this money.”

Higher education is one the America’s largest service exports

When the pandemic sliced away a huge chunk of foreign students, the new administration took note. Higher education is one the nation’s largest service exports — bigger than agriculture exports like corn and soybeans.

Unlike the Trump administration’s hostility to foreigners, the Biden administration recently called it a “foreign policy imperative” that the U.S. remain the top study destination for international students. It’s putting students first in line for interviews and visa processing at U.S. consulates around the world.

But for many foreign students, the U.S. just isn’t as dominant. Emily Dobson calls it the “geoswerve.” Dobson, a college counselor in Brazil, has seen more diversity in where her students apply to colleges over the past few years. She says they’re finding options not just in traditional destinations like Australia and the U.K. but in Qatar, Japan, and the Czech Republic. “We’re not seeing the future we used to see here,” she says of the United States. “Still love you. A few of you are on our list. But you know, we’re going to go to other schools.”

“The American Dream idea,” she says, “is being questioned more.”

Dobson’s students are looking for more affordable options than the U.S. and for places where they can earn a degree in just three years. Safety is also a big concern — America’s gun violence scares many families.

New hesitancy by foreign student spells big trouble for U.S. colleges and economy

And 70% of international students on American campuses are from Asia. The recent rise in anti-Asian hate crimes have made some of them reconsider their futures in the U.S. Early in the pandemic, Lily Cao, a Chinese student at Mount Holyoke College, was confronted in a grocery store by a woman accusing her of spreading the coronavirus. “COVID has really been the trigger point where I felt like, Oh, I might get discriminated against,” Cao says. She plans to return to China to build her career in public health.

This new hesitancy spells big trouble for colleges — and for the larger U.S. economy, which is propelled by immigrant entrepreneurs, many of whom came here as college students. Competitor countries, such as Australia and Canada, make it easy for international graduates to stay and work and give them priority above other applicants for permanent residency. Britain last year introduced a global talent visa that fast-tracks people in in-demand fields for immigration. Universities in those countries frequently promote the ability to work after graduation when they recruit international students.

U.S. colleges are trying to regain their competitive edge and the pandemic may offer something of a blueprint. After more than a year of remote learning, both professors and students are more comfortable with online education. More hybrid and online programs could shorten the amount of time students would need to be in the U.S. And colleges hope a new commitment by the Biden administration to welcome international students can reignite the American Dream for students from abroad.

Source: The U.S. Attracts Fewer International Students, Loses Billions In Revenue. Here’s Why

Column: Is it time to let noncitizens vote in local elections? Some Americans think that’s just nutty

Even at the municipal level questionable, particularly in Canada with reasonable and not excessive requirements. And it still raises issues regarding minimum residency and other requirements:

Should noncitizens be allowed to vote?

That sounds a little crazy, doesn’t it? Weren’t we taught growing up that the right to vote belongs only to full-fledged, passport-eligible citizens of this country?

Nonetheless, the movement to expand immigrants’ voting rights is gaining ground.

We pay taxes, immigrants say. We run businesses. We send kids to public schools, drive the roads, ride the subways and fight in America’s wars. We are stakeholders in our communities and shouldn’t be excluded from the decision-making process that affects us.

There’s currently a bill before the New York City Council to let legal permanent residents vote in municipal elections — up to and including mayoral elections. Since 2018, San Francisco has allowed noncitizens to vote in school board elections, regardless of whether they’re in the country legally or not. Chicago allows it for school council elections.

Here in Los Angeles, the L.A. Unified school board authorized a study more than a year ago on how to extend voting rights in school board elections to noncitizen parents, grandparents and caregivers. The study — which would presumably lead to a ballot measure — was delayed by the pandemic but will be revived as school reopens.

There’s no question that noncitizen voting rights is a radical notion. It’s understandably worrisome to those who believe citizenship matters.

And you don’t have to be a xenophobe or a white nationalist or a Trump voter to feel that way.

A few years ago, then-Gov. Jerry Brown, whose liberal credentials are pretty impeccable, vetoed a bill passed by the California Legislature that would have allowed permanent legal residents to serve on juries, saying: “Jury service, like voting, is quintessentially a prerogative and responsibility of citizenship.”

Citizenship is a concept, a construct — but it’s a meaningful one. The idea is that there is a difference between merely living in the U.S. and being a full participant in its democratic self-government. Many people are stakeholders, but citizens are more like shareholders.

Becoming a citizen is a process (unless you’re born here, in which case it’s simple luck). At the end of it — after you’ve waited your time, lived in the U.S., taken a test, paid your fees, pledged your loyalty — you are rewarded for your formal commitment with both rights and responsibilities.

And there’s a value to waiting. The term “assimilation” is out of favor (perhaps because it implies that immigrants must check their differences at the door), but “incorporation” and “integration” are still important — learning the language, understanding the culture, making sure you buy into the rules and values laid out in the Constitution. Shared citizenship is a unifying force.

My mother, who came to America during World War II, went through this process, becoming a citizen seven years after she arrived.

Nevertheless, despite everything I’ve just said, I’ve come around to the idea that we should try noncitizen voting anyway, at least in a limited way on the most local level. The advantages outweigh the disadvantages.

After all, the United States was founded on the promise of “no taxation without representation” — yet there are some 25 million people living in the country, more than half of them legally, who are unable to participate in the elections that affect their lives and livelihoods. And yes, most of them pay taxes.

When a segment of the population is excluded from the political process, it can lead to discriminatory public policy and mistreatment.

Furthermore, noncitizen voting was widespread in the U.S. at the beginning of the nation’s history; it ended only in the 1920s. It is permitted in 45 countries around the world in local or regional elections, and in some cases, at the national level.

Noncitizen voting in federal elections was barred in 1996, but where it’s been allowed in the U.S. in recent years — in 11 towns in Maryland as well as San Francisco, two cities in Vermont and a few other jurisdictions — the sky hasn’t fallen. In many cases, it has led to greater political engagement and often to “improved outcomes,” says Ron Hayduk, a political science professor at San Francisco State.

Hayduk argues that noncitizen voting on the local level can be seen as part of the process of becoming a citizen, rather than a substitute for it. It undoubtedly fosters a sense of belonging and investment in the community.

It’s all well and good to tell immigrants to wait their turn to vote, but gaining citizenship is caught up in the U.S. immigration system, which is broken and irrational by all accounts, with no fix in sight.

In contrast, a limited experiment in noncitizen voting by the L.A. Unified School District makes sense. After all, the school board cited an estimate that 42% of Southern California’s children have at least one parent who is not a citizen, without a voice in the district’s leadership.

The expansion of the franchise should be narrow. It should be for school board elections only, and it could be restricted to legal permanent residents with children in the system. Let’s try it and see what happens.

Noncitizen voting raises fundamental questions about our country. Who is an American? Who gets to set the rules? What does it mean to run a country “with the consent of the governed”? What are the costs if millions of stakeholders are excluded from decision-making?

This experiment would challenge our assumptions but perhaps make us stronger in the long run.

Source: Column: Is it time to let noncitizens vote in local elections? Some Americans think that’s just nutty

USA: Public Opinion Shifts in a Pro-Immigration Direction

Of note. Dysfunctional US political system does not translate shift into political action:

Since 1965, Gallup has been polling Americans about whether they want immigration levels to decrease, increase, or remain the same. Last year, the percentage of Americans who want to increase immigration rose above the percentage who want to decrease it for the first time. In 2021, that shift held with more respondents again supporting increasing immigration than decreasing it (Figure 1). The support for increasing legal immigration may have narrowed in 2021 to 33 percent from 35 percent in 2020, but the changes are so small that they are likely statistically insignificant.

Consistent with the general rise in support for increasing immigration, a large majority of Americans still believe that immigration is a good thing for the United States (Figure 2). Just like in Figure 1, the percentage saying it’s a good thing has declined by 2 percentage points but that is a small shift a statistically insignificant shift. Although this is consistent with pro‐​immigration policy views, it also includes those who like the current level of immigration.

However, an even more important shift has continued in U.S. opinion about immigration. Since 2001, Gallup has asked this question: “(Asked of those dissatisfied with level of immigration into U.S.) Would you like to see the level of immigration in this country increased, decreased or remain about the same?” Respondents who are dissatisfied with the level of immigration are increasingly likely to be dissatisfied because they think that there is too little immigration. I wrote about this last year but the trend has grown in 2021 (Figure 3). In 2020, 26 percent of respondents were dissatisfied with the level of immigration and they wanted to decrease immigration. By 2021, that percentage had fallen to 19 percent. The percent of those who were dissatisfied and wanted an increase stayed about the same and the percent of those satisfied climbed slightly.

That’s a tectonic shift. From 2001–2016, an average of 63 percent of respondents were dissatisfied with the level of immigration. Only about 5 percent of respondents were dissatisfied and wanted to increase immigration levels and a whopping 44 percent of the dissatisfied wanted to decrease them (Figure 3). This began to change shortly after President Trump took office. From 2017–2020, an average of about 11 percent of respondents wanted to increase immigration levels while 28 percent were dissatisfied and wanted to decrease them. By the end of the Trump administration, there was still quite a gap among those dissatisfied with immigration, but it had narrowed.

We’re clearly seeing a shift in public opinion where those who dislike the current system are beginning to dislike it because it’s too restrictive. To the extent that we can believe surveys that measure opinions unexpressed through concrete actions like voting, this is a big shift. So far, virtually all of the political energy and enthusiasm has been for immigration restriction. Anti‐​immigration voters cared a lot more about this issue than pro‐​immigration voters. Now, the decline in the percent of respondents who are dissatisfied and who want less immigration is beginning to look like the collapse in anti‐​immigration sentiment that began in the mid‐​1990s (Figure 1).

One doubt I had about this change in behavior last year was that this increased pro‐​immigration opinion was just a reaction to President Trump and that it would fade out after he left office. In other words, I was worried that this was just an ephemeral liberal reaction of President Trump rather than a real and sustained change in opinion. But since the 2021 survey results show that only 19 percent of respondents are dissatisfied and want less immigration, a number 7 percentage points below the previous response in 2020, that is an indication that the pro‐​immigration sentiment of the American public is continuing to increase in the Biden administration. That improvement is especially surprising considering the rise in apprehensions along the border.

This appears to be a positive and sustainable change in American public opinion.

Source: Public Opinion Shifts in a Pro-Immigration Direction | Cato at …https://www.cato.org › blog › public-opinion-shifts-pro…

Americans Remain Divided on Preferred Immigration Levels

Latest Gallup poll. Overall trends toward more support for immigration along with notable partisan divided along with demographic details:

Americans divide almost evenly on whether immigration to the U.S. should be increased (33%), decreased (31%) or kept at its present level (35%). These preferences are similar to last year’s readings but reflect greater support for increased immigration since the early 2000s, reaching a high of 34% in 2020. At the same time, there has been a decline in recent years in the percentage of Americans who want immigration decreased, with last year’s 28% the lowest in the trend.

Line graph. Americans’ preferences for immigration levels. Thirty-five percent of U.S. adults want immigration kept at its present level, while 33% want it increased and 31% decreased.

For much of Gallup’s trend dating back to 1965, the plurality (if not the majority) of Americans wanted immigration decreased. Three surveys conducted between 1993 and 1995 found more than six in 10 wanting immigration reduced. After 9/11, 58% held this view, and as recently as 2009, 50% did.

Meanwhile, relatively few Americans called for increased immigration, with the percentage holding that view not surpassing 20% until 2012. Since then, it has not gone below that level and has been the preferred option for one in three Americans each of the past two years.

The current results are based on a June 1-July 5 Gallup survey that included oversamples of Black and Hispanic adults to allow for more precise estimates of those subgroups. The overall sample was weighted so all racial and ethnic groups are represented in their proper proportions of the U.S. population.

These findings come at a time when the U.S. is struggling to control crossings at its southern border, with many of those migrants coming from Central American countries. June saw the largest number of attempted border crossings in more than two decades. At the same time, many U.S. businesses are currently having difficulty filling open job positions. In the longer term, the U.S. has an increasingly aging population that may not be able to fill the number of jobs needed in the future.

Gallup’s latest update finds 9% of Americans naming immigration as the most important problem facing the country. Only the government and race relations are mentioned more frequently.

Hispanic Americans More Likely to Favor Increased Immigration

Forty-two percent of Hispanic adults want immigration levels increased, compared with 32% of non-Hispanic Black and 30% of non-Hispanic White adults.

Overall, White Americans divide equally in their preference for immigration, while Black Americans slightly prefer keeping immigration levels the same.

Preferences for U.S. Immigration Levels, by Racial/Ethnic Group
In your view, should immigration be kept at its present level, increased or decreased?
Increased Present level Decreased
% % %
U.S. adults 33 35 31
Hispanic adults 42 33 25
Non-Hispanic White adults 30 33 35
Non-Hispanic Black adults 32 41 26
GALLUP, JUNE 1-JULY 5, 2021

Since Gallup began tracking racial/ethnic groups’ immigration attitudes in 2001, each has shown a greater preference for increased immigration, especially White Americans. That year, 10% of White Americans, 24% of Black Americans and 33% of Hispanic Americans favored increased immigration levels.

The racial/ethnic group differences, however, are not as great as those for party identification and education. Fifty-seven percent of Republicans, compared with 12% of Democrats, want to see immigration reduced. In contrast, half of Democrats and 10% of Republicans want it increased.

Additionally, half of Americans with a postgraduate education think immigration should be increased, double the percentage among those with a high school education or less.

Preferences for U.S. Immigration Levels, by Party Identification and Education
In your view, should immigration be kept at its present level, increased or decreased?
Increased Present level Decreased
% % %
Party identification
Democrats 50 37 12
Independents 34 36 29
Republicans 10 31 57
Educational attainment
Postgraduate 50 23 27
College graduate only 37 39 24
Some college 31 34 31
High school or less 25 38 35
GALLUP, JUNE 1-JULY 5, 2021

Most Americans Continue to View Immigration Positively

Though Americans are divided on how immigration levels should change, they widely agree that immigration is “a good thing” for the country today. Three in four U.S. adults hold this view, while 21% disagree and say it is “a bad thing.”

At least seven in 10 Americans have viewed immigration positively since 2015, and majorities have consistently done so since Gallup first asked the question in 2001. At its lowest, 52% said immigration was a good thing in Gallup’s first post-9/11 reading in 2002.

Line graph. Belief that immigration is a good thing for the country today. Currently 75% of U.S. adults say it is a good thing and 21% bad thing. Majorities have consistently said it was a good thing, ranging from 52% to 77%.

Majorities of all key subgroups think immigration is good for the country today, with little difference by racial/ethnic group. However, significant gaps by party identification and education exist, as Republicans are less likely than Democrats and independents to view immigration positively, and fewer college nongraduates than college graduates say it is a good thing.

Views of Immigration as a Good or Bad Thing for the U.S. Today, by Subgroup
Good thing Bad thing
% %
Race/Ethnicity
Hispanic adults 80 16
Non-Hispanic White adults 73 23
Non-Hispanic Black adults 74 23
Party identification
Democrats 84 13
Independents 79 17
Republicans 57 39
Educational attainment
Postgraduate 85 13
College graduate only 85 11
Some college 72 24
High school or less 68 29
GALLUP, JUNE 1-JULY 5, 2021

Over the past decade, all major subgroups, with the exception of Republicans, have become significantly more inclined to see immigration as a good thing for the U.S. In 2011, 53% of Republicans viewed immigration positively, compared with 57% today. By contrast, the increases were 16 percentage points among independents (from 63% to 79%) and 23 points among Democrats (from 61% to 84%).

Bottom Line

Immigration remains a challenging issue, and Congress has not been able to agree on legislation to address the matter in a comprehensive way. Over the past decade, Americans’ views have shifted, with more favoring increased immigration.

This year has seen a dramatic increase in attempted border crossings, and the Biden administration struggled this spring to house thousands of unaccompanied minor children entering the U.S. at its border with Mexico. President Joe Biden and his advisers have told migrants not to leave their home countries. Amid all this, Americans’ views on immigration have held steady compared with what they were last year when Donald Trump, who took a much stricter stance against immigration, was in office.

Although there is general agreement among Americans that immigration is good for the country, their even division on whether immigration levels should be changed may be frustrating efforts to pass legislation. Moreover, Republicans and Democrats disagree about the proper level of immigration, as well as about the urgency of the problem, further hampering U.S. political leaders’ ability to find solutions to the issue.

Source: Americans Remain Divided on Preferred Immigration Levels

Immigration and the Aging Society

The same characteristics apply to Canada in terms of the limited impact of immigration on addressing an aging demographic. However, given Canada’s prioritizing skilled immigration, the fiscal drain arguments don’t apply (previous studies by Grubel that argued thus were flawed):

The idea that immigration is the solution to the aging of American society has become an article of faith among those arguing for ever-higher levels of new arrivals. They assert that, in societies such as the United States, where fertility rates are low relative to historic patterns, the native population will not supply enough workers to maintain a robust economy and pay for government services, particularly retirement programs. If native-born Americans aren’t going to have enough children to balance the longer-lived elderly population, the argument goes, then our only option is to increase immigration levels.

It’s not a crazy argument; it just happens to be incorrect. In reality, a significant body of research shows that the impact of immigration on population aging is small. While immigration can certainly make our population larger, it does not make us dramatically younger.

And yet, commentators have been making such arguments for years. The late Washington Post columnist Charles Krauthammer asserted in 1998 that America has been “saved by immigrants” from the kind of aging taking place in other first-world countries. Former Florida governor Jeb Bush famously said that America needed higher levels of immigration to “rebuild the demographic pyramid.” At the data-journalism site FiveThirtyEight, Ben Casselman has argued that immigration is the “only thing” preventing the country from facing a “demographic cliff.”

The release of the 2020 census showing the U.S. population grew by only 22.7 million since 2010, coupled with preliminary data indicating a sharp drop in fertility during the Covid-19 pandemic, have prompted a new round of articles asserting that immigration is the solution to population aging. The title of a recent Vox piece by Nicole Narea summed up this view: “The Census Shows the US Needs to Increase Immigration — By a Lot.” Similarly, George Mason University’s Justin Gest has called for doubling immigration to make the United States “younger, more productive and richer.”

But demographers have known for a long time that, absent truly gargantuan and ever-increasing rates of immigration, it isn’t actually possible for immigrants to undo or dramatically slow the overall aging of society. As Oxford demographer David Coleman observes, “it is already well known that [immigration] can only prevent population ageing at unprecedented, unsustainable and increasing levels of inflow.”

Those who argue that immigration is the key to dealing with an aging society are right about one thing: Both the share of the population that is of working age (16 to 64) and the ratio of workers to retirees are declining as Americans live longer and have fewer children. It is also true that, primarily due to post-1965 immigration, immigrants and first-generation Americans represent a growing share of the U.S. population and workforce. But this does not mean that immigration can dramatically slow or halt the aging of American society to nearly the degree that many seem to believe.

There are four broad reasons why the demography doesn’t support the political credo. First, not all immigrants arrive young — in fact, a growing share are arriving at or near retirement age. Second, immigrants age just like everyone else, adding to the elderly population over time. Third, immigrant fertility rates tend to converge with those of the native born. Fourth, to the extent that immigrants do have higher fertility rates than the native born, their children add to the dependent population — those too young or old to work. All of this means that immigration has only a modest impact on the working-age share of the population and the ratio of workers to retirees.

Immigration and Population

Studying the impact of immigration on population aging is nothing new for demographers. In a 1992 article in Demography — the top journal in the field — economist Carl Schmertmann explained that mathematically, “[c]onstant inflows of immigrants, even at relatively young ages, do not necessarily rejuvenate low-fertility populations. In fact, immigration may even contribute to population aging.” In 1994, Thomas Espenshade, the former chairman of Princeton’s sociology department and director of its graduate program in population studies, concluded the same. “Immigration,” he observed, “is a clumsy and unrealistic policy alternative to offset a shortage of domestic labor or to correct a perceived imbalance in the pensioner/worker ratio in the United States.” Likewise, as part of its population projections in 2000, the U.S. Census Bureau stated that immigration is a “highly inefficient” means for increasing the working-age share in the long run.

More recent studies only confirm these conclusions. A paper I co-authored for the 2012 annual meeting of the Population Association of America, for instance, shows that future levels of immigration have a modest impact on population aging. A 2019 version of that paper, which is based on the most recent Census Bureau population projections, demonstrates the point yet again.

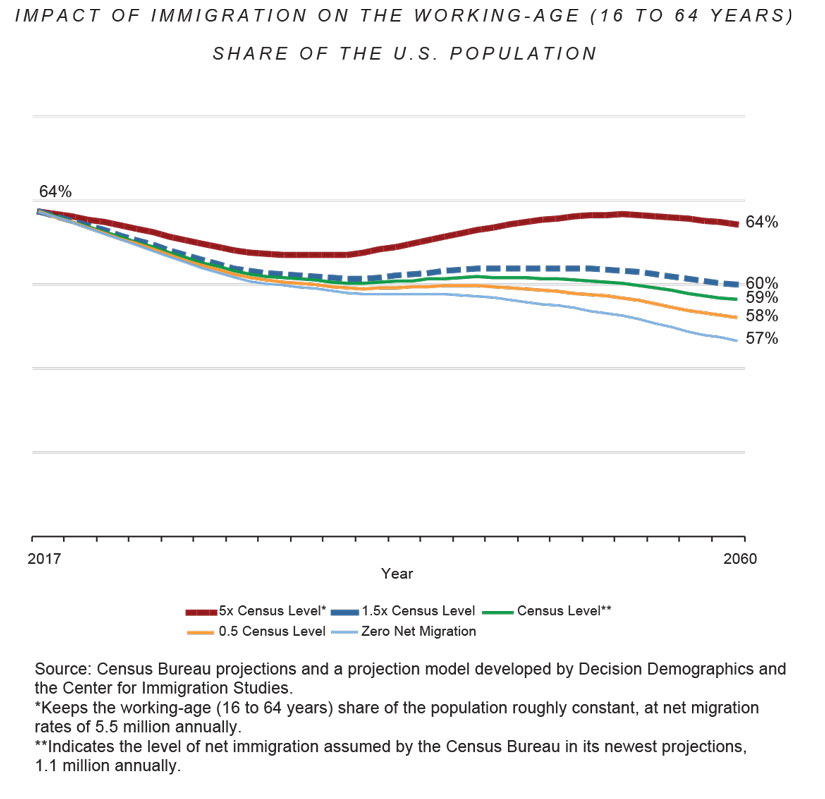
According to those projections, the total U.S. population will reach 404 million in 2060. This figure assumes current trends in net migration — the difference between the number of people arriving and those leaving — will continue, at an average rate of about 1.1 million each year. To determine the effect this level of immigration will have on the U.S. population, we can compare the bureau’s 2060 projection to the projected population under a scenario where net migration is zero (which is unlikely in the extreme, of course, but useful for our analysis). In this scenario, the U.S. population would decline slightly, to 329 million. The 75-million difference between the two figures represents the impact that immigration will have on the total population over the next 39 years.

The Census Bureau also estimates that, in 2060, 59 percent of the population will be of working age. Again, this is based on the assumption that net migration will amount to an average of 1.1 million each year. Under a zero-immigration scenario, just under 57 percent of the population would be of working age. In other words, while immigration is projected to add 75 million people to the American population by 2060, it will only increase the working-age share of the population by about two percentage points. Even if annual net immigration were expanded by 50 percent above what the Census Bureau projects, so that it averaged about 1.65 million a year, it would still only increase the working-age share of the population by three percentage points.

Part of the reason immigration has such a small effect on the working-age share of the population is that while it certainly adds new workers, it also adds to the number of retirees over time, as well as to the number of children. To be sure, these children eventually grow up and become workers. But by the time this happens, many of their immigrant parents will have reached retirement age. These two developments tend to cancel each other out over time. As a result, immigration does not have much of an impact on the share of the population that is of working age in the long run.

This fact is key to understanding why immigration has such a modest impact on overall population aging. Looking at the average age of immigrants over time, as opposed to projecting into the future, shows how this works. In 2000, the average age of all immigrants — not just new arrivals — was 39.2 years. By 2019, it was 46 — a seven-year increase. Over the same period, the average age of native-born Americans increased only slightly, from 35.4 years to 38 years. Part of the reason for the disparity is that all children born to immigrants are considered natives, so they add only to the native-born population. Nonetheless, the relatively high and increasing average age of all immigrants is a good reminder that they grow old like everyone else, even if they do arrive when relatively young.

Most people recognize why a larger senior population increases government expenditures, but fewer acknowledge that a larger population of children does so as well. Government spending on children makes up a sizeable portion of federal, state, and local budgets: The United States spent $726 billion on public schools during the 2017-2018 school year alone. Federal and state governments also spend more than $1 trillion per year on means-tested programs, a large share of which goes to families with children. Indeed all societies, including ours, devote enormous resources to providing for children, and for good reason. But a larger population of children means the state must spend more to provide for them.

Even if we were to exclude children from the analysis and focus solely on the ratio of working-age people to retirees (those 65 and over), the impact of immigration would still be modest. Under the Census Bureau’s current projections, there will be 2.5 working-age people per retiree in 2060. If the projected immigration rate were cut in half, there would be 2.3 workers per retiree. Commenting on our findings at a panel discussion, American Enterprise Institute scholar Nicholas Eberstadt summarized the upshot succinctly: “[I]mmigration cannot possibly over the long run maintain a youthful population structure.”

Of course, as Espenshade and Coleman suggest, it is theoretically possible to use immigration to preserve the current working-age share of the population, as well as the ratio of workers to retirees. But doing so would require levels of immigration that have no precedent in American history. Our analysis shows that, to roughly maintain the working-age share of the population, immigration rates would have to increase five-fold over what the bureau currently foresees. This would create a total population of 706 million in 2060 — more than double the current population. Under such a scenario, by 2060, most U.S. residents would be post-2019 immigrants or their offspring. This level of immigration would be transformative in the extreme; few aspects of society would remain untouched by adding so quickly and so dramatically to the U.S. population.

Immigration and Aging

Population projections provide a reasonable picture of what is likely to happen demographically in the future, but they also rely on assumptions about trends that are always changing. As a result, the newest Census Bureau projections do not fully reflect the significant increase in the age at which immigrants are now coming to America.

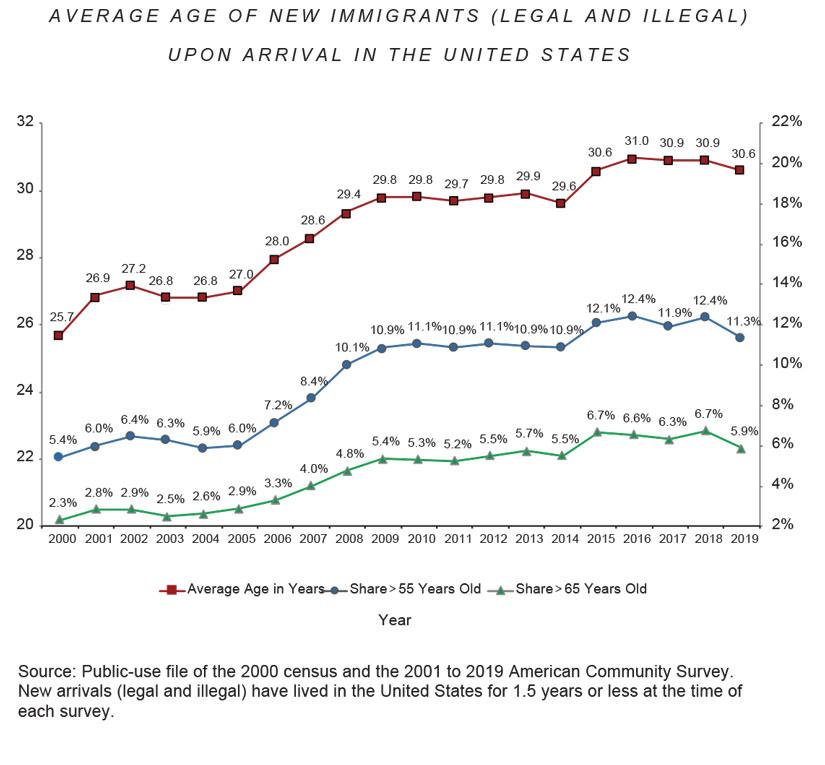
Although newcomers were slightly younger in 2019 than they were in 2018, the average age of new immigrants, including illegal immigrants, is still much higher than it was in the past — increasing from 26 in 2000 to 31 in 2019. Perhaps even more surprising, the share of newly arrived immigrants who are 55 and older more than doubled, from 5 percent in 2000 to 11 percent in 2019. This means that one in nine new immigrants is arriving old enough to move directly into a retirement community.

Why are immigrants arriving at older ages? One reason is that, as the United Nations has reported, fertility is declining and life expectancy is increasing worldwide. Rapidly aging populations in countries that send immigrants to the United States almost certainly translate into immigrants arriving at older ages, at least to some extent.

Even more importantly, U.S. citizens can sponsor their parents for permanent residence without numerical limits. Parents typically immigrate to the United States after age 50, meaning they tend to be at or near retirement age as soon as they arrive. As the number of naturalized citizens living in the United States has nearly doubled since 2000, it should come as no surprise that the number of immigrants arriving each year in the parents category has increased in turn.

It is fair to criticize this category of permanent immigration — at least for a society facing an entitlement-funding crisis, such as ours. But it would be politically difficult to end the program. Press accounts in recent years indicate that the Trump administration considered offering parents a continually renewable temporary visa instead of permanent residence, but no such policy was formally proposed. The Biden administration is unlikely to advance such an idea. And in any case, the approach would still have meant the arrival of perhaps 150,000 or more parents each year, who would have added to overall population aging.

The understandable desire of many immigrants to bring their parents to the United States means that any immigration reform that emerges from Congress will almost certainly allow a substantial number of older immigrants to enter the country on both permanent and long-term temporary visas. Once these individuals arrive, it is hard to imagine the government refusing to provide some level of assistance for them — after all, many elderly immigrants who did not work long enough to qualify for Social Security or Medicare often end up receiving Supplemental Security Income and Medicaid. Like our devotion to providing for children, our commitment to assisting the elderly is not without merit. But we should also be cognizant of how immigration policy affects our ability to make good on this commitment as our society ages.

Immigration and Fertility

A key reason for the aging of America’s population is the declining fertility rate among the native born. Many commentators assume that immigration can help reverse this trend, as they believe immigrant women tend to have many more children than do American-born women.

Yet as mentioned above, declining fertility rates are a near-universal trend. Several of the top countries that contribute to America’s immigrant population — including Cuba, Vietnam, China, and South Korea — have fertility rates near as low as, or even lower than, that of the United States. More importantly, immigrants living in the United States are increasingly reflecting these trends: Despite a 9 percent increase in the total number of immigrant women of childbearing age between 2008 and 2019, there were 158,000 fewer births to immigrant women in 2019 than there were in 2008.

As the graph below indicates, the total fertility rate (TFR) — the number of children a woman is expected to have in her lifetime — for immigrant women has fallen steadily. In 2008, immigrant women had a TFR of 2.75. By 2019, the rate had fallen to 2.02. A TFR of 2.1 is widely considered necessary to maintain the existing population. Thus, for what is almost certainly the first time in American history, the immigrant fertility rate was below replacement level.

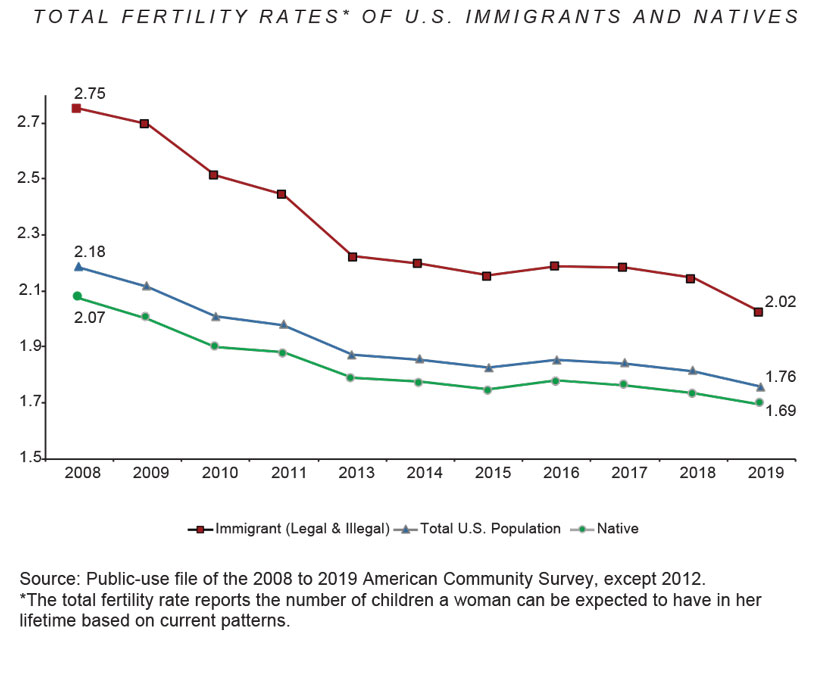
As the graph above indicates, the TFR for native-born women also declined over the same period. But it did so by roughly half as much as it has among immigrants. To be sure, the overall immigrant TFR of 2.02 is still higher than the 1.69 TFR of natives. But the presence of immigrants only pulls up the overall TFR in the United States to 1.76 — an increase of just 4 percent.

The steep decline in immigrant fertility has not received much media coverage, even while the fall-off in births nationwide has received a good deal of press. In fact, many people remain unaware that it has occurred. The Census Bureau is aware of the development, but again, the trends it relies on are always changing, and it takes time to incorporate changes of this kind into its population projections. As a result, the bureau’s most recent projections do not fully capture this trend, instead assuming a 2019 TFR for immigrants of 2.5 — well above the actual rate of 2.02. Because immigrant fertility is much lower than projected, the small, positive impact of immigration on population aging shown in the bureau’s projections is even smaller. What’s more, although the fertility numbers for 2020 are preliminary, we do know that fertility was down significantly in the country during the pandemic. There is no reason to believe immigrants bucked this trend.

Among native-born Americans, Hispanics have seen the steepest drop in fertility in recent years. American-born Hispanic women had a TFR of just 1.77 in 2019. The TFR was 1.42 for American-born Asian women that same year — both well below replacement level. The rate for native-born whites and blacks was 1.69 and 1.68, respectively. In short, among native-born whites, blacks, and Hispanics, there is now no meaningful difference in fertility rates, while the native-born Asian fertility rate is a good deal lower than the rest. Thus, in a very real sense, immigrants and their children are assimilating to American norms when it comes to family size. This means immigration is no game changer when it comes to the nation’s birth rate.

Intriguingly, some research indicates that immigration may actually lower the fertility rate of the native born, most likely by driving up housing costs, which discourages couples from starting or expanding their families. Kelvin Seah of the National University of Singapore has found that the Mariel Boatlift to Miami — during which about 125,000 Cuban immigrants arrived in the city during a five-month period in 1980 — caused a significant decline in native fertility. In an analysis completed this year, Karen Zeigler and I show that in large metropolitan areas, a higher share of immigrants in the population correlates with lower fertility among the native born, even after controlling for each city’s demographic characteristics. If this finding is confirmed, it could erase, and perhaps even reverse, the small positive impact of immigration on the nation’s overall fertility.

The Fiscal Picture

One of the central concerns about population aging is the ability of an older society to pay for government. With immigration, the hope is that young immigrants will help pay for entitlement programs. Of course, this depends on their actual tax payments relative to the fiscal costs they create. While many immigrants are young, are highly skilled, and have high incomes, immigrants on average have less education and lower incomes than do native-born Americans. This makes it difficult for them to generate the kind of fiscal surplus that would be necessary to help them pay for entitlement programs.

In 2017, the National Academies of Sciences, Engineering, and Medicine (NASEM) estimated the current net fiscal impact of all immigrants and their dependents using eight budgetary scenarios. In all eight of these scenarios, immigrants and their dependents were found to be a net fiscal drain, paying less in total taxes than the costs they created. Though they were found to be a surplus in four of the scenarios at the federal level, their fiscal drain at the state level offset the federal surplus.

Even if immigrants were able to shift the ratio of workers to retirees dramatically, it would not help fill public coffers if they are a net fiscal drain on government funds before they reach retirement age. The best evidence indicates that this is in fact the case, at least at present. One might think this fiscal drain is due to the immigrant population consisting of mostly newcomers who are still trying to find their way in America, but this is not so. In 2017, the average immigrant had lived in the United States for 21 years.

NASEM also ran long-term fiscal projections (out 75 years) for immigrants and their descendants, which showed a fiscal deficit in four of the scenarios and a surplus in the four others. Projections of this kind are quite speculative, involving not just predicting births, deaths, and migration in the way that population projections do, but also predictions about future tax rates, spending, economic growth, and the progress of immigrants over several generations. The upshot of the fiscal analysis is that the current situation is clearly negative, while the long-term impact is uncertain.

To be clear, immigrants are not a fiscal drain because they are lazy or because they came to America for welfare. In fact, working-age immigrants are slightly more likely to hold a job than are working-age natives. This is especially true of the least-educated immigrants, who are much more likely to work than are the least-educated natives. The main reason for the current fiscal drain is straightforward: Immigrants are less educated on average than are native-born Americans, and as a result, they have lower average incomes, lower average tax payments, and a higher use of means-tested programs than natives do.

One way to change the fiscal picture, at least for future immigrants, would be to move away from the current system, which admits people primarily because they have a family member here, and toward a system that selects more highly educated immigrants who are likely to earn high incomes. But given political realities, it’s hard to imagine that the admission of family members will not remain a significant component of U.S. immigration policy.

The bottom line is that it’s simply not reasonable to expect a family-based immigration system to create an inflow of highly educated, high-income immigrants who are likely to help solve our fiscal problems, no matter what it does to the age structure. This is especially true because, as a society, we have been unwilling to tax ourselves enough to pay for government — hence our enormous federal debt, even before the pandemic, and heavy borrowing at the state and local levels. As a result, the average American, whether immigrant or native born, is in fiscal deficit. Our unwillingness to pay for the programs we desire is, of course, not the fault of immigrants. But given current circumstances, admitting higher numbers of immigrants, even if they were average taxpayers, would worsen our fiscal situation.

Beyond Projections

Population projections, with their inherent uncertainty about future trends, are not the only way to think about the impact of immigration on the nation’s age structure; it’s also possible to estimate the impact of immigration based on what has happened in the recent past. The Census Bureau collects detailed data on immigrants (including most illegal immigrants) in the American Community Survey and the Current Population Survey, making such retrospective analysis relatively straightforward. Since this method frees analysts from having to make any of the assumptions that would otherwise be necessary for developing a population projection, it is useful to our purposes here.

Zeigler and I have taken Census Bureau data from 2017 and found that, since 1990, immigrants — including the original immigrants, their children, and their grandchildren — have added 43 million people to the country. This total exceeds the combined population of 22 states and represents one in eight U.S. residents. Looking at this large and relatively young population offers a good test of the argument that immigration can solve the problem of an aging society.

Our analysis shows that these post-1990 immigrants and their progeny increased the overall working-age population percentage from 63.9 percent of Americans to 64.4 percent. The impact is small because, as already discussed, immigration added to both the number of workers and the number of people too young or too old to work. Even if the number of post-1990 immigrants and their offspring had been double the actual number, the working-age share would have increased to 64.8 percent — just 0.9 percentage points higher than if there had been no immigration at all.

As for the ratio of working-age people to those of retirement age, post-1990 immigrants raised it from 3.7 workers per retiree in 1990 to 4.1 potential workers per retiree in 2017. While not a trivial impact, this increase was still quite modest. The post-1990 immigrants did add a significant number of workers, but they also added over 2 million people aged 65 and older, as well as 2.7 million people nearing retirement (ages 55 to 64).

The overall conclusion from this retrospective analysis is that immigration had little effect on the working-age share of the population and a larger, but still modest, impact on the ratio of workers to retirees. This largely confirms the projection-based conclusions discussed above.

Alternative Strategies

If immigration is unlikely to dramatically transform the age demographics of our society, how can low-fertility, high-life-expectancy countries like the United States deal with population aging?

The most obvious solution is to raise the retirement age. One of the main reasons for the entitlement crisis as it relates to providing for the elderly is the increase in life expectancy. Pushing back the age of retirement — or at least the age when people can receive publicly funded old-age entitlements — would align policy with demographic reality.

The retirement age is not set in stone, as even today, programs like 401(k) accounts, private pensions, and government pensions can all be accessed at different ages. At present, the retirement age for full Social Security benefits is set to rise from 66 to 67 by 2027, while Medicare eligibility remains fixed at 65. Meanwhile, remaining in the workforce has become more common among the elderly, particularly among the so-called “young old” — those ages 65 to 69. In 2000, about a quarter of the people in this age group worked. By 2019, the portion had increased to one-third.

People who reach age 66 today can expect to live substantially longer than their counterparts in the 1930s did, when Social Security was created. If the retirement age for Social Security were increased to 70, it would still allow the average recipient to receive benefits for longer than retirees did in the 1930s while nearly preserving the working-age share of the population through 2060. As Eberstadt put it during the panel mentioned above, “raising the age of retirement has a bigger bang” when it comes to the share of the population who are workers than does immigration.

Our retrospective analysis confirms this conclusion. Raising the retirement age by just one year in 2017, assuming no post-1990 immigration, would have increased the ratio of workers to retirees by as much as the 43 million post-1990 immigrants and their offspring did. Increasing the retirement age by two years would have improved the worker-to-retiree ratio in 2017 more than did all 43 million post-1990 immigrants and their descendants combined.

Besides raising the retirement age, another effective option for addressing population aging is to increase the number of Americans in the labor force. By historical standards, the number and share of working-age people outside the labor force was quite high in 2020, even before the pandemic hit. At the start of 2020, about 71 percent of working-age non-institutionalized people — those not incarcerated or in long-term care facilities — were employed; the rest were either unemployed and looking for work or had left the labor force entirely. By then, labor-force participation rates across every major demographic subgroup had been declining among people without a bachelor’s degree for decades.

In our population projections, we found that if we assume the working age remains at 16 to 64, but the share of those working were raised to 75 percent from the pre-pandemic level of 71 percent, it would increase the worker share of the population by as much as would adding 75 million people to the population through immigration over the next four decades.

Returning discouraged workers to the labor force may not be easy given all the social problems many, especially the least educated among us, face. That said, as recently as 2000, 74 percent of working-age people were employed. Moving a larger share of working-age Americans back into the labor force is thus hardly unimaginable. Doing so would directly improve the ratio of workers to retirees and, as non-work is associated with significant social ills, would have some desirable non-economic effects on society to boot.

What Immigration Can’t Do

Every analytical approach to the question of aging demonstrates that, unless the level of immigration is truly enormous and ever-increasing, it will not solve or even significantly alleviate the challenges associated with an aging population.

The reason behind this truth is simple: Immigrants are human beings, not just the idealized workers or child-bearers that some commentators imagine. As humans, they immigrate at all ages, grow old over time, and are choosing to have smaller families. As a result, they add to the population across the age distribution and do not fundamentally change the nation’s age structure.

One can advocate for immigration for any number of reasons, including the fact that immigrants themselves benefit greatly by coming here. But it is simply dishonest, and therefore irresponsible, to claim that immigration will address the fiscal and other challenges of an aging society that maintains an enormous welfare state for the elderly.

Given this reality, we will need to think about other means of addressing our fiscal troubles, including changing the structure of our entitlement programs and coaxing more native-born Americans into the workforce. If we are serious about addressing the challenges associated with an aging society, we cannot depend on immigrants to save us.

Source: Immigration and the Aging Society