How DOGE’s push to amass data could hurt the reliability of future U.S. statistics

Part of the destruction of government institutions under the Trump administration:

Falling public participation in surveys and trust in government have plagued the U.S. Census Bureau for decades.

And some of the agency’s current and former workers say there’s a new complication to gathering enough survey responses to produce key statistics for the country.

The Trump administration’s murky handling of data, which has sparked investigations and lawsuits alleging privacy violations, has become one of the reasons people cite when declining to share their information for the federal government’s ongoing surveys, these workers say.

“I got more people asking me how I know information isn’t going to be sold or given away,” says a former field representative, who says they were met with “a lot of suspicion” and specific mentions of Elon Musk, President Trump’s billionaire adviser who set up the DOGE team, from some households they tried to interview earlier this year. The former bureau employee, who was let go as part of the Trump administration’s downsizing of the federal government, asked not to be named because they fear retaliation.

A current field representative says they don’t “feel as comfortable” in their role as they felt asking questions for surveys last year — and neither do some people who had previously shared their information. One person specifically mentioned DOGE when declining a follow-up interview, says the current representative, who asked NPR not to name them because they are not authorized to speak publicly.

“It’s a system that runs on trust, and the trust, I would say, has been declining,” the current field representative says. “It makes me sad as an American that distrust is at that level. But I do understand it. I fear for the data I’m collecting. Is it going to be misused? And the privacy guarantees that I describe to people — are those going to be respected?”

These questions don’t surprise Nancy Bates, a former senior researcher for survey methodology at the bureau. Bates has tracked declining public participation in the census going back to the 1990 tally.

Federal law prohibits the bureau from releasing information that would identify a person or business to anyone, including other federal agencies and law enforcement. But a report Bates helped prepare during the first Trump administration found 28% of people surveyed in 2018 said they were very or extremely concerned the bureau would not keep their 2020 census answers confidential.

“Even prior to DOGE, the Census Bureau was always dealing with a level of mistrust about privacy and confidentiality,” says Bates, who, after retiring from the agency in 2020, helped lead its 2030 census advisory committee before the Trump administration disbanded it. “I absolutely can see why the public concern would be increased following these unauthorized and illegal access to data.”…

Source: How DOGE’s push to amass data could hurt the reliability of future U.S. statistics

How reliable is the government’s economic data? Under Trump, there are real concerns

Legitimate worry and consistent with the apparent “wrecking ball” approach to policy and programs:

Every month, the federal government serves up a steady diet of economic reports on everything from the price of groceries to the unemployment rate. These reports are closely followed: They can move markets — and the president’s approval rating.

Businesses and investors put a lot of stock in the numbers, which are rigorously vetted and free from political spin.

Now the Trump administration is calling that trust into question.

The government recently disbanded two outside advisory committees that used to consult on the numbers, offering suggestions on ways to improve the reliability of the government data. 

At the same time, Commerce Secretary Howard Lutnick has suggested changing the way the broadest measure of the economy — gross domestic product — is calculated.

Those moves are raising concerns about whether economic data could be manipulated for political or other purposes. 

Among those raising the alarm is Erica Groshen. She’s one of the outside experts who received a terse email last week saying her services were no longer needed, because the committee she’d served on — the Federal Economic Statistics Advisory Committee — had been folded.

Groshen cares deeply about the reliability of government data, having previously overseen the number crunching as commissioner of the Bureau of Labor Statistics. 

“Statistical agencies live and die by trust,” she says. “If the numbers aren’t trustworthy, people won’t use them to make important decisions, and then you might as well not publish them.”

Source: How reliable is the government’s economic data? Under Trump, there are real concerns

German citizenship: Record number of naturalizations

Of note, along with the planned policy changes:

A record 168,545 applicants with 171 different nationalities received German citizenship in 2022. That was 28% more than in the previous year, the Federal Statistical Office in Wiesbaden reported this week.

Twenty-nine percent of people who adopted German nationality in 2022 were from Syria, their average age was 24.8 years, and two-thirds of them are male. Many of them had fled their homeland when the civil war broke out in 2014 and have since found a new home in Germany. Before naturalization, they had been in Germany for an average of 6.4 years.

Syrians topped the list, followed by Ukrainian, Iraqi and Turkish nationals.

“Almost half of all Syrians who received their German passports did so after only six years. That’s because they were able to demonstrate exceptional integration achievements,” Jan Schneider, of the independent Expert Council on Integration and Migration, told DW.

“In fact, we can expect the number to rise further this year,” Schneider said, as the ruling center-left coalition of Social Democrats (SPD), Greens and neoliberal Free Democrats (FDP) has comprehensive plans for changing and simplifying the citizenship law.

High hurdles so far

Currently, the requirements for naturalization include language skills (B1) and a secure income, and candidates must have lived in Germany for a minimum of eight years.

People who want to become German citizenship have not only had to pay the fee of €255 ($272) but also need to be able to document their identity and pass a written test in German, which consists of 33 questions on German customs and society and the law. Applicants must also declare their support for democracy and the German constitution, the Basic Law.

Anyone who has been convicted of a criminal offense does not stand a chance. Neither do applicants who have no income or savings and rely solely on state support.

But, now, Germany sees a labor shortage across its economy, ranging from IT specialists to medical staff to food servers. Labor market experts have estimated that Germany needs 400,000 immigrants per year to close the widening gap. Currently, only 60,000 are attracted each year by the government’s skilled immigration program.

A fundamental change in the citizenship law, the government argues, could be an incentive for people to come and for those already living here to integrate better.

Plans to simplify the citizenship law

Legislation proposed by Interior Minister Nancy Faeser will make dual citizenship easier, as well as naturalization for non-EU citizens. It boils down to three main changes.

Immigrants legally living in Germany will be allowed to apply for citizenship after five rather than eight years. This shall go down to only three years if the applicant can show special integration achievements.

Children born in Germany of at least one parent who has been living legally in the country for five or more years will automatically get German citizenship.

Multiple citizenships will be allowed.

So far, only EU and Swiss nationals, and those whose country of origin does not allow people to renounce citizenship such as Iran, Afghanistan and Morocco, for example; refugees who are threatened with persecution in their home countries; and Israelis are generally permitted to hold on to their original passports when they get a German one.

Schneider believes that, for some of the approximately 1.3 million Turks who are living in Germany, “the dual passport may well be an incentive for naturalization.”

Opposition to reform

The new record figures for naturalizations have triggered another storm of protest among critics, especially from the largest opposition group, the center-right Christian Democrat Union and the regional Christian Social Union (CDU/CSU). Their parliamentary group’s spokesman, Thorsten Frei, told the daily newspaper Die Welt: “The plans of Interior Minister Nancy Faeser increase the risk that more people will be naturalized who are not sufficiently integrated.” He said there were no convincing reasons to lower the requirements for a German passport.

Currently, about 6 million foreign citizens have been living in Germany for over eight years. If the minimum period of residence for naturalization is set at five years, migration expert Schneider pointed out, most of them will meet the criteria for naturalization.

Although it is not possible to predict today whether parliament will approve the government’s bill, “a massive increase in naturalization applications” is to be expected, Schneider said. “Applications for naturalization are already piling up in many Citizens’ Offices,” he added.

Source: German citizenship: Record number of naturalizations

Germany: 20.2 Million People Had a History of Immigration in 2022

Ongoing trend:

The official statistical office of Germany, Destatis, has revealed that in 2022, around 20.2 million people with a history of immigration were living in the country, representing an increase compared to the previous year.

According to Destatis, the number of people that had a history of immigration in 2022 was 1.2 million or 6.5 per cent more than in 2021, when the total number of people with a history of immigration living in Germany stood at 19.0 million, SchengenVisaInfo.com reports.

“In 2022, 20.2 million people with a history of immigration were living in Germany. Based on micro census results, the Federal Statistical Office reports that this was an increase of 1.2 million, or 6.5 per cent, compared with the previous year (2021: 19.0 million),” the statement of Destatis reads.

Following an increase of 1.3 per cent compared to 2021, Destatis said that it means that the group of people with a history of immigration accounted for 24.3 per cent of the entire population in Germany.

The same noted that the proportion of men with a history of immigration living in Germany in 2022 stood at 24.8 per cent, slightly higher than that of women, which stood at 23.8 per cent.

In addition to the above-mentioned, Destatis also shared more specific data on the total population and their immigration history.

Data provided by Destatis show that in 2022, there were a total of 83.1 million people living in Germany. Of the total number, 71 per cent of the total number of the population in 2021 did not have an immigration history, 18 per cent of them were immigrants, six per cent were descendants, and five per cent had a parent with an immigration history.

Previously, SchengenVisaInfo.com reported that 17.3 per cent of people living in Germany in 2021 had immigrated since 1950. This means that 14.2 million people living in Germany in 2021 have immigrated to the country since then.

Another 4.7 million people living in the country in 2021 were descendants of immigrants, meaning that they were born in Germany, but both parents had immigrated to the country since 1950.

In general, the number of immigrants living in Germany in 2021 surpassed the EU average, which stands at 10.3 per cent. In terms of the number of immigrants, Germany ranked the seventh on the list in 2021, following Malta, Cyprus, Sweden, Luxembourg, Austria, and Ireland, which all had a higher percentage of immigrants.

Source: Germany: 20.2 Million People Had a History of Immigration in 2022 …

UK: Statistics watchdog rebukes Sunak over inaccurate asylum backlog figures

Always a risk with numbers:

Rishi Sunak and his immigration minister have been scolded by the UK statistics watchdog for using inaccurate figures to back up spurious claims about asylum seekers.

In a statement to the House of Commons in December, the prime minister claimed that the asylum backlog – 132,000 cases at the time – was half the size of the backlog left by the departing Labour government in 2010. This implied the backlog in 2010 would have been about 260,000.

In the same month, the immigration minister, Robert Jenrick, and the safeguarding minister, Sarah Dines, told MPs that 450,000 and 500,000 legacy cases had been left by the Labour government.

However, the UK Statistics Authority found the statements “do not reflect the position shown by the Home Office’s statistics”.

Source: Statistics watchdog rebukes Sunak over inaccurate asylum backlog figures

MPI: Naturalized Citizens in the United States

Useful background:

Naturalization is perhaps the most powerful marker of immigrants’ integration, as they take the fullest step towards participation in the civic life of their new country by becoming citizens. In the United States, naturalized citizens have the same privileges and responsibilities as U.S.-born citizens, including the right to vote and similar access to government benefits and public-sector jobs. They also receive the ability to sponsor immediate family members for immigration and cannot be deported.

More than 613,700 immigrants naturalized during fiscal year (FY) 2020, fewer than at any other point in the last decade. This decline may be partly due to impacts of the COVID-19 pandemic, including delayed oath ceremonies; the FY 2020 number represented a 27 percent decline from the 843,600 naturalizations the prior year, which marked the largest number since FY 2008 (see Figure 1). Notably, trends for new naturalized citizens do not necessarily follow those for new lawful permanent residents (LPRs). Overall, there were 23.2 million naturalized U.S. citizens in the United States in 2019, the most recent reporting available, making up 52 percent of the overall immigrant population, which stood at 44.9 million.

Figure 1. New Naturalizations and New Lawful Permanent Residents, FY 1980-2020

Source: MPI tabulation of data from U.S. Department of Homeland Security (DHS), Yearbook of Immigration Statistics (Washington, DC: DHS Office of Immigration Statistics, various years), available online; DHS, “Legal Immigration and Adjustment of Status Report Fiscal Year 2020, Quarter 4,” accessed July 30, 2021.

In recent years, institutional factors such as processing times and case backlogs have affected the number of annual naturalizations, as have financial constraints in meeting the citizenship application fee of $725 and immigrants’ personal decisions about whether to apply. While the number of new naturalized citizens has fluctuated each year, processing wait times have increased. The average processing time for N-400 applications for naturalization increased to 11.5 months in FY 2021, up from 9.1 months in FY 2020 and about 10 months in FY 2019.

In order to become a citizen, applicants must meet a set of requirements outlined in the Immigration and Nationality Act. These include maintaining lawful permanent residence, also known as getting a green card, for several years (generally five, though a green-card holder married to a U.S. citizen can naturalize after three years), proving basic proficiency in English and knowledge of U.S. history and government, and passing a background check to demonstrate good moral character. In addition to legal benefits, naturalized citizens also tend to have better economic outcomes than other immigrants, including higher incomes and rates of homeownership.

Using the most recent available data from the U.S. Department of Homeland Security (DHS) Office of Immigration Statistics, the U.S. Census Bureau (the most recent 2019 American Community Survey [ACS]), and other sources, this Spotlight provides information on new naturalized citizens in the United States, including historical trends, characteristics of naturalized citizens, and the population potentially eligible for naturalization.

Source: http://my.migrationpolicy.org/salsa/track.jsp?v=2&c=RWMKmxNCrz2UlS%2FeRjM5hkPuFzZ27T2g

Cross and Taylor: Lies, Damned Lies, And Race-Based Statistics

Reading this commentary reminded me of an anecdote that I can’t unfortunately locate: former PM Harper’s decision to replace the mandatory census with the voluntary, and less accurate, National Household Survey in 20ll was driven in part by the data being used by academics, advocates and activists as a basis for more progressive policies.

The alternative, as Cross and Taylor appear to advocate, is not to have visible minority breakdowns in the labour force survey to avoid this use of data. To my mind, it is a head in the sand approach as such data is needed to understand how well Canadian society is working in terms of economic integration.

COVID-19 has demonstrated the various inequalities between different groups. The regular censuses have also captured these inequalities as well so expanding this to the labour force survey (and public service employment equity reports) is consistent with long-standing practice.

To my mind, issues lie more with respect to how the disparities are interpreted, whether narrowly or looking at the range of factors that influence these disparities.

For example, when I look at public service employment equity data, groups that have lower levels of educational attainment (e.g., Blacks, Latin Americans) are less represented among occupations requiring university degrees. This disparity, of course, likely reflects in part earlier barriers and discrimination encountered by those groups (e.g., streaming of Blacks into non-academic streams, recently addressed by the Ford government).

Disaggregated date is need to be aware of disparities and point towards questions regarding the reasons for these disparities, and assess the degree to which policy interventions, and which kinds, may be warranted.

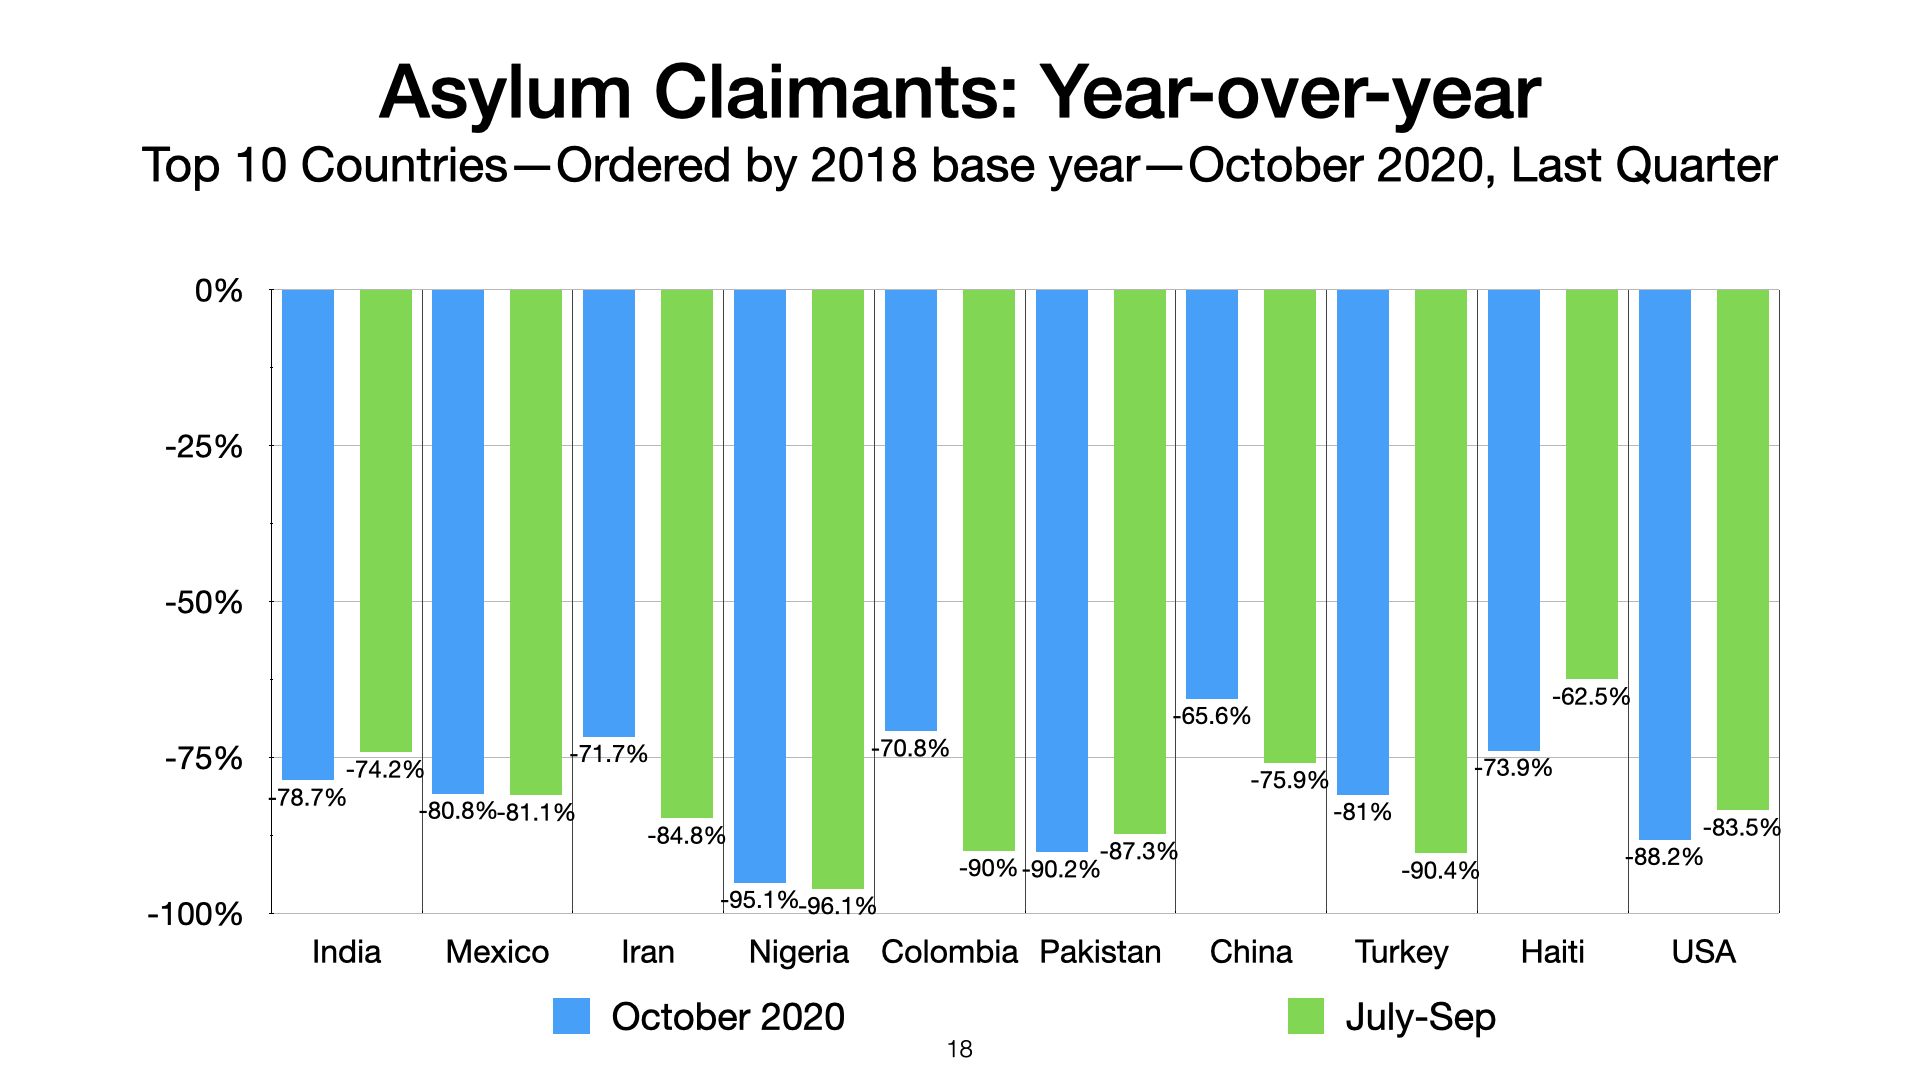
To their credit, Cross and Taylor do some analysis, looking at occupations and visible minorities, highlighting that Koreans, Filipinos and Southeast Asians are more concentrated in the accommodation and food service industry than not visible minorities as an explanation of why these groups were more affected by COVID-19 lockdowns.

But it is ingenuous, at best, to present socioeconomic circumstances as completely unrelated to barriers faced by some groups.

And of course, the data will be used and sometimes misused by advocates and activists, and one could argue that Cross and Taylor are equally and legitimately using data to support their position.

But curious for a former statistician to be arguing for less data and thus less needed information for evidence-based policy. And using France as a model?:

Since July, Statistics Canada has been publishing labour-market data divided into 12 ethnocultural categories including Chinese, South Asian, Southeast Asian, West Asian, Korean, Japanese, Arab, Black, Filipino, Latin American, White, and Others. Sliced this way, Statcan’s figures reveal the unsurprising fact that unemployment is unevenly distributed across Canada’s racial populations, just as it varies by region, gender and age. The adult Canadian unemployment rate in January was 9.4 percent, but 20.1 percent for Southeast Asians, 16.4 percent for Blacks and 16.6 percent for Latin American Canadians. “Others” had a slightly-better-than-average unemployment rate of 8.9 percent.

This move to produce racially-specific labour-market data may well have been inevitable, given the intersectional enthusiasms of Prime Minister Justin Trudeau, who recently declared his next budget will be an explicitly “feminist”document. It also follows logically from his government’s creation of Statcan’s Centre for Gender, Diversity and Inclusion Statistics in 2018. Equally predictable is the effect this new information has had on public discourse.

The release of race-based labour-market data has provided further fuel to the ascendent view that Canada is an inherently unfair and racist country. Lobby groups and organizations representing the various racial groupsidentified by Statcan have latched onto the new data to back up claims regarding the “negative labour market impact of racism on Black youth” and other collective sins aimed at Canadian society. The figures are also frequently held as proof that employment equity programs and other government market interventions must be scaled to industrial proportions to eliminate the discrimination baked into Canada’s labour market.

But when it comes to fomenting outrage, Statcan is just getting started. In a recent commentary in The Globe and Mail, Anil Arora, Chief Statistician at Statistics Canada, explained his organization’s intention to double down on the collection and dissemination of race-based data. Because the initial effort last July revealed such glaring “racial disparities”, he wrote, Statcan will now be using “data from varying lenses…to measure those inequalities and track the progress being made to address them.”

French law specifically forbids INSEE from processing or analyzing data regarding “ethno-racial classifications” because it could violate constitutional requirements that all citizens must be treated equally.Tweet

As exciting and progressive as all this may seem, however, Statcan should tread carefully. Collecting race data is inherently contentious and divisive, something all national statistical agencies must recognize. While the United States has a long history of collecting very detailed race-based data, others such as France’s Institut national de la statistique et des études économiques (INSEE) do not disseminate any race statistics. In fact, French law specifically forbids INSEE from processing or analyzing data regarding “ethno-racial classifications” because it could violate constitutional requirements that all citizens must be treated equally “without distinction of origin, race or religion.”

As we shall see, unequal racial outcomes revealed by national statistics do not necessarily prove racism, and often lead to intractable debates. This is especially so in a country like Canada, where there’s a large overlap between visible minorities and immigrants who historically take years to match the outcomes for Canadians born in the country. Feeding a culture of grievance that denies any role for cultural differences in generating observed inequality can, paradoxically, perpetuate unequal racial outcomes. And as the state of affairs in the U.S. suggests, a surfeit of race-based statistics is no guarantee of racial harmony.

Neither is Statcan exempt from the principle of opportunity cost. Collecting one set of data inevitably means foregoing others – some of which may be of greater value. For years, researchers from social policy groups such as Cardus have asked for better data on how marital status affects employment and income. This would provide more detail on the important role played by family in the labour market. Yet these requests have long been ignored for cost reasons. Statcan presumably has better things to do with its limited resources. Now, however, in the middle of a pandemic, the agency has suddenly discovered the means to produce divisive race-based unemployment data.

Pandemic and Race

There are many pitfalls and risks associated with attributing different outcomes experienced by different racial groups exclusively to race, especially when these accusations are based on superficial statistics. In its July 2020 labour market report that, for the first time, segmented unemployment by race, Statcan itself noted that the top line figures showing poorer outcomes for most visible minorities categories reflected, in large part, the tendency of certain racial groups to work in industries deeply affected by the pandemic.

For example, 19.1 percent of Koreans, 14.2 percent of Filipinos and 14.0 percent of Southeast Asians were employed in the accommodation and food industry, according to the 2016 Census, compared with only 5.9 percent of Whites. Given the dramatic effect the pandemic-related lockdowns and other measures have had on the hospitality sector, it seems reasonable to conclude that race played little or no role in these unequal outcomes. Rather, it was the circumstances of the industries they were working in.

It has also been widely reported that different racial groups contract Covid-19 at different rates. Some concluded that this was because these groups are particularly disadvantaged by a racist society, while others wondered whether particular racial groups might have a different genetic susceptibility to the virus. As a recent U.S. National Bureau of Economic Research study warns, merely noting differences among racial groups without knowing their source means “the political discourse can gravitate toward ‘biologic explanations’ or explanations based on racial stereotypes which are harmful in themselves and get in the way of policy solutions.” The same study made plain that it was the socio-economic circumstances of particular groups that affected their exposure to the virus. This was due to working in particular industries and using public transit, which increased their contact with other people and, in turn, led to a higher rate of infection. Once the data was corrected for these variables, visible minorities in the U.S. were found to be no more susceptible to the virus than whites.

Given how easily some data can be misinterpreted or misrepresented, it would seem that Statcan has a clear responsibility to caution users about its proper use. Figures regarding the distribution of federal government revenues and spending by province, for example, are regularly twisted by politically-motivated analysts and governments. As a result, Statcan published an article in 2007 offering a detailed explanation for why these statistics should not be considered a scorecard for which provinces are gaining or losing from their dealings with the federal government.

Much of the current debate over racism in Canada arises from the presumption that all aspects of life should be perfectly evenly distributed, and that any deviation from pure equality must be considered prima facie evidence of systemic racism. Tweet

It is, accordingly, curious that these new race-based labour-market figures do not come with a similar warning; race data is far more emotionally and politically incendiary than provincial fiscal data. It is also surprising that Statcan did not directly address the issues raised by France’s refusal to collect race-based data.

Racism of the Gaps

Much of the current debate over racism in Canada arises from the relatively recent presumption that all aspects of life should be perfectly evenly distributed, and that any deviation from pure equality (a term also recently redefined from equality of opportunity to sameness of outcomes) must be considered prima facie evidence of systemic racism. With dizzying speed, this eminently contestable claim has been elevated nearly to conventional wisdom.

In an insightful commentary published earlier this month by the Macdonald-Laurier Institute, Vancouver-based writer Sonia Orlu tackled head-on the notion that “any disparity in outcomes between blacks and whites is the direct result of racism, as opposed to class differences, culture, personal ‘(ir)responsibility,’ or any other myriad of situational factors.” As Orlu, who is black, points out, this “racism of the gaps” generally relies on surface-level observations lacking in context or detail.

Nowhere is this assumption more explosive than regarding claims that members of visible minorities are disproportionately targeted, arrested or killed by police. As Orlu points out, a case for systemic racism in policing can only be proven with detailed race-based data showing police interactions as a share of the overall criminal population, rather than the population at large. While racism may create the conditions in which visible minorities commit more crime, simply arresting more visible minorities is not, in and of itself, proof police are acting with racist intent.

Orlu notes, however, that Canada does not collect the sophisticated race-based data necessary to come to an informed observation on this heated topic. With only the most basic statistics available regarding race, arrests and incarcerations, it is easy to conclude that police actions are driven by racism rather than other factors. And even when detailed race and crime evidence is available, as it is in the U.S., Orlu points out it is generally ignored by the media and public because it does not align with popular “anti-racism ideology” narratives. More information, in this case, does not produce a better debate or better decisions.

This problem is further illuminated by economist Tim Harford in his fascinating new book The Data Detective. Harford offers the example of an algorithm called COMPAS (Correctional Offender Management Profiling for Alternative Sanctions) used in the U.S. to predict the probability of a criminal being re-arrested. Because the algorithm produced racially disparate results – giving higher probabilities for blacks to be re-arrested than whites under similar circumstances – it was accused of perpetuating systemic racism. And yet the algorithm itself was colour-blind; race was not an input factor.

A detailed investigation by a team of statisticians revealed that the differing results were the product of members of different races behaving differently and/or living in different neighborhoods. As Harford concluded, “The only way in which an algorithm could be constructed to produce equal results for different groups…would be if the groups otherwise behaved and were treated identically.” Such an outcome adds evidence to the proposition that unequal results between races do not prove racism if behaviour and circumstances differ.

Examples of the racism gap fallacy are in ample supply elsewhere. Last month, for example, Akim Aliu, a former NHL player and founding member of the lobby group Hockey Diversity Alliance, claimed that an observed lack of racial diversity in the National Hockey League could only have one possible source. “There are still owners in the league who don’t even believe [racism] is a problem,” Aliu complained to Reuters in a Black History Month article. “To me that is just unfathomable, 95 per cent of your league is white and you don’t see there is an issue of race.”

Yet visible minorities make up a vast majority of the lineups in many other sports. The National Basketball Association is 74 percent black, and the National Football League 68 percent. While the Canadian Football League does not provide readily-accessible race-based statistics, the number of black players in this league also appears to far exceed representation in the general population. Should all this be taken as self-evident proof that football and basketball are equally prejudiced, but in favour of visible minorities? Of course not.

In another fixation on gaps, Statcan’s Arora in his Globe and Mail commentary emphasizes the importance of moving “toward levelling the uneven economic playing field”, citing the unequal unemployment and poverty rates among immigrant women as a key example. It must be noted, however, that there is a large overlap in Canada between visible minorities and immigrants. The lagging labour market outcomes for visible minorities and other Canadians reflect the long-standing challenges of immigrants establishing themselves in Canada.

In 2016, for example, Canada admitted thousands of Syrian refugees, many with limited education and little or no knowledge of either of Canada’s official languages. Do inferior incomes and more joblessness among the women of this group in the short time since they arrived prove the “playing field” in Canada is uneven? Inferior outcomes for some players don’t necessarily indicate a tilted field, it may merely demonstrate that they were sent out onto the field without the skills and training needed to compete. It is also worth remembering that the prevalence of poverty and inequality of income is much greater in the countries most immigrants come from, than is their inequality compared with native-born Canadians.

 The Inconvenient Truth that some Minority Groups Outperform the Majority

Racism – defined as the presence of deep-seated prejudices that affect individual and collective behaviour – certainly exists in Canada, as it does in all countries. And wherever present, it should be challenged and overcome. That said, collecting race-based data may not contribute to that worthy goal at all. It could instead cultivate a mentality of grievance and entitlement that undermines the impetus for individuals to strive to achieve more for themselves and their children. Look how easy it was for Aliu, for example, to take a simple statistic regarding the race of NHL players and turn it into a bitter accusation.

Arora’s recent Globe commentary, meanwhile, laments the “many economic challenges facing racialized populations, Indigenous people, persons with disabilities and other marginalized groups” as proof of the need for Statcan’s big move into race data. But might it not be more useful to study how certain minority groups have overcome even-greater challenges in the past? Few groups have suffered more persecution and discrimination than Jews, yet their internal culture enabled Jewish people to achieve superior results in multiple fields of endeavour in country after country. Japanese Canadians are another example, overcoming their forcible removal from their homes to be quarantined in remote camps during the Second World War, and going on to achieve one of the highest income levels of any racial group.

It is too easy to dismiss the achievements of certain races or ethnic groups as the result of advantages and privileges. While the lagging performance of some visible minorities is automatically assumed to be evidence of Canada’s innate racism, the opposite conclusion is never drawn from the superior results displayed by other minority groups (such as Chinese, to use Statcan’s terminology) in terms of employment, scholastic achievement or avoidance of crime. Looking south of the border, pre-Covid U.S. Census Bureau data revealed that the real median household income of Asian-Americans is nearly 30 percent higher than that of whites.

Thomas Sowell, the renowned black economist at the prestigious Hoover Institution at Stanford University, has written extensively on the use and misuse of race-based data. His insights on the importance of the culture internalized within racial groups provides a good lesson on the pitfalls of superficial interpretations of race data. As Sowell observed in his 2013 book Intellectuals and Race: “Different races, after all, developed in different parts of the world, in very different geographical settings, which presented very different opportunities and restrictions on their economic and cultural evolution over a period of centuries.” Further, people tend to blame racial differences on bias, which ignores “internal explanations of intergroup differences in favor of external explanations.”

As Sowell noted wryly in his 1996 book Black Rednecks and White Liberals, “all things are the same except for the differences, and different except for the similarities.” Given current demands for diversity in all things, he was observing, why should anyone expect identical outcomes as a result? Perhaps that comment should be attached to every Statcan press release on racial differences in the labour force survey.

The Politics of Distribution Versus the Economics of Growth

There is a growing sense of malaise in Canada, including worry that we are falling well short of our economic potential. Our political and economic leaders ought to be focusing on creating the macroeconomic and cultural conditions wherein all groups can thrive. Instead, our country’s growing fixation on racial issues – including the collection of race data – invites policymakers to think in terms of improving Canada one micro-group at a time.

We have already seen its nefarious impact. The most salient fact of the Covid-19 pandemic has been its devastating impact on all of Canada, with 5.5 million people losing their jobs or having their work severely curtailed in the spring of 2020. Rather than proposing general solutions to support growth and allow the reopening of the economy, numerous special interest groups have used the pandemic as an excuse to advance their particular pet policy projects, re-packaging old proposals that have circulated for years or decades to “solve” a once-in-a-lifetime crisis. The ideas include greater provision of day care, universal basic income, universal Pharmacare, extended employer-paid sick leave and so on, almost ad infinitum, as if budget constraints no longer existed.

The greater influence of broad economic conditions than specific social policies is revealed by Arora’s own reference to the “significant progress” visible minorities were making towards equality before the pandemic set them back. He cited a sharp drop in poverty and “rapidly rising employment rates among working-age immigrant women” as evidence of this happy situation. Such pre-pandemic levels of achievement – closing numerous gaps with the rest of society – was not the product of programs targeting specific aggrieved minority groups, but the result of an improving and robust economy-at-large. As Canada as a whole grows, its gaps shrink.

The best way to resuscitate the fortunes of visible minorities is the same as for all other Canadians: reopen the economy as quickly as possible and adopt policies and attitudes aimed at supporting long-term economic growth. Tweet

The same phenomenon was in even greater evidence in the U.S., where wage gains in 2019 were led by the lowest wage-earners, especially visible minorities. In recognition of this, more Latino and black voters cast ballots for Donald Trump last November than in 2016, despite his obvious negative attributes. The clear lesson is that better macroeconomic policy and economic growth always outweigh the impact of targeted government programs.

It is important to remember that the reversal of fortunes for minorities during the pandemic was because our economy was struck by the economic equivalent of a thermonuclear device, not because Canada overnight became more racist. The best way to resuscitate the fortunes of visible minorities, therefore, is the same way as for all other Canadians: reopen the economy as quickly as possible and adopt policies and attitudes aimed at supporting long-term economic growth.

Statcan’s new race-based data invites the facile conclusion that one group’s success explains another group’s relative failure and justifies its grievance. And our faltering economic growth reinforces the sterile view that the size of the economic pie is fixed and any gain by one group comes at the expense of others. The result is a focus on the politics of distribution instead of the economics of growth.

To be fair, Statcan did a lot of good work in response to the pandemic. This includes flash estimates of GDP, adjustments to how it measures labour under-utilization, more timely data on firm turnover, and innovative ways to track population mobility during a lockdown. The agency’s recent move into race-based data does not, however, rank among these useful innovations. And its effects may outlast all the others due to the appeal it holds for groups dedicated to fanning the flames of internal complaint.

With race-based data now being widely disseminated, this process may be unstoppable. Any move to cut off funding for this project will be widely condemned by the many vocal advocates of the “race industry”. Canadians should thus prepare themselves for a steady stream of studies in the coming years declaring the presence of gaps that allegedly prove the existence of systemic racism, but which tell us nothing about their origin or the best way to reduce them. All this is an unfortunate but costly distraction from the bigger and more important issues of innovation, investment and entrepreneurship that will be necessary to restore an economy that will benefit all Canadians – of every race and colour.

Philip Cross is a senior fellow of the Macdonald-Laurier Institute and the former chief economic analyst at Statistics Canada. Peter Shawn Taylor is senior features editor of C2C Journal.

Source: https://c2cjournal.us19.list-manage.com/track/click?u=e8efce716429c34122979e2de&id=ca577642d5&e=4174a59277

COVID-19 Impact on Immigration: October data

The latest October numbers for Permanent Residents, asylum seekers and study permits (international students). Unfortunately, the data tables for temporary residents have not been updated since August, and citizenship not since June.

Permanent residents

Overall, permanent resident admissions are down by 51.8 percent in October 2020 compared October 2019, and  42.9 percent year to date. Family and refugee categories have declined more than the economic category.

With respect to Provincial Nominee Program, declines have been less in Alberta and British Columbia than other provinces.

Transition from temporary residents to permanent residents account for close to 40 percent of total admissions in 2020 year to date, with the post-graduate work program and the International mobility program being relatively less affected that international students and the temporary foreign worker program (note some double counting between these programs and overlap with the Provincial Nominee Program). 

Asylum claimants have declined dramatically given travel and border restrictions (particularly airport arrivals), from an average of over 5,000 a month in 2019 to an average of less than 1,300 April to October 2020. Inland claims accounted for 56 percent of all claims in 2019, and for 81 percent April to October 2020. 

International students (study permit holders have declined from an average of 35,000 per month in 2019 (with summer seasonal peaks) to 27,000 April to October 2020, with some variation among countries of origin (citizenship) year to date as well as by province of destination.

Quebec stops publishing daily COVID-19 data despite leading country in number of cases UPDATED: Quebec reversal

Update: Quebec announced that it will continue publishing the data on a daily basis following an outcry (Québec recule: les données sur l’évolution de la pandémie seront publiées sur une base quotidienne). Still curious about the rational behind the original decision.

——-

Not sure this strategy will address the “communications” issue as weekly reporting will likely continue to highlight Quebec’s relatively poor performance both domestically and internationally.

Not a great example of transparency and accountability.

Will change my weekly update to accommodate their Thursday release schedule:

Quebec’s Health Ministry says it will only provide weekly reports about COVID-19, rather than providing a daily rundown of the situation.

The province’s public health institute, INSPQ, had also been publishing daily updates, including the number of cases and hospitalizations in Quebec, the number of tests conducted and how many people have died.

The data was also broken down by age and region and showed how many long-term care homes have outbreaks.

The move from daily to weekly updates appears to mean Quebec is providing data less frequently than any other Canadian province, despite leading the country in number of cases. Ontario, which has the second-highest number of cases, continues to provide daily numbers.

As of Thursday, Yukon’s Emergency Measures Organization is providing a public update once per week — but the territory has only 11 confirmed cases.

Prime Minister Justin Trudeau addressed the change in his daily news conference on COVID-19 Thursday, saying it’s up to each province to decide how transparent it needs to be.

He also said that Quebec still has a “significant number of cases” and deaths every day.

“I certainly hope that Premier [François] Legault would continue to be transparent and open with Quebecers and indeed with all Canadians as he has been from the very beginning,” Trudeau said.

The Health Ministry and INSPQ will only publish the data on their respective websites every Thursday, the first of them beginning July 2. The ministry will also be sending out a news release with the figures on that day every week.

The decision was first announced in a news release on Fête nationale, the province’s annual holiday.Dr. Horacio Arruda, the province’s public health director, said Thursday that the decision was made in order to provide the public with “more stable numbers,” as fewer confirmed cases each day will make any day-to-day increase appear more significant than it is.

He said this would also allow the province to provide a more accurate portrait of how the virus is spreading, as reporting delays have often prompted a revision of the daily numbers.

“As soon as there is some important data to share with the population, we will do that.” Arruda said, suggesting that the daily updates could return in the event of a second wave of infections.

The government announcement appeared to take the INSPQ by surprise. A notice on its website Tuesday said it would begin limiting its updates to weekdays only, rather than seven days a week.

But on Thursday, following the Health Ministry’s announcement, it said it too would only provide a weekly update. A spokesperson referred any questions to the Health Ministry.

The number of daily cases and deaths in Quebec has declined in recent weeks.As of Thursday, 55,079 people in Quebec have tested positive for the coronavirus that causes COVID-19. That’s an increase of 142 new cases since Wednesday.

There are 487 people in hospital and 5,448 have died. A total of 520,227 tests have come back negative.

The Quebec government has allowed most businesses to reopen, including restaurants, bars, gyms and shopping malls, with physical-distancing restrictions in place.

Source: Quebec stops publishing daily COVID-19 data despite leading country in number of cases

Statistics are great unless they measure the wrong things: Don Pittis

Always a risk, particularly in today’s economy:

If prices are rising by about two per cent, as inflation data is likely to show this week, why did one of my newspaper subscriptions just go up by 17 per cent?

And if wages are rising at about four per cent, as recent jobs data has shown, why are some provincial governments insisting that wage increases be held below one per cent?

As house prices go through the roof, the fact that the price of the biggest purchase Canadians make in their lives is not included in our inflation statistics makes it easy to see why many young people have expressed doubts about the accuracy of those figures.

It is a struggle that Statistics Canada faces every day as it tries to sketch out with numbers an authentic picture of the reality Canadians experience. But Oxford fellow and bestselling author of Age of Discovery Chris Kutarna says the task is far more complicated than many statisticians like to admit.

Kutarna worries that Statistics Canada’s plan to plunge into the ocean of “Big Data” so beloved of retailers and credit card companies — described last week by chief statistician Anil Arora — will inevitably create bias in the results simply because we are measuring the wrong things.

“One of the terrifying and most fundamental sources of risk is that we only consider what we’re now measuring as real,” said Kutarna, on the phone from London, England.

For example, long-standing data sets built on debt, spending, prices and gross domestic product simply close the door on values such as family, respect, happiness and species extinction.

“There is far more that is real and not being measured than there is that is real and we are measuring it,” said Kutarna.

One practical example from his book is the failure of modern statistics to measure the value of the online encyclopedia Wikipedia which, despite providing value to billions, adds less to GDP figures than the old Encyclopedia Britannica which reached far fewer people.

In a recent speech, Stephen Poloz, governor of the Bank of Canada, described an economy changing so fast that our statistical models fail to grasp it.

Poloz paraphrased the Solow Paradox, the observation by economist Robert Solow that computers had led to an increase in productivity everywhere but in the statistics. Poloz suggested GDP is being understated by as much as two per cent.

One example he offered was the way so many companies are distributing computer services to the cloud, turning whole computer divisions into a budget line item.

“How does StatCan deal with that?” asked Poloz.

Last week, Arora boasted to a gathering of the Empire Club that Statistics Canada was respected everywhere as a global leader, but he acknowledges it is constantly struggling to keep up with changing technology and the shifting understanding of how the world works.

“Look, that’s what statistics is, right? To take what are evolving concepts, nebulous concepts, things that haven’t even taken a lot of shape and then quickly try to turn them into numerics,” said Arora in an interview.

The statistics chief calls it a “team sport” where governments and individuals need to decide which of the millions and millions of things that could possibly be measured should be addressed by the some 5,000 employees at Statistics Canada. Their job, he says, is to bring scientific rigour to the process, so that the numbers are as accurate as possible.

“This is always going to be a journey,” said Arora, adding that finding and incorporating into our figures what have so far been labelled intangibles may be a never-ending task.

Part of that journey that those employees are now undertaking is the attempt to mine the immense bodies of information embedded in Big Data, those traces of activity we leave behind when we do almost anything on the internet from buying to searching. Not only are they readily available for quick analysis but they reduce the employee hours required in traditional surveys.

“Alternate sources of data are increasing exponentially and we have the technologies and the mechanisms to convert them to public good with high quality statistics,” said Arora in his speech.

When it comes to the inadequacies of GDP, a big part of the problem has less to do with Statistics Canada than how we continue to use familiar indicators that may be out of date.

Arora says the University of Waterloo’s Canadian Index of Wellbeing includes 200 indicators — from crime and safety to sustainable growth — most of which come from Statistics Canada data. But it’s GDP that gets the attention.

Statisticians are always groping to find the data sets that matter. But even in areas we think we know and understand, statistics are merely an indicator — an estimate, of reality. Things we don’t understand are, by definition, even harder to measure.

“We live in this culture where what is real is what we measure,” said Kutarna, “That the things we measure are reality.”

In which case, a certain amount of healthy skepticism, whether about this week’s inflation numbers, about GDP, productivity or the many other financial statistics that are often offered as solid immutable facts, may well be in order.

Source: Statistics are great unless they measure the wrong things: Don Pittis