Adam: Racial minorities have more concerns than cash as PSAC strikes

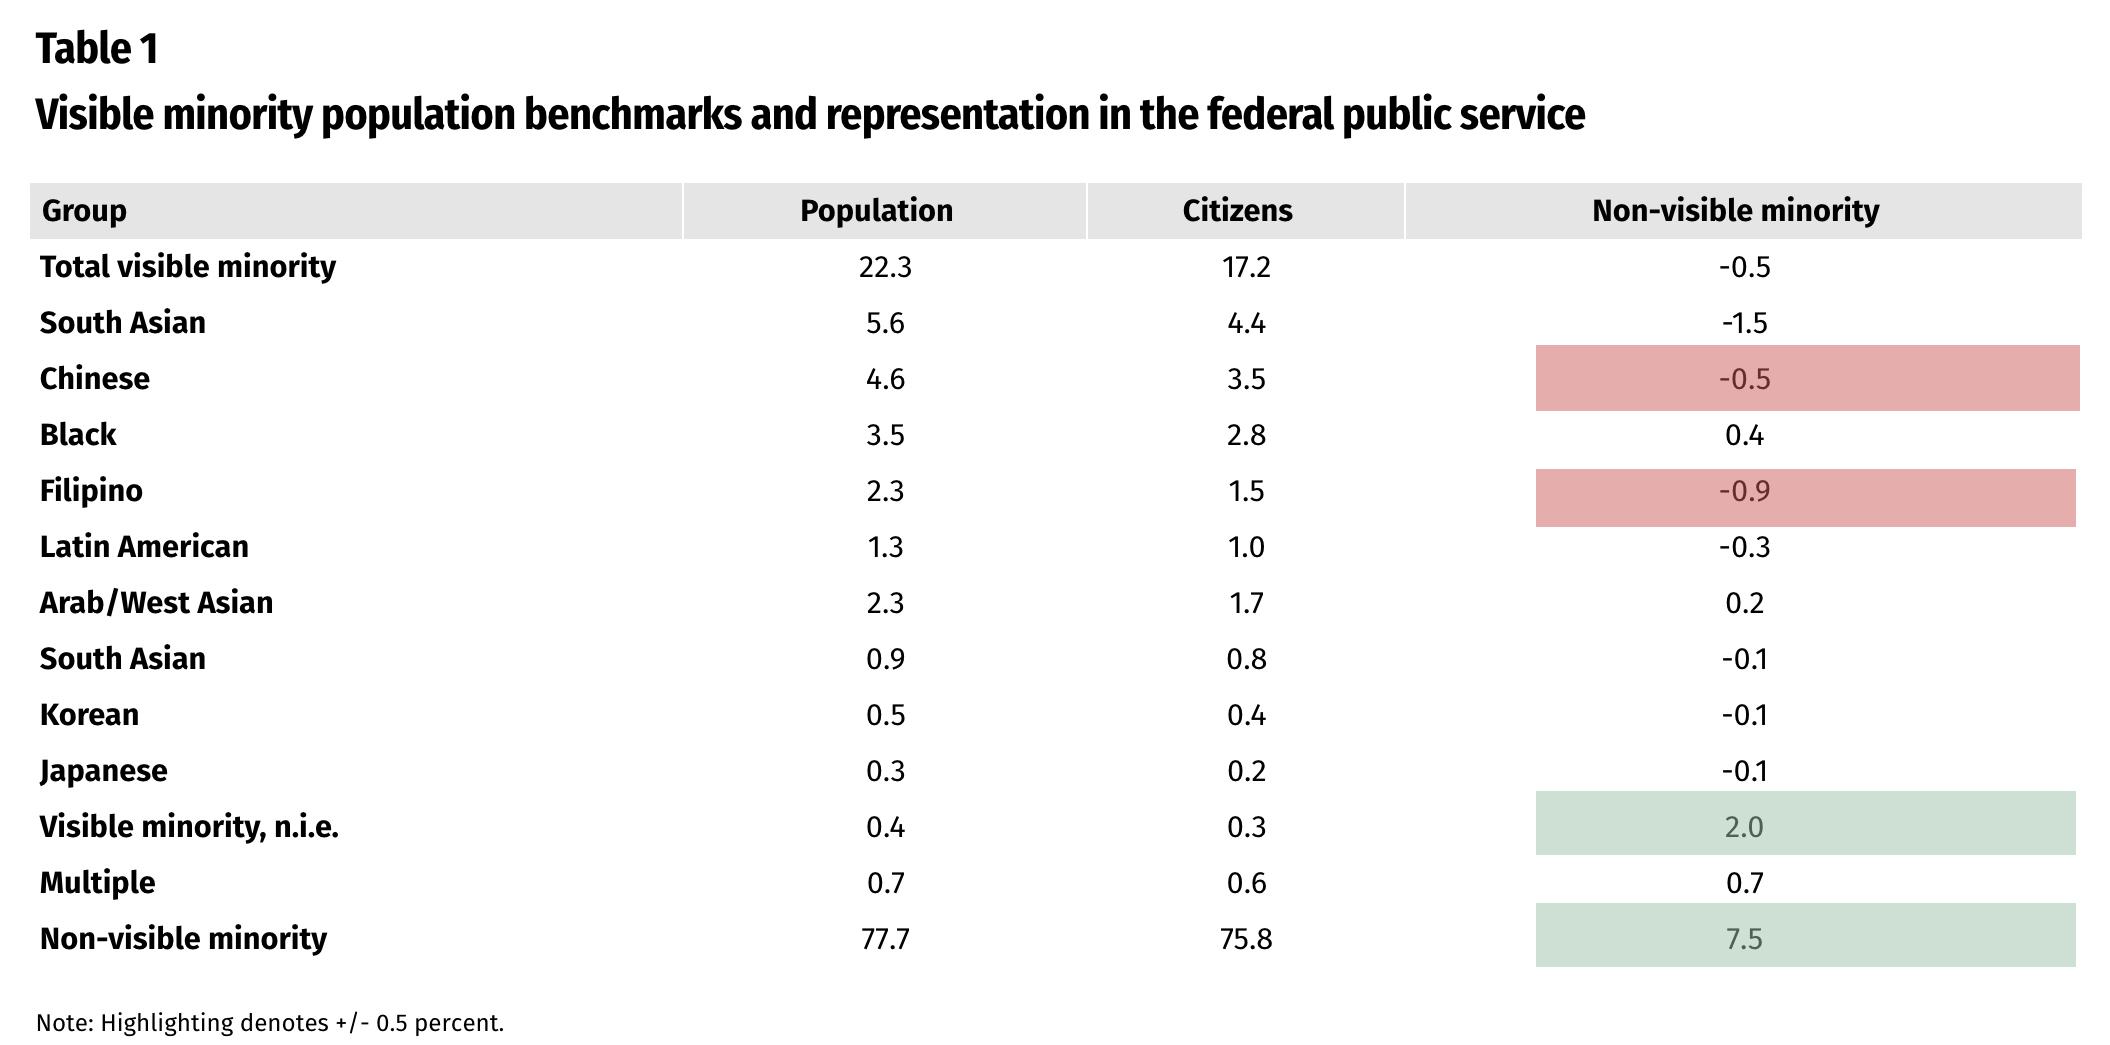
TBS desegregated visible minority and gender data for the last six years portrays increasing diversity, with net hirings (hirings less separations) and promotions significantly greater for visible minorities than not visible minorities. Highlights the danger of over-emphasizing personal stories rather than analyzing the data more closely:

Massive disruptions to government services were expected across the country as thousands of public servants went on strike this week in a dispute over wages and working conditions. The walkout affects 155,000 workers, but about 47,000, who are classified as essential workers, will remain on the job. That leaves some 100,000 for the picket lines.

The strike comes at a time when Canadians are struggling with the high cost of living, and many small businesses still have yet to fully recover from the effects of the pandemic. The public service union however, says its members have been affected by inflation, and is demanding a 4.5 per cent annual raise. At the time the strike was called, the federal government had offered three per cent, which the union rejected. The striking workers must walk a fine line to ensure public support because Canadians may be in no mood to tolerate a long walkout.

Significant as it is, the strike should not overshadow what, for many Black and other minority public servants, is an existential crisis: the lack of advancement that has confined them to low-paying entry-level jobs, and undermined their dignity and self-worth. Imagine working in the same job for 20 or 30 years and never getting a promotion. The shame of it is that this is what’s happening to Black and other minority employees of our federal government.

In the Citizen last week, Sandra Griffith-Bonaparte revealed how she never got a promotion in 22 years as a public servant at the Department of National Defence. It’s not because she lacks ambition. She worked hard to acquire two undergraduate degrees from Carleton University, as well as a master of arts and public ethics at St. Paul’s University and the University of Ottawa. She applied for numerous promotions but was rejected by her employer, watching as others climbed the job ladder and left her behind.

It was as if her employer was telling her she is not wanted; she doesn’t belong there. “Time and again, I’m either blocked, overlooked, ostracized, and this has me questioning: Why?” she said. “My story is not unique, this is happening all over in the Canadian government, in the public service in the city, in provincial workplaces.”

Indeed. Her case is a reflection of the discrimination many Black and minority people face in the public service: qualified people trapped in the same job for decades without any hope of progress or advancement, simply because of the colour of their skin.

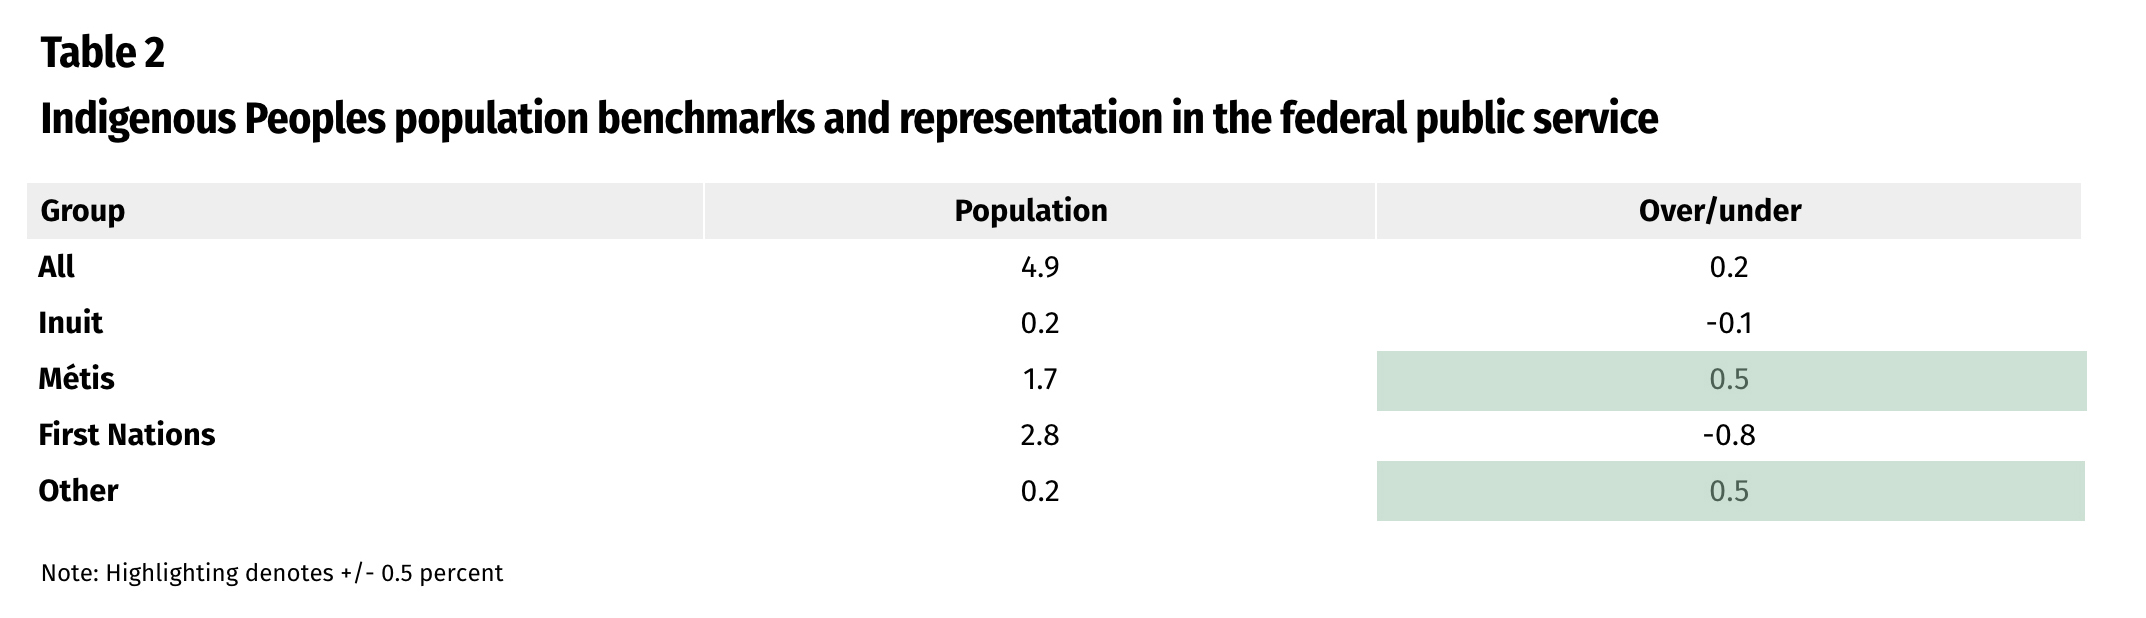
It shows in a 2021-22 Treasury Board employment equity report, which lays out how Indigenous people, Blacks and other members of so-called visible minorities continue to languish in the lowest salary ranks in the public service, while fewer and fewer of them are found in the higher levels.

It is this kind of discrimination that prompted a group of public servants to launch a lawsuit against the federal government seeking redress and compensation. The lawsuit highlights stories of others like Griffith-Bonaparte — people who have been toiling at the lower echelons of the public service for decades.

There is Carol Sip, a former Canada Border Services Agency employee whose supervisor constantly made derogatory remarks to her without management doing anything about it. She worked 26 years without promotion. Then there is Jennifer Phillips, who worked for the Canada Revenue Agency for 30 years and was promoted only once. Time and again, she watched as people she trained get promoted.

None of the claims in the class action lawsuit has been proven in court, but the sad thing is that these people were not looking to fill quotas or get preferential treatment. All they wanted was the same opportunity given to others to compete and advance on merit.

Responding to the equity report, Treasury Board president Mona Fortier promised the government would do better to build a more “inclusive and diverse” public service. When confronted with problems, politicians have a habit of offering comforting words without any real action. Federal workers are on strike for more money, but for racial minorities, there’s much more than cash at stake.

Mohammed Adam is an Ottawa journalist and commentator. Reach him at nylamiles48@gmail.com

Source: Adam: Racial minorities have more concerns than cash as PSAC strikes

Why doctors want Canada to collect better data on Black maternal health

Need this for many groups:

A growing body of data about the heightened risks faced by Black women in the U.K. and U.S. during pregnancy has highlighted the failings of Canada’s colour-blind approach to health care, according to Black health professionals and patients.

Black women in the U.K. and U.S. are four times more likely to die in pregnancy or childbirth than white women, according to official data. A recent U.K. study published in The Lancet found that Black women’s risk of miscarriage is 40 per cent higher than white women’s. In Canada, that level of demographic tracking isn’t available.

“For our country, we don’t have that data. So it’s difficult to know exactly what we’re dealing with,” said Dr. Modupe Tunde-Byass, a Toronto obstetrician-gynecologist, and president of Black Physicians of Canada. “We can only extrapolate from other countries.”

Source: Why doctors want Canada to collect better data on Black maternal health

Public Service Disaggregated Data for Visible Minorities and Indigenous peoples, Citizenship status

Over the past few months, I have been analyzing the various datasets breaking down public service employment and employee survey data by the individual visible minority and Indigenous groups.

The three articles, What new disaggregated data tells us about federal public service diversity (Policy Options, October 2020), What the Public Service Employee Survey breakdowns of visible minority and other groups tell us about diversity and inclusion (The Hill Times, November 2020) and Diversity and Inclusion: Public Service Hirings, Promotions and Separations (The Hill Times, March 2021) allow for a more comprehensive view of visible minority and Indigenous groups in the federal public service. Moreover, recent Public Service Commission studies analyzing recruitment of employment equity groups add an important element to discussions on public service staffing and recruitment practices.

Much of the debate and discussions have understandably focussed on Blacks in the public service. Yet public service data indicates that their situation is not unique in terms of representation, hirings and promotions and the employee satisfaction, with many commonalities with the other groups. A more granular analysis within each occupational group (i.e., comparing representation at each level by occupational group, as some departments are conducting, may very well provide such evidence).

Key findings are:

  • Overall EE analysis shows considerable variation among the different visible minority and Indigenous groups
  • Visible minorities
    • Correlation between lower educational attainment and representation for most groups save Chinese
    • Overall under-representation common to most groups
    • Blacks, West Asian/Arab small over-representation
    • EX: All groups under-represented save Japanese with Filipino, Latin American and Blacks having the largest gaps
    • Hirings: Hirings of visible minorities have increased for all groups in most occupational groups save for technical and administrative support. Hirings at the EX level have increase for Black, Chinese, South Asian/East Indian and West Asian/Arab, with other groups showing no increase.
    • Promotions: While promotions have increased marginally for virtually all groups at the agregate level, promotions by occupational category provide a mixed picture, with most groups and most occupational categories experiencing a marginal decline in promotions.
  • Indigenous peoples
    • First Nations under-represented, Métis and Inuit over-represented
    • Hirings: While hirings at the EX level have increased slightly, this is less the case for the other occupational categories. Hirings of Métis have increased the most in the operational category, hirings of First Nations the most in the technical category, while hirings of Inuit the most at the EX level.
    • Promotions: A marginal decline across all Indigenous groups and occupational
  • Harassment/Discrimination experiences vary
    • Harassment: Japanese report the most as do First Nations and Métis, Chinese and Filipino least satisfied with resolution as is the case with Métis
    • Discrimination; Blacks report the most, but all groups encounter discrimination on the basis of race, ethnic origin or colour. Black, Japanese and Latin American least satisfied with resolution. All Indigenous groups report having been discriminated against, mainly based on race or ethnic origin, with Métis also least satisfied with resolution

The recent PSC Audit of Employment Equity Representation in Recruitment provides some interesting data and analysis of the staffing process and how the different employment equity groups, and visible minority largest sub-groups, fare at each of the five stages in the staffing process: job application, automated screening, organizational screening, assessment and appointment (FY 2016-17 data).

The most significant stages were organizational screening and assessment where most filtering took place as shown in the table below:

The next table breaks down visible minorities by the largest groups:

As noted in the audit, Blacks have the largest decrease in representation at all stages save for appointment, with a non-negligible being screened out by automatic screening. Chinese are screened out more by organizational screening whereas West Asian and South Asian are more likely to be screened in as the assessment stage.

The audit provides the following explanation for visible minority groups. Overall, visible minority women have higher success rates than visible minority men at the organizational screening and assessment stages. Visible minorities screened out at the organizational screening stage due to citizenship status (Canadian citizens are given preference over non-citizens) and experience qualifications. Those with public service work experience were more likely to be screened in at this stage but overall “experienced less success than their counterparts regardless of whether or not they had federal public service experience.”

At the assessment stage, visible minorities were less successful when written tests were used, particularly the case for Black candidates.

A separate PSC report addresses the Citizenship of applicants and external appointments. While Canadian citizens have a hiring preference, the share of non-citizen applicants has risen from 9.4 percent in 2015-16 to 14.5 percent in 2018-19, with the share of hires has increased to 2.5 percent from 1.5 percent over the same period

Non-citizen visible minority applicants account for 22.9 percent of all visible minority applicants, for non-visible minorities, the share is only 12.1 percent.

The table below contrasts applicants and appointments by citizenship status for the past four years. For Canadian citizens, the percentage of applicants and appointments are comparable, for Permanent Residents and others, appointments are significantly greater than applicants suggesting that citizenship may be less of a barrier than commonly believed.

Visible minority Canadian citizens represented 17.2 percent of all applicants and 19.5 percent of all hires (2018-19).

RCMP Quietly Releases Race-Based Data Showing Number Of Black Employees

Now that this data is available, good to see it becoming requested. One suggestion for requesters, whether parliamentarians, journalists, academics or others: ask for data for all visible minority groups in order to have needed context for each visible minority group, as knowing whether Black public servants are over or under-represented compared to not visible minority can either overstate or understate representation issues:

The Royal Canadian Mounted Police (RCMP) quietly released employment statistics showing 1.5 per cent of regular members in officer roles identify themselves as Black.

The data was disclosed in a document tabled in the House of Commons last week in response to a written question submitted by NDP MP Jack Harris in October.

Harris sits on the House’s public safety committee currently studying systemic racism in policing in Canada. In an order paper question, he asked the RCMP to provide demographic details about employees and asked for statistics about staff who self-identify as Indigenous, Black or “another visible minority.”

According to the document, of the permanent, regular RCMP members, 1.6 per cent described themselves as being of “mixed origin” as of Oct. 27, 2020. Slightly more employees who self-identified as Black hold non-police officer roles.

There are two categories of non-officer roles: civilian members and public service employees. Though both are considered public service workers, the distinction between them is determined by the conditions of their employment.

Civilian members, such as psychologists and 9-1-1 dispatchers, are hired under the RCMP Act, while public service workers are hired under the Public Service Employment Act.

Approximately 19,000 police officers are employed by the RCMP, according to the national police force. As of last year, just over 3,400 people were employed as civilian employees and nearly 7,700 people as public service employees.

Among public service employees, slightly more people (1.8 per cent) identified themselves as Black. One per cent of respondents self-described as “mixed origin.”

Among civilian members, the number is lower. Less than one per cent (0.9 per cent) of civilian members self-identified as Black, and 1.2 per cent as “mixed origin.”

The disaggregated data gives new insight into the RCMP’s demographics.

Source: RCMP Quietly Releases Race-Based Data Showing Number Of Black Employees

What new disaggregated data tells us about federal public service diversity

My latest in Policy Options, taking advantage of disaggregated employment equity data:

Just how diverse is the federal public service? This question recently has attracted more scrutiny, particularly when it comes to the inclusion of Black Canadians in the bureaucracy. Before February, no Black person had made it to the deputy minister rank of the public service – Caroline Xavier is now associate deputy minister of immigration, refugees and citizenship. The speech from the throne included a commitment to “Implementing an action plan to increase representation in hiring and appointments, and leadership development within the public service.”

Now, for the first time, the federal government is providing disaggregated data related to the diversity of the public service as part of its Employment Equity Report. The Treasury Board Secretariat’s (TBS) report looks at the three fiscal years from 2016-19 by occupational group. Previously, disaggregated data for visible minority and Indigenous individuals employed in federal public administration (excluding the military) was only available through census data every five years. We now have the tools to do a more granular analysis of visible minority representation in each occupational group and see where work remains to be done. Table 1 looks at the overall visible minority representation in Canada, the visible minority population that are citizens, and the numbers shared in the government’s equity report. The citizenship number is taken here as a benchmark, since citizens are given preference in government staffing processes. This gives us a picture of the degree to which there is under-representation of certain groups compared to the citizenship-based benchmark. A note about the terminology: I have used the term visible minority, as do Statistics Canada and the Treasury Board Secretariat. Indigenous Peoples are their own category for data purposes, and do not fall under visible minority. While the visible minority group definitions are similar to those used by Statistics Canada, TBS groups Arab and West Asians together under “non-white West Asian, North African or Arab.” “Mixed Origin” refers to those with one visible minority parent. The representation of most groups is relatively close to their share of the citizenship population, with South Asian, Chinese and Filipino public servants less represented.Table 2 takes the same approach with respect to Indigenous representation with the exception that total and citizenship-based populations are identical, showing relative under-representation of First Nations and Inuit people.Table 3 compares the representation of each visible minority by occupational group, expressed as the percentage difference with non-visible minority, non-Indigenous employees for the three-year period 2017-19. For most groups, relative representation has not shifted dramatically from 2017 to 2019, with general under-representation in the executive, technical and operational categories.Among executives, no group has improved its representation by one percent or more from 2017 to 2019, with only individuals of mixed origins showing an increase of 0.6 percent, and Black, Filipino and Southeast Asian people showing marginal increases (0.1, 0.3 and 0.1 percent respectively). Table 4 similarly compares the representation of each Indigenous group by occupational groups, expressed as the percentage difference with non-visible minority, non-Indigenous employees for the three-year period 2017-19 (for the executive and technical occupational groups, there are fewer than five Inuit public servants, and thus the federal government does not provide numbers out of concern for privacy).While this analysis highlights the differences in visible minority and Indigenous representation among the different occupational categories, it does not break it down by seniority level. TBS declined to provide a disaggregated breakdown for assistant deputy ministers (level EX4-5) and directors and directors general (level EX1-3) given that breaking down the numbers to those subgroups would present a privacy risk. But TBS did say that of the 335 ADMs, 30 are visible minority (9.0 percent) and nine Indigenous (2.7 percent). Black Canadians are the visible minority group with the strongest numbers in the public service compared to their share of the citizen population, but their representation is overwhelmingly in the two administrative categories. This is not unique – there is significant under-representation among Latin American, Chinese, Filipino and South East Asian groups in the executive ranks of the public service. A similar general pattern can be found with Indigenous public service representation. With this type of disaggregated data in hand, policy discussions and responses can be based more solidly on evidence rather than relying on examples and anecdotes about who works in the public service. With better data, the government can hopefully build a more representative and inclusive public service at all levels.

Source: What new disaggregated data tells us about federal public service diversity

For those interested, the TBS dataset used can be found here: Employment Equity Sub-Group Population in the Public Service of Canada