#COVID-19: Comparing provinces with other countries 17 June Update – No major change
2020/06/18 Leave a comment
Latest update:
Working site on citizenship and multiculturalism issues.
2020/06/18 Leave a comment
Latest update:
2020/06/04 Leave a comment
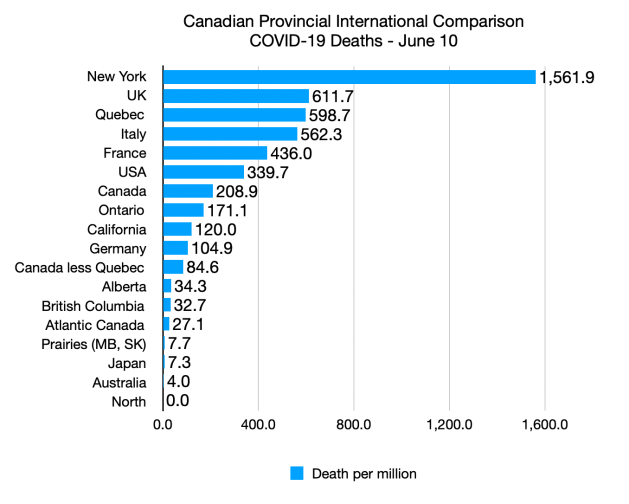
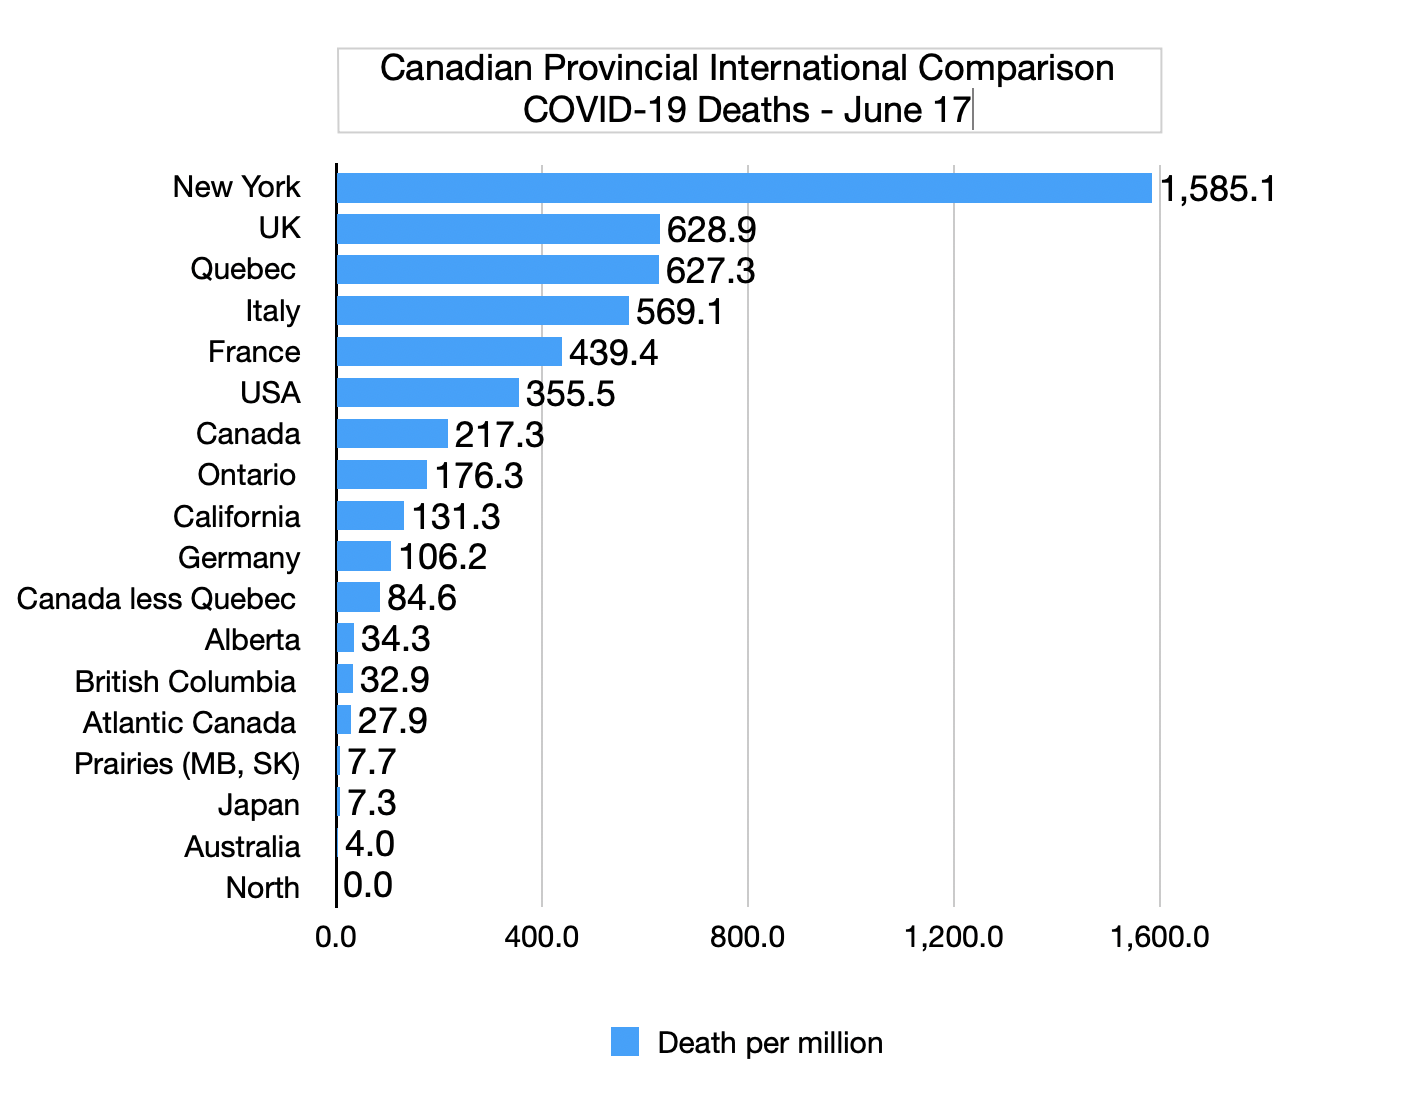
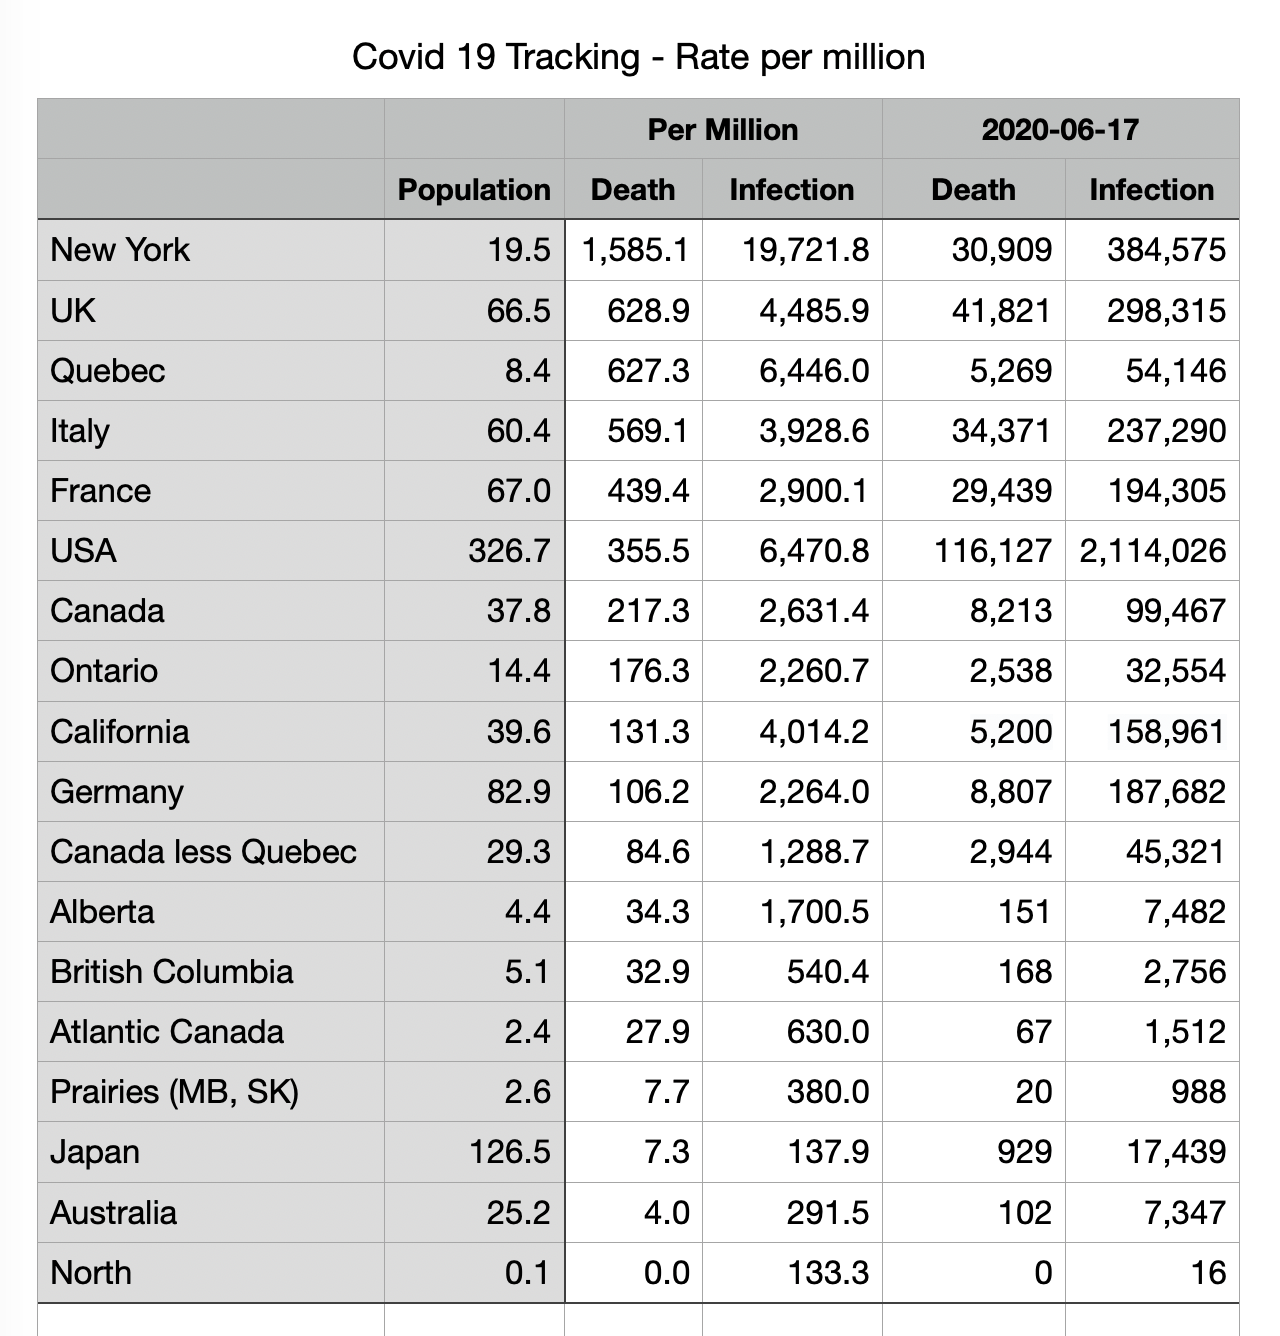
Quebec now has the third highest death rate per million: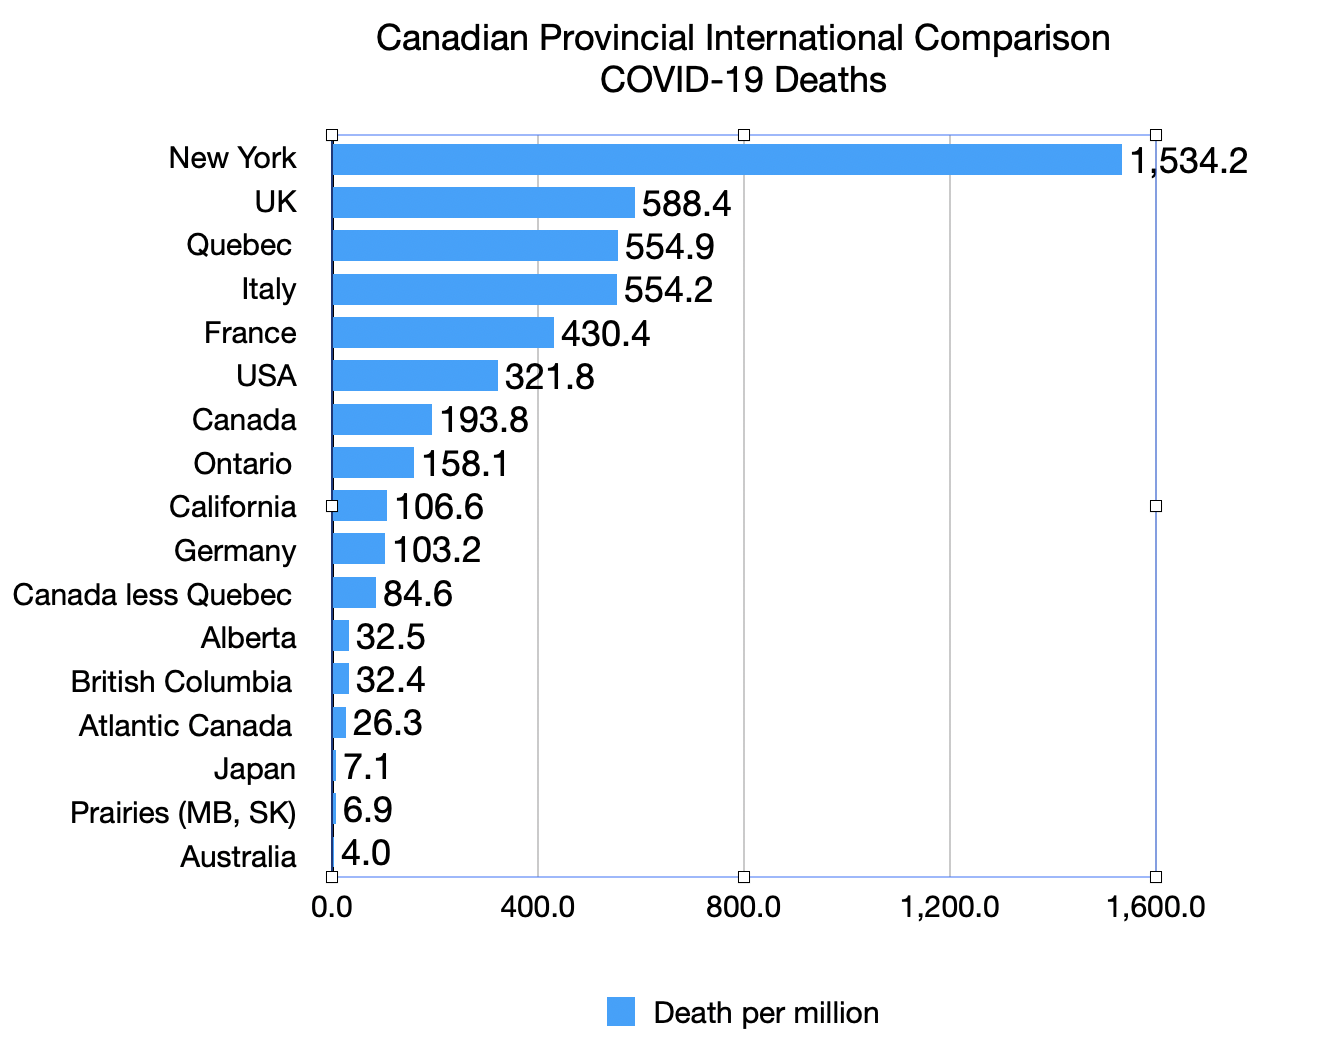
|
Per Million |
Jun 3 |
||||
|
Population |
Death |
Infection |
Death |
Infection |
|
| New York | 19.5 | 1,534.2 | 19,062.1 |
29,917 |
371,711 |
| UK | 66.5 | 588.4 | 4,176.5 |
39,127 |
277,738 |
| Quebec | 8.4 | 554.9 | 6,113.6 |
4,661 |
51,354 |
| Italy | 60.4 | 554.2 | 3,860.9 |
33,475 |
233,197 |
| France | 67.0 | 430.4 | 2,826.1 |
28,836 |
189,348 |
| USA | 326.7 | 321.8 | 5,544.2 |
105,147 |
1,811,277 |
| Canada | 37.8 | 193.8 | 2,426.1 |
7,326 |
91,705 |
| Ontario | 14.4 | 158.1 | 1,962.7 |
2,276 |
28,263 |
| California | 39.6 | 106.6 | 2,903.9 |
4,220 |
114,993 |
| Germany | 82.9 | 103.2 | 2,214.6 |
8,555 |
183,594 |
| Canada less Quebec | 29.3 | 84.6 | 1,288.7 |
2,665 |
40,351 |
| Alberta | 4.4 | 32.5 | 1,600.9 |
143 |
7,044 |
| British Columbia | 5.1 | 32.4 | 509.2 |
165 |
2,597 |
| Atlantic Canada | 2.4 | 26.3 | 612.9 |
63 |
1,471 |
| Japan | 126.5 | 7.1 | 133.1 |
900 |
16,834 |
| Prairies (MB, SK) | 2.6 | 6.9 | 361.9 |
18 |
941 |
| Australia | 25.2 | 4.0 | 286.5 |
102 |
7,221 |
2020/05/28 Leave a comment
A number of us were discussing COVID-19 and the wide variances between different provinces in terms of infections and deaths. So we decided to see what the data looked like, comparing Canada and its provinces to other G7 countries and Australia, with New York and California.
The table below dramatizes just how. bad the situation is in Quebec, where Quebec has the second highest level of infections and the fourth highest level of deaths per million, comparable to the worst hit European countries (data from the Globe’s daily tracker) Canada without Quebec is better than any other G7 country save Japan.
On the other hand, it highlights the West and Atlantic Canada with lower infection and death rates..
|
Per Million |
2020-05-27 |
||||
|
Population |
Death |
Infection |
Death |
Infection |
|
| New York | 19.5 | 1,502.7 | 18,658.3 | 29,302 | 363,836 |
| UK | 66.5 | 558.3 | 4,009.1 | 37,130 | 266,602 |
| Italy | 60.4 | 545.6 | 3,817.1 | 32,955 | 230,555 |
| Quebec | 8.4 | 492.7 | 5,785.5 | 4,139 | 48,598 |
| France | 67.0 | 425.9 | 2,729.1 | 28,533 | 182,847 |
| USA | 326.7 | 302.8 | 5,146.7 | 98,929 | 1,681,418 |
| Canada | 37.8 | 175.6 | 2,292.2 | 6,639 | 86,647 |
| Ontario | 14.4 | 147.4 | 1,818.8 | 2,123 | 26,191 |
| Germany | 82.9 | 101.2 | 2,186.9 | 8,386 | 181,293 |
| California | 39.6 | 96.6 | 2,520.5 | 3,826 | 99,810 |
| Canada less Quebec | 29.3 | 84.6 | 1,288.7 | 2,500 | 38,049 |
| Alberta | 4.4 | 31.6 | 1,568.4 | 139 | 6,901 |
| British Columbia | 5.1 | 31.6 | 498.2 | 161 | 2,541 |
| Atlantic Canada | 2.4 | 25.8 | 612.9 | 62 | 1,471 |
| Japan | 126.5 | 6.7 | 131.4 | 846 | 16,623 |
| Prairies (MB, SK) | 2.6 | 5.8 | 356.2 | 15 | 926 |
| Australia | 25.2 | 4.1 | 283.3 | 103 | 7,139 |
| Canadian population 2019, other countries 2018 | |||||
| Canada less Quebec | 29.3 |
84.6 |
1,288.7 |
2,500 |
38,049 |

Click image for book purchase