Minister says 300,000 new immigrants a year is Canada’s ‘new normal’ – Home | The House | CBC Radio

Setting the stage for the 2018 levels announcement. Not much suspense in that the number will be higher; some suspense as to whether the government will announce a multi-year plan as long talked about. Some political risks in doing so as steady increase may provoke some reaction, and possible political benefits to the government’s brand.:

Canada’s immigration minister says Canada will welcome at least as many immigrants next year as it is in 2017.

The government’s plan for annual immigration levels, which was set at 300,000 for this year, is expected to be tabled in the House of Commons next week.

Immigration minister Ahmed Hussen told The House that the government will not go below that level next year.

“Three hundred thousand is now our new normal,” he said, while not closing the door to a higher number for 2018.

“As a government we went from 260,000 to 300,000 because of the need to meet the demands of Canadian families who wanted to reunite with their loved ones,” Hussen continued. “But also employers who are asking us to allow them to continue to use immigration more and more as a way to meet their growth needs.”

Hussen added that he’s been in the process of consultations since April to put together the immigration outlook that’s coming soon, and that those consultations focused on the numbers Canada should bring in and what the right mix immigration, in terms of the different classes, should be.

He said the “vast majority” of immigrants coming in will be from the economic class because that’s where the greatest need is.

This will be followed closely by family class immigrants and then refugees, Hussen said.

Statistics Canada census numbers released Wednesday revealed the number of immigrants in Canada has reached its highest rate in a century.

Source: Minister says 300,000 new immigrants a year is Canada’s ‘new normal’ – Home | The House | CBC Radio

Income gap persists for recent immigrants, visible minorities and Indigenous Canadians

The Stars’s highlighting of the recent Census release:

As the face of Canada grows more diverse, the income gap between residents who identify as visible minorities, Indigenous or recent immigrants and the rest of Canadians remains a yawning chasm, data from the 2016 Census shows.

The income gap for these groups barely budged between 2006 and 2016, narrowing by just two percentage points for Indigenous Canadians and recent immigrants and widening by one percentage point for visible minorities, according to census data released Wednesday.

Total income was 26 per cent lower for visible minorities than non-visible minorities and 25 per cent lower for Indigenous Canadians than non-Indigenous Canadians.

But recent immigrants — many of whom are also visible minorities — face the toughest economic challenge with total incomes that fall 37 per cent below total incomes for Canadians born here, the data shows.

It means for every dollar in the pocket of someone born in Canada, a recent immigrant has just 63 cents.

More than 22 per cent of Canadians — including 51.5 per cent of Torontonians — reported being from a visible minority community in 2016, up from 16.3 per cent nationally in 2006.

In Toronto, more than 55 per cent of visible minority residents were living on less than $30,000 in 2016 compared to fewer than 40 per cent of the rest of the city’s population, according to census data provided to the Star.

While almost 14 per cent of non-visible minorities in Toronto reported total incomes of $100,000 or more, just 4 per cent of people from visible minority communities had access to that amount of cash in 2016.

“The latest census data simply confirms the reality that racialized people, recent immigrants, and Indigenous people continue to face discrimination and that income inequality doesn’t just magically reverse itself,” said Sheila Block senior economist for the left-leaning Canadian Centre for Policy Alternatives.

“That takes political leadership,” added Block who crunched the national income gap from the latest census data on immigration, ethnocultural diversity and aboriginal peoples.

“As these populations increase and continue to lag behind, it becomes a bigger issue for everybody,” she said.

“We know this kind of inequality doesn’t only have a negative impact on the population that’s affected, but it has a negative impact on us overall as a society.”

Increases to income support programs such as social assistance, employment insurance and pensions are part of the solution, she said. But labour reform, including more access to unionization and a higher minimum wage are also key.

Nadira Begum, who has a master’s degree in social work from her native Bangladesh, juggles three part-time jobs and numerous volunteer positions in the non-profit sector but still hasn’t been able to land full-time work.

“I have been looking for a full-time job in my field for more than 10 years,” said the Regent Park mother of three. “I have the skills, the experience and the knowledge, but if they don’t hire me, how can I show them? It is a common story in our community.”

Begum’s part-time jobs have often involved substantially similar work as full-time employees, and yet she has been paid a lower wage. Friends with part-time jobs as grocery store clerks who were hired the same time as full-time clerks are paid less and enjoy fewer benefits, Begum added.

“We are not equally paid, even though we do the same work,” she said. “And we can’t complain because we can’t afford to lose our jobs.”

Deena Ladd of the Workers’ Action Centre says Ontario’s planned $15 minimum wage by 2019 will be a huge boost for visible minorities, recent immigrants and Indigenous workers, who are more likely than the rest of Canadians to be toiling for minimum wage.

But changes to the province’s proposed Fair Workplaces, Better Jobs Act are needed to ensure these workers, who like Begum are often stuck in temporary, part-time and contract positions, are paid the same as permanent and full-time staff, Ladd said.

Wording in the proposed minimum-wage legislation currently mandates equal pay for equal work if the job is “substantially the same,” Ladd said. But that allows employers to change one aspect of the job and still be allowed to pay temp, contract and part-time workers less.

Instead, the proposed legislation should be reworded to say these workers are entitled to equal pay if the job is “substantially similar” to work performed by a full-time employee, she said.

Another problem with the proposed law is the definition of seniority. Unlike all other provisions of the Employment Standards Act which measure seniority by the date an employee was hired, the equal pay amendments include a definition of seniority as “hours worked.” If this is not changed, workers from economically disadvantaged groups who are more likely to work part-time, will never achieve equal pay for equal work, Ladd said.

“The new legislation has the potential to address the kinds of inequities highlighted by the census,” she said. “But if we don’t strengthen the language so workers can use the equal-pay protections in their workplaces in a strong way, then it will be just words on paper.”

The legislation, which just passed second reading, is expected to become law later this year.

Ryerson University professor Myer Siemiatycki, who teaches immigration and settlement studies, says the census findings are a wake-up call and a reminder of why the census is important.

“These are worrying statistics,” he said. “They reflect the adverse living conditions of huge numbers of Canadians who fall into these three categories of population . . . It’s an alarm bell and we need to respond.”

Source: Income gap persists for recent immigrants, visible minorities and Indigenous Canadians | Toronto Star

New figures show just how big Canada’s immigrant wage gap is

One of the first deeper looks at Census data, looking at immigrant status, language and income by Arvind Magesan of U of Calgary. The November release of language at work, education etc will further enrich this analysis:

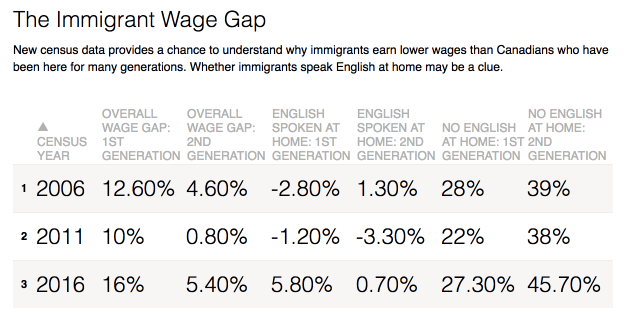
The first thing that surprised me is the gap has not changed much over the past 10 years. Census data from 2006 showed, at a national level, first-generation immigrants earned wages 12.6 per cent less than the average wage of native Canadians. In 2011, the gap dropped slightly to 10 per cent, but the new census data shows it’s climbed significantly to 16 per cent.

wagegap1

Importantly, the gap is a countrywide phenomenon. Looking at the three of the most popular destinations for immigrants in the past decade — Toronto, Vancouver and Calgary — the gap in 2016 sits at 25, 17 and 23 per cent respectively.

Interestingly, the gap doesn’t only exist for first-generation immigrants, but also for the children of immigrants (second generation, i.e. Canadians born to immigrant parents). The new data shows at the national level, second-generation immigrants earn 5.4 per cent less than natives.

Understanding the wage gap

The obvious question that follows then is: What is the source of these gaps?

Canada is an especially interesting case given the “points” system used to screen potential immigrants, where language, education and job skills are key determinants. And for the first time, the census has reported that about six out 10 new immigrants came here under the so-called economic admission category, meaning they have the skills “to enhance and promote economic development.”

Given the way immigrants are screened before entry, one would expect relatively quick integration into the Canadian economy and a convergence in wages. But this is clearly not the case.

The reasons put forward to explain the wage gap range from employer difficulty in assessing immigrant education credentials to outright discrimination. Economists refer to two types of “discrimination” in the labour market context, “statistical discrimination” and “taste-based discrimination.”

In the former, employers use observable traits (such as race) to make inferences about something like productivity. For example, an employer sees a job applicant with brown skin. The employer isn’t prejudiced towards brown people, but is worried (stereotypically) the employee is going to want to take trips “home” to Sri Lanka and would need a lot of vacation time. So the employer hires someone else equally qualified. Taste-based discrimination is more what we think of as prejudice — not wanting to hire someone purely because of skin colour.

Identifying causal factors that explain the wage gap is a difficult task – individuals who immigrate to Canada do so by choice. These choices are a function of a host of factors that could potentially jointly explain the decision to immigrate and labour market outcomes, including personal characteristics, job experience and education, to name just a few. Identifying discrimination in the labour market, and separating between taste-based and statistical discrimination, is even harder.

However, a 2011 study by University of Toronto economist Phil Oreopolous takes an important step in this direction.

In the study, thousands of computer-generated resumes were mailed out to companies that had posted ads searching for employees. The resumes were randomly assigned either a foreign or a “white” sounding last name, and were otherwise identical. The result: The resumes where the applicant had a foreign-sounding last name were less likely to receive a call back than identical looking resumes with a “white” last name.

When the author followed up with some of the recruiters, the overwhelming reason given for overlooking resumes with a foreign-sounding name was that they anticipated difficulty with language. Specifically, recruiters expected a lack of fluency in English, problems with communicating at work and difficulty for customers and co-workers in understanding a foreign accent. In other words, recruiters were statistically discriminating between job candidates based on their names.

Can language proficiency close the gap?

The census presents an opportunity to study the importance of English proficiency for the gap in labour market earnings between immigrants and native Canadians in 2016. The census provides information on wages, immigrant (and generation) status, as well as the language most commonly spoken at home.

Specifically, guided by the findings in Oreopolous’s study, I looked at how the gap in average wages changes when English is spoken at home. (For the purpose of this study, I looked at communities outside of Quebec, where French is the dominant language.) In 2016, 63 per cent of new immigrants living outside of Quebec most often spoke a language other than English or French while at home.

The latest census data says the native-first generation immigrant wage gap is 16 per cent at the national level. Once we examine whether immigrants speak English at home, things change — the wage difference is just 5.8 per cent. But for first-generation immigrants who don’t speak English at home, the gap jumps to 27.3 per cent.

For second-generation immigrants, there is barely any gap for those who speak English at home (0.7 per cent) but it’s still a significant gap for those who don’t speak English at home (a whopping 45.7 per cent).

This pattern also holds in the major metropolitan centres in the English-speaking parts of the country, which attract the most immigrants.

Interestingly, at almost 25 per cent, Toronto has one of the largest city level wage gaps in the country, explained at least in part by the fact that new immigrants tend to land in Toronto first and are more likely to be unemployed for a period of time. The three largest cities in English-speaking Canada, which also attract the most immigrants, also have gaps larger than the national average.

In Ottawa, immigrants of either generation who speak English at home actually earn more than natives on average. While it may be tempting to attribute the major differences across the cities to differences in culture, they are more likely due to regional differences in industrial composition and attendant labour demand.

The wage gap for immigrants who don’t speak English at home is very large. In Toronto and Calgary, first-generation immigrants who don’t speak English at home can expect to earn 37 per cent less than natives. Perhaps even more interesting is the fact that the gap across all cities for is larger for second generation immigrants who don’t speak English at home.

wagegap2

Though these patterns are striking, they should not be interpreted as causal – immigrants can’t necessarily start speaking English at home and expect to see their future earnings increase. There are unobserved qualities of individuals that may correlate both with the tendency to speak English at home as well as with labour market earnings potential. Without holding these fixed in some way, we can’t say whether there is a causal relationship between English skills and the gap in labour market outcomes.

But supposing that the findings here are suggestive of a causal relationship, why does speaking English at home matter so much?

One obvious answer is that individuals who speak English at home speak better English in general — and this would mean better communication at work. This would be consistent with the worries that the recruiters in Oreopolous’s study had when deciding who to call back. Or perhaps individuals of foreign descent that speak English at home tend to have other important skills on average.

The ConversationBut another possibility is the labour market discriminates against individuals with weaker English skills even when English is not important for productivity. Sorting between these different explanations (and others) will require more data and a deeper look.

Source: New figures show just how big Canada’s immigrant wage gap is – Macleans.ca

The Daily — Immigration and ethnocultural diversity: Key results from the 2016 Census

On Census Day, 21.9% of the population reported they were or had ever been a landed immigrant or permanent resident in Canada. This proportion is close to the 22.3% recorded during the 1921 Census, the highest level since Confederation.

In 2016, Canada had 1,212,075 new immigrants who had permanently settled in Canada from 2011 to 2016. These recent immigrants represented 3.5% of Canada’s total population in 2016.

The majority (60.3%) of these new immigrants were admitted under the economic category, 26.8% were admitted under the family class to join family already in the country, and 11.6% were admitted to Canada as refugees.

For the first time, Africa ranks second, ahead of Europe, as a source continent of recent immigrants to Canada, with a share of 13.4% in 2016. Asia (including the Middle East) remains, however, the top source continent of recent immigrants. In 2016, the majority (61.8%) of newcomers were born in Asia.

Toronto, Vancouver and Montréal are still the place of residence of over half of all immigrants and recent immigrants to Canada. More immigrants are settling in the Prairies and in the Atlantic provinces.

In addition to contributing to the social and economic development of the country, immigrants and their descendants play a significant role in shaping and enriching the ethnic, cultural and linguistic composition of the Canadian population. The 2016 Census results released today show the various facets of diversity in Canada.

More than one in five Canadians are foreign-born

According to the 2016 Census, there were 7,540,830 foreign-born individuals who came to Canada through the immigration process, representing over one-fifth (21.9%) of Canada’s total population. This proportion is close to the 22.3% recorded during the 1921 Census, the highest level since Confederation.

The proportion of the foreign-born population was much lower from 1951 to 1991, when it ranged from 14.7% to 16.1%. Since then, this proportion has been continually rising, to 19.8% in the 2006 Census and 20.6% in the 2011 National Household Survey.

This increasing share is due to the large number of immigrants admitted into Canada each year, the gradual rise in the number of deaths and the relatively low fertility levels in Canada.

According to Statistics Canada’s population projections, the proportion of Canada’s foreign-born population could reach between 24.5% and 30.0% by 2036.

Figure 1: Number and proportion of foreign-born population in Canada, 1871 to 2036

About 6 in 10 recent immigrants were admitted under the economic category

With the 2016 Census, it is now possible to classify immigrants admitted to Canada since 1980 by various admission categories.

In Canada, immigrants are selected based on three main objectives: to enhance and promote economic development; to reunite families; and to fulfill the country’s international obligations and uphold its humanitarian tradition.

Among recent immigrants living in Canada in 2016, approximately 6 in 10 were admitted under the economic category, when principal applicants, spouses and dependants were taken into account. Almost half (48.0%) of recent economic immigrants were admitted through the skilled workers program and more than a quarter (27.3%) under the provincial and territorial nominees program.

Furthermore, nearly 3 in 10 recent immigrants were admitted under the family class to join family already in the country, and approximately 1 in 10 recent immigrants were admitted to Canada as refugees.

Refugees accounted for a higher proportion (24.1%) of immigrants admitted from January 1 to May 10, 2016, as a result of the many Syrian refugees who landed during this period.

The situation is different for immigrants who were admitted during the 1980s and were still living in Canada in 2016. A smaller proportion were economic immigrants: 4 in 10 immigrants were admitted under this category, while over 3 in 10 immigrants were sponsored by family, and approximately 2 in 10 immigrants were refugees.

Figure 2: Distribution (in percentage) of immigrants living in Canada, by admission category and year of immigration, 2016

Additional information is available in the infographic “Gateways to Immigration in Canada” as well as in data products and reference products.

More immigrants are settling in the Prairies

Over the past 15 years, the share of recent immigrants in the Prairie provinces has more than doubled. The percentage of new immigrants living in Alberta rose from 6.9% in 2001 to 17.1% in 2016, a higher share than in British Columbia (14.5%). In Manitoba, the percentage increased from 1.8% to 5.2% during the same period. Saskatchewan’s share also grew, from just under 1.0% in 2001 to 4.0% in 2016.

In 2016, the Atlantic provinces were home to 2.3% of all recent immigrants in Canada. Each of the Atlantic provinces received its largest number of new immigrants, which more than doubled the share of recent immigrants in this region in 15 years.

Ontario, Canada’s most populous province and the place of residence of most of the country’s immigrants, received 39.0% of recent immigrants in 2016. This share decreased from 55.9% in 2001.

British Columbia also saw its share of recent immigrants decrease over the past 15 years, from 19.9% in 2001 to 14.5% in 2016.

In 2016, 17.8% of recent immigrants lived in Quebec, a higher share than in 2006 (17.5%) and in 2001 (13.7%). Overall, Quebec had the second highest number of recent immigrants in 2016, after Ontario.

The territories had the fewest number of recent immigrants. In 2016, 2,100 newcomers, or 0.2% of all recent immigrants, settled in the territories.

Several factors can explain changes in the geographic distribution of new immigrants. For example, certain provinces received a large number of immigrants under the Provincial and Territorial Nominee Program: over 50% of recent immigrants living in Prince Edward Island, New Brunswick, Manitoba, Saskatchewan and Yukon were admitted under this program. At the national level, 16.4% of all recent immigrants were admitted under this program.

Moreover, many new immigrants chose to settle in areas with an established community from their home country.

The economic conditions in the various receiving regions undoubtedly played a major role in the geographic distribution of immigrants. According to the Labour Force Survey, Alberta had the largest employment growth from 2011 to 2016 (+7.8%) compared with the national average (+5.0%).

Figure 3: Distribution (in percentage) of recent immigrants in Canada, by provinces and territories, 1981 to 2016

Census metropolitan areas in the Prairies receiving a higher share of recent immigrants

In 2016, the Regina, Winnipeg, Calgary, Saskatoon and Edmonton census metropolitan areas (CMAs) were the place of residence of a share of recent immigrants that was almost twice that of each CMA‘s share of the total population in Canada. For example, 4.3% of new immigrants settled in Winnipeg, while 2.2% of Canada’s total population lived in this CMA.

Nevertheless, Toronto, Vancouver and Montréal, the three most populous CMAs in the country, together are still the place of residence of over half of all immigrants (61.4%) and recent immigrants (56.0%) in Canada. In comparison, just over one-third (35.7%) of Canada’s total population lived in these three CMAs.

In 2016, immigrants represented 46.1% of Toronto’s population, 40.8% of Vancouver’s and 23.4% of Montréal’s.

For the first time, Africa accounts for the second largest source continent of recent immigrants

In 2016, 13.4% of recent immigrants were born in Africa, a four-fold increase from the 1971 Census (3.2%). Africa thus ranked second, ahead of Europe, as a source continent of recent immigrants to Canada.

Nigeria, Algeria, Egypt, Morocco and Cameroon were the top five countries of birth of recent African-born immigrants in 2016.

As a result of shifts in Canada’s immigration policies and various international events relating to movements of migrants and refugees, the percentage of recent immigrants born in Europe has decreased from one census to the next, falling from 61.6% in 1971 to 16.1% in 2006 and to 11.6% in 2016.

Asia (including the Middle East) remained the top source continent of recent immigrants. The majority (61.8%) of newcomers to Canada from 2011 to 2016 were born in Asia. This is a slightly higher proportion than was observed in the 2006 Census (58.3%) and in the 2011 National Household Survey (56.9%).

Asian countries accounted for 7 of the top 10 countries of birth of recent immigrants in 2016: the Philippines, India, China, Iran, Pakistan, Syria and South Korea.

Newcomers from the Americas and Oceania represented 12.6% and 0.7%, respectively, of recent immigrants to Canada.

Almost half of the foreign-born population is from Asia

Changes in the main source countries of immigrants have transformed the overall portrait of Canada’s foreign-born population. In 2016, almost half (48.1%) of the foreign-born population was born in Asia (including the Middle East), while a lower proportion (27.7%) was born in Europe.

Furthermore, African-born immigrants represented a growing share of the foreign-born population, increasing from 1.4% in the 1971 Census to 8.5% in the 2016 Census.

In 1871, in the first census held after Confederation, the foreign-born population was mainly from the British Isles (83.6%).

One hundred years later, the 1971 Census showed that individuals born in the British Isles still accounted for the largest group of foreign-born population, but their share had decreased significantly to 29.5%. The majority of the foreign-born population were from other European countries and the United States, while 10.9% of foreign-born were from other parts of the world.

Current immigration trends—if they continue—and the aging of established cohorts of immigrants mean that from 55.7% to 57.9% of all immigrants would be born in Asia by 2036, and from 15.4% to 17.8% would be born in Europe. The proportion of immigrants born in Africa is projected to increase to between 11.0% and 11.9% in 2036.

Figure 4: Distribution of foreign-born population, by region of birth, Canada, 1871 to 2036

More information on recent and past trends with regard to immigration to Canada is available in the video “Welcome to Canada: 150 Years of Immigration” and in the infographic “Immigrant population in Canada“, as well as in various immigration data products.

Two in five Canadian children have an immigrant background

First- and second-generation children of immigrants contribute to the renewal of the population and to the diversity of Canada’s population.

According to the 2016 Census, almost 2.2 million children under the age of 15 were foreign-born (first generation) or had at least one foreign-born parent (second generation), representing 37.5% of all Canadian children. This is an increase from 2011, when this proportion was 34.6%. This population of children with an immigrant background could continue to grow and could represent from 39.3% to 49.1% of children under the age of 15 by 2036.

In 2016, the majority (74.0%) of these first- or second-generation children were from countries of ancestry in Asia, Africa, the Caribbean and Bermuda, Central and South America.

For more information, please see the document entitled “Children with an immigrant background: Bridging cultures” from the Census in Brief series.

The vast majority of immigrants report being able to conduct a conversation in English or French

The language composition of immigrants has changed over the past 100 years. The percentage of immigrants with English or French as a mother tongue decreased from 71.2% in 1921 to 27.5% in 2016, mirroring changes in the source countries of immigrants over the same period. Overall, statistics are presented on about 200 languages for the 2016 Census.

English and French remain the languages of convergence and integration into Canadian society. In 2016, the vast majority of the 7.5 million immigrants (93.2%) were able to conduct a conversation in English or in French. This means that only 6.8% of immigrants reported not being able to conduct a conversation either in English or in French.

More detailed analyses of immigrants and language are available in the document “Linguistic integration of immigrants and official language populations in Canada” in the Census in Brief series.

Over 250 ethnic origins

Past and recent sources of immigration have strongly influenced the current ethnic and cultural make-up of Canada’s population.

Many ethnic origins were reported in the 2016 Census. The list of origins includes different groups associated with Aboriginal peoples. It also includes European groups that first settled in Canada, as well as various groups that subsequently settled in this country. Overall, statistics are available for over 250 ethnic origins.

More detailed analyses are included in the document on “Ethnic and cultural origins of Canadians: Portrait of a rich heritage” from the Census in Brief series.

Growth of the visible minority population

The increase in the number of immigrants from non-European countries, as well as their children and grandchildren born in Canada, has contributed to the growth of the visible minority population in Canada.

In 2016, 7,674,580 individuals were identified as belonging to the visible minority population as defined by the Employment Equity Act. They represented more than one-fifth (22.3%) of Canada’s population. Of this number, 3 in 10 were born in Canada.

The visible minority population has grown steadily since the 1981 Census, when data for the four Employment Equity groups (women, Aboriginal peoples, visible minorities and persons with disabilities) were first derived. At that time, the 1.1 million people belonging to a visible minority represented 4.7% of the total Canadian population.

If current trends continue, the visible minority population would continue to grow and could represent between 31.2% and 35.9% of the Canadian population by 2036.

Figure 5: Number and proportion of visible minority population in Canada, 1981 to 2036

The visible minority population is made up of a number of groups, which themselves are diversified in many respects.

South Asians, Chinese and Blacks were the three largest visible minority groups, each with a population exceeding one million.

According to the 2016 Census, 1,924,635 people reported being South Asian, representing one-quarter (25.1%) of the visible minority population and 5.6% of the entire Canadian population.

Chinese was the second largest visible minority group, with 1,577,060 individuals, representing 20.5% of the visible minority population.

The Black population in Canada surpassed the one-million mark for the first time in 2016. This visible minority group, the third largest in terms of number, comprised 1,198,540 individuals (15.6% of the visible minority population) in 2016, compared with 945,670 in 2011.

The fourth and fifth largest visible minority groups, Filipinos and Arabs, almost doubled their numbers in 10 years and had the highest growth rates among visible minority groups from 2006 to 2016.

They were followed by Latin Americans, Southeast Asians, West Asians, Koreans and Japanese.
Source: The Daily — Immigration and ethnocultural diversity: Key results from the 2016 Census

‘An issue that pulls at the heartstrings’: MPs review rules that reject immigrants on medical grounds

Will be interesting to see where CIMM sees an appropriate balance between compassion and cost:

Members of Parliament begin a review today of rules that reject immigrants because they could be a drain on Canada’s social services and health-care system.

As it stands, applicants can be refused if their condition is a potential danger to public health or safety, or if immigration officers believe they could cause “excessive demand” on the system.

Determinations are based on whether anticipated costs are expected to exceed the average Canadian per-capita health or social services costs over a five-year period, or if they could add to an existing waiting list that might delay care for Canadian citizens or permanent residents.

Liberal MP and immigration committee chair Rob Oliphant said the government has signalled interest in the issue in the wake of high-profile cases, including the one of a York University professor whose application for permanent residency was turned down because his son has Down syndrome.

“If these are mostly economic migrants coming in and making money and paying taxes, is there really a net benefit, or is it a net cost? We don’t know and we want to find out,” he said.

Figures provided to CBC News from Immigration, Refugees and Citizenship Canada show a sharp decline in the number of applications rejected on medical grounds in the last three years. In 2016, 337 applicants were deemed inadmissible, down from 473 in 2015 and 619 in 2014.

Conservative immigration critic Michelle Rempel said the longstanding federal policy has attempted to strike a difficult balance.

“It’s an issue that pulls at the heartstrings, because there are many cases of people who come to Canada with dire medical needs who will be found to be medically inadmissible,” she said. “It brings out the compassionate care of Canadians.”

Rempel wants to hear from witnesses on whether the policy is being applied adequately and consistently, and what the impact of any potential change could be on overall costs and waits for services for Canadians.

Ability to pay not a factor

According to the rules around medical inadmissibility, a willingness or ability to pay is not a factor for services that are publicly funded like physician or hospital care, since there is no cost-recovery regime in place.

However, it is a consideration in assessing an applicant who has financial means to defray costs of medication or services that are not publicly funded, such as HIV antiretroviral therapy.

Ottawa-based immigration lawyer Ronalee Carey called the policy “two-faced” because it allows a discrimination against immigrants that would never be permitted against Canadians with intellectual or physical disabilities.

She said the estimated health costs of these potential immigrants is a small fraction of the total cost of the country’s health-care system, and that the policy ignores other contributions the newcomers could make to society.

More than money

“It’s more than just money and economics,” she said. “It’s a political decision and that’s why we elect officials, but I would really ask them to look at what these people bring to us beyond a health-care problem. What does the entire family bring?”

Identified public health and safety issues range from active pulmonary tuberculosis and untreated syphilis to mental health issues such as pedophilia, sociopathic behaviour disorders or paranoid states or substance abuse that can lead to violent, hostile or disruptive behaviour.

The immigration committee begins its study this morning, hearing from officials in the immigration department. MPs will also hear from legal and economic experts and advocacy groups.

Source: ‘An issue that pulls at the heartstrings’: MPs review rules that reject immigrants on medical grounds – Politics – CBC News

New to Canada, struggling to find work: Integration programs

Role of the community colleges in integration:

It is no coincidence that Canadian colleges go to great lengths to welcome and prepare immigrant students for school and work.

Immigration is key in helping soften the effects on the labour force of the aging population, an important element of long-term economic growth, according to the Conference Board of Canada’s report, A long-term view of Canada’s demographics, released in October, 2016.

Bridging, pre-arrival, and other programs and services are particularly important for immigrant students, who, compared with international students (those in the country on study permits but who also may apply to immigrate to Canada), tend to be older, have more extensive education and work backgrounds, and are also permanent residents, notes Alex Irwin, director of George Brown’s School of Immigrant and Transitional Education (SITE).

Along with the one-year college teachers training program that Ms. Shokry and Mr. Kabir have completed, SITE offers bridging programs in nursing and construction management.

Among other Canadian colleges with prominent immigrant programs and services is Red River College, which has campuses in Winnipeg and other areas of Manitoba, and this year has nearly 1,360 immigrant students who are permanent residents.

“Our goal is to support immigrants to Manitoba with a holistic approach throughout their entire student life cycle, and we have a large suite of programs and services across different departments and areas to work toward this goal,” Nora Sobel, manager of diversity and intercultural services at Red River, said in an e-mail interview.

Red River recruits students from other countries to aid in boosting Manitoba’s skilled labour shortages, the school’s website says. In the spring, for instance, the college launched a pathway program to construction skills, starting with 20 students from countries such as Syria, Sudan and the Democratic Republic of Congo. Also on campus, Red River’s Diversity and Intercultural Services department helps organize the annual welcome party for immigrant and international students, and offers services, including financial aid information sessions.

Many programs don’t just delve into the fine points of the jobs themselves; they also give immigrant students insight into the “cultural norms and social cues in the workplace,” notes Mr. Irwin.

He gives this example: “The Canadian workplace can be seen as more casual, but there are a lot of social clues we take for granted that have to be learned if you’re new to the country, like what to call your boss. Calling someone ‘sir’ may not be appropriate in Canada.”

Prominent among pre-arrival programs is a one-day orientation and information session called Planning for Canada, which is offered free, both online and in person, in countries including India, China and the Philippines.

The federally funded program was launched in October, 2015, and is jointly run by the Canadian Immigrant Integration Program (CIIP, a program of Colleges and Institutes Canada) and Canadian Orientation Abroad (a program of the International Organization for Migration).

Planning for Canada has teamed with dozens of organizations (including the YMCA, the Immigrant Access Fund, and employment, tourism and nursing interests) as well as colleges that help students to plan their journeys to Canada.

Partner colleges include Red River, George Brown, Bow Valley College in Calgary, Vancouver Community College, and Parkland College, with campuses in Saskatchewan.

One goal of Planning for Canada is to “dispel any misunderstanding or misconceptions earlier in the [immigration] process,” says CIIP director Holly Skelton.

She says a bulk of immigrants are chosen to come to Canada based on their high levels of academic achievement, yet one common misunderstanding is that credentials earned in another country will be recognized fully in Canada.

“We’re there to provide a reality check and provide information they need to take action right away, before they come, so they can hit the ground running and don’t waste time,” says Ms. Skelton.

Source: New to Canada, struggling to find work – The Globe and Mail

Opposition accuses Liberals of ‘paralysis’ in crackdown on crooked immigration consultants

Refreshing to see the opposition admitting that its previous approaches failed while pressing the government for action:

Opposition MPs are accusing the Liberal government of failing to protect immigrants from fraudsters and predators as it swings Canada’s door open to more newcomers.

In a formal response to a sweeping study by MPs on the immigration committee tabled four months ago, Immigration Minister Ahmed Hussen said the government is “seized” with issues related to inadequate protection from unprofessional or unethical practitioners, and conceded a strong system of oversight is essential.

But he did not commit to any of the committee’s 21 recommendations, saying only that the government will carry out further study and expects to provide more information on a path forward next year.

“Given the complexity and inter-dependencies of the issues, the impact on public confidence, on clients and authorized immigration and citizenship consultants, the government will carefully consider the committee’s report and undertake a thorough analysis of key recommendations before determining how these issues could be addressed successfully,” his response reads.

A disappointed Conservative immigration critic Michelle Rempel said the response amounts to “typical inertia.”

“There are very substantive proposals on the table on how to manage this, and the government really just needs to make a decision and implement it,” she told CBC News. “The fact they’re not willing to do it suggests a sort of paralysis on their part, and that’s to the detriment of people who are being exploited.”

“We tried self-governance. Clearly, that’s failed,” she said. “I’m willing to say the approach we tried failed, twice, and it’s really now up to the Liberal government to do something, and the status quo is not going to cut it.”

In the spring, the Commons immigration committee carried out weeks of hearings on unregistered representatives often called “ghost” or “crooked” consultants, hearing heart-wrenching stories from clients who were ripped off for thousands of dollars, or brought to Canada with the promise of work only to be dumped at the side of the road or left in a warehouse.

Rempel said it is even more critical that the government crack down on predators in the context of its aggressive immigration strategy.

Source: Opposition accuses Liberals of ‘paralysis’ in crackdown on crooked immigration consultants – Politics – CBC News

White Nationalism Is Destroying the West – The New York Times

Good piece:

When rapid immigration and terrorist attacks occur simultaneously — and the terrorists belong to the same ethnic or religious group as the new immigrants — the combination of fear and xenophobia can be dangerous and destructive. In much of Europe, fear of jihadists (who pose a genuine security threat) and animosity toward refugees (who generally do not) have been conflated in a way that allows far-right populists to seize on Islamic State attacks as a pretext to shut the doors to desperate refugees, many of whom are themselves fleeing the Islamic State, and to engage in blatant discrimination against Muslim fellow citizens.

But this isn’t happening only in European countries. In recent years, anti-immigration rhetoric and nativist policies have become the new normal in liberal democracies from Europe to the United States. Legitimate debates about immigration policy and preventing extremism have been eclipsed by an obsessive focus on Muslims that paints them as an immutable civilizational enemy that is fundamentally incompatible with Western democratic values.

Yet despite the breathless warnings of impending Islamic conquest sounded by alarmist writers and pandering politicians, the risk of Islamization of the West has been greatly exaggerated. Islamists are not on the verge of seizing power in any advanced Western democracy or even winning significant political influence at the polls.

The same cannot be said of white nationalists, who today are on the march from Charlottesville, Va., to Dresden, Germany. As an ideology, white nationalism poses a significantly greater threat to Western democracies; its proponents and sympathizers have proved, historically and recently, that they can win a sizable share of the vote — as they did this year in France, Germany and the Netherlands — and even win power, as they have in the United States.

Far-right leaders are correct that immigration creates problems; what they miss is that they are the primary problem. The greatest threat to liberal democracies does not come from immigrants and refugees but from the backlash against them by those on the inside who are exploiting fear of outsiders to chip away at the values and institutions that make our societies liberal.

Anti-Semitic and xenophobic movements did not disappear from Europe after the liberation of Auschwitz, just as white supremacist groups have lurked beneath the surface of American politics ever since the Emancipation Proclamation. What has changed is that these groups have now been stirred from their slumber by savvy politicians seeking to stoke anger toward immigrants, refugees and racial minorities for their own benefit. Leaders from Donald Trump to France’s Marine Le Pen have validated the worldview of these groups, implicitly or explicitly encouraging them to promote their hateful opinions openly. As a result, ideas that were once marginal have now gone mainstream.

….

“It’s the great replacement,” his friend added, echoing the title of a 2010 book by the French writer Renaud Camus, which paints a dark picture of demographic conquest in the West. “They want to replace us.”

As Mr. Camus explains in the book: “You have a people and then, in an instant, in one generation, you have in its place one or several other peoples.” He finds it scandalous that “a veiled woman speaking our language badly, completely ignorant of our culture” is legally considered as French as “an indigenous Frenchman passionate for Romanesque churches, and the verbal and syntactic subtleties of Montaigne and Rousseau.” In Mr. Camus’s eyes, groups like Pegida are heroic. He praises the group as a “liberation front” that is battling “a colonial conquest in progress” where white Europeans are “the colonized indigenous people.”

Ms. Le Pen, the leader of France’s far-right National Front party, has a similar fear, and she sees birthright citizenship as the vehicle for replacement. Although she doesn’t use the term favored by many Republicans in the United States (“anchor babies”), she insists, as she told me in an interview last May, that “we must stop creating automatic French citizens.”

This argument has a long pedigree. It can be traced back to the Dreyfus Affair, when the virulently anti-Semitic writer Maurice Barrès warned that immigrants wanted to impose their way of life on France and that it would spell the “ruin of our fatherland.” “They are in contradiction to our civilization,” Barrès wrote in 1900. He saw French identity as rooted purely in his bloodline, declaring, “I defend my cemetery.”

Today’s version of the argument is: if you have foreign blood and don’t behave appropriately, then you don’t get a passport.

…

Calais and Charlottesville may be nearly 4,000 miles apart, but the ideas motivating far-right activists in both places are the same. When white nationalists descended on Charlottesville in August, the crowd chanted“Jews will not replace us” and “you will not replace us” before one of its members allegedly killed a woman with his car and others beat a black man; last week, they returned bearing torches and chanting similar slogans.

Just as Mr. Trump has plenty to say about Islamic State attacks but generally has no comment about hate crimes against Indians, blacks and Muslims, the European far-right is quick to denounce any violent act committed by a Muslim but rarely feels compelled to forcefully condemn attacks on mosques or neo-Nazis marching near synagogues on Yom Kippur.

Doing so might alienate their base. Alexander Gauland, a co-leader of the newest party in the German Parliament, is adamant that his Alternative for Germany is “not the parliamentary arm of Pegida,” although he did acknowledge in an interview that “a lot of people who march with Pegida in Dresden are people who could be members, or friends, or voters” for the party. Like Mr. Trump, Mr. Gauland and Ms. Le Pen would never admit to being white nationalists, but they are more than happy to dog-whistle to them and accept their support.

Those who worry that a godless Europe and an immigration-friendly America are no match for Islamic extremists have ignored an even greater threat: white nationalists.

Their ideology is especially dangerous because they present themselves as natives valiantly defending the homeland. Because they look and sound like most of their co-citizens, they garner sympathy from the majority in ways that Islamists never could. White nationalism is in many ways a mirror image of radical Islamism. Both share a nostalgic obsession with a purist form of identity: for one, a medieval Islamic state; for the other, a white nation unpolluted by immigrant blood.

If the influence of white nationalists continues to grow, they will eventually seek to trample the rights of immigrants and minorities and dismiss courts and constitutions as anti-democratic because they don’t reflect the supposed preferences of “the people.” Their rise threatens to transform countries that we once thought of as icons of liberalism into democracies only in name.

Artist Ai Weiwei Talks Refugees and Art | Time.com

Worth reading:

The Chinese artist and activist is taking on migration issues and the rise of nationalism with a documentary and his biggest public art project to date

Your exhibition in New York City is called “Good Fences Make Good Neighbors.” What’s it about?

Before the Berlin Wall collapsed, about 11 nations had border [walls] and fences. Now it’s jumped to 70, so you have seen the tendency to exclude and to defend. New York is a city that is made of immigrants. This is not a normal kind of public art; it uses the city as a ready-made and develops projects through the city’s boroughs, especially the immigrant areas, using bus shelters and subway stops.

Some people support President Trump’s wall because they’re worried about being overwhelmed by people from other countries. What would you say to them?

There’s a lot of talk about the potential danger. It’s saying, “We are better than them. They are the danger. They are the problem.” It’s trying not to recognize humanity as one. It’s against the ideology that we’re all created equal, and it’s a violation of our understanding of human rights and human dignity, and it’s just such a backward movement.

How do you walk the line between making art that connects as art, and art that connects as a political statement?

First, I’m an artist. Absolutely, my art is with me in all my activities. My defense of human rights or freedom of speech is really related to the very essential core of the art practice.

There’s a discussion going on about Confederate statues in the U.S. Do you think they should be removed?

I support the freedom of speech. I think that is what we have to defend, and even though those statues may not be pleasant, they still reflect where we come from. If you see what happens in China, the party constantly changes reality and history to its own favor, which really establishes a totally tyrannical control.

You lived in the U.S. for a little while as an art student in the ’80s. Were you in the country legally?

Nobody ever asked me that question. I came to the U.S. as a student. But I dropped out of school and so I became an illegal alien in New York City for years. Nobody ever checked–not even when I brought a lot of trouble to the police, when we had the [Tompkins Square Park] riots.

Why did you pull back on social media?

I grew up in a society in which no individual voice can be heard, whether you are a President or company leader or poet. So when social media provided me such a possibility, I got absolutely lost in it. I was kind of completely wild, and I spent, like, 24 hours a day [with it]. It was just never enough. After so much argument about those very essential values, I lost my voice. It’s just like a singer lost his voice because I repeatedly talked about those big issues. And then one day I had a chance to develop artworks.

You paid a price for your father’s work as a poet when he was exiled. How do you feel about your son in that context?

I was born while my father was being purged, and I grew up in this exiled condition; he cleaned public toilets in a very remote area. And then for 30 years, he was forbidden to write anything. But he is today the most patriotic poet, loves his nation, his people and the fight for the independence of the nation. At the time I was arrested, my son was only 2½. When I went into detention, the only thing I felt sorry about is I thought I was going to be sentenced to over 10 years. So my son’s condition really made me become much softer. I have to protect his safety, have to send him to Germany to a safe ground and also I have to take this exile path with him.

Source: Artist Ai Weiwei Talks Refugees and Art | Time.com

Why did Vikings have ‘Allah’ embroidered into funeral clothes? – BBC News

Interesting:

Researchers in Sweden have found Arabic characters woven into burial costumes from Viking boat graves. The discovery raises new questions about the influence of Islam in Scandinavia, writes journalist Tharik Hussain.

They were kept in storage for more than 100 years, dismissed as typical examples of Viking Age funeral clothes.

But a new investigation into the garments – found in 9th and 10th Century graves – has thrown up groundbreaking insights into contact between the Viking and Muslim worlds.

Patterns woven with silk and silver thread have been found to spell the words “Allah” and “Ali”.

The breakthrough was made by textile archaeologist Annika Larsson of Uppsala University while re-examining the remnants of burial costumes from male and female boat and chamber graves originally excavated in Birka and Gamla Uppsala in Sweden in the late 19th and mid-20th centuries.

She became interested in the forgotten fragments after realising the material had come from central Asia, Persia and China.

Larsson says the tiny geometric designs – no more than 1.5cm (0.6in) high – resembled nothing she had come across in Scandinavia before.

“I couldn’t quite make sense of them and then I remembered where I had seen similar designs – in Spain, on Moorish textiles.”

Unlocking a puzzle

Larsson then realised she was not looking at Viking patterns at all but ancient Arabic Kufic script.

There were two words that kept recurring. One of them she identified with the help of an Iranian colleague. It was the name “Ali” – the fourth caliph of Islam.

But the word next to Ali was more difficult to decipher.

To unlock the puzzle, she enlarged the letters and examined them from all angles, including from behind.

“I suddenly saw that the word ‘Allah’ [God] had been written in mirrored lettering,” she says.

Larsson has so far found the names on at least 10 of the nearly 100 pieces she is working through, and they always appear together.

The new find now raises fascinating questions about the grave’s occupants.

“The possibility that some of those in the graves were Muslim cannot be completely ruled out,” she says.

“We know from other Viking tomb excavations that DNA analysis has shown some of the people buried in them originated from places like Persia, where Islam was very dominant.

“However, it is more likely these findings show that Viking age burial customs were influenced by Islamic ideas such as eternal life in paradise after death.”

A past exhibit shows what a Viking woman’s boat grave in Gamla Uppsala may have looked like - similar to the tombs the above fragments were found in
Image captionA museum display gives a sense of what the Viking woman’s boat grave in Gamla Uppsala may have looked like – similar to the tombs the fragments were found in

Her team is now working with the university’s department for immunology, genetics and pathology to establish the geographic origins of the bodies dressed in the funeral clothes.

Historic first

Contact between the Viking and Muslim worlds has long been established by historic accounts and the discovery of Islamic coins across the northern hemisphere.

Two years ago, researchers re-examined a silver ring from a female tomb at Birka and found the phrase “for Allah” inscribed on the stone.

Again the text was Kufic, developed in the Iraqi town of Kufah in the 7th Century – one of the first Arabic scripts used to write down the Koran.

What makes Larsson’s discovery so interesting is that it is the first time historic items mentioning Ali have ever been unearthed in Scandinavia.

Source: Why did Vikings have ‘Allah’ embroidered into funeral clothes? – BBC News