Diversity of Heads of Mission 2016
2016/10/14 Leave a comment
With likely all of the heads of mission (HoM) announcements made, combined with knowledge of their classification levels, we now have a more complete picture on the degree to which the government is delivering on its diversity commitments. Overall, they are.
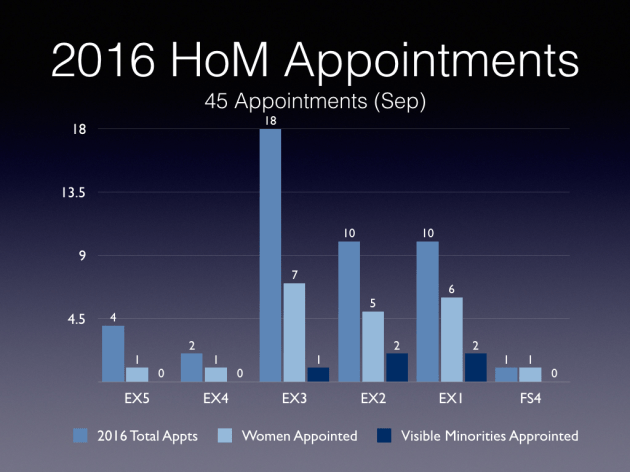
Chart 1
Overall, of the 45 appointments, 21 were women (47 percent, virtual parity) and five were visible minority (11 percent, or under-represented in relation to the 15 percent benchmark of visible minorities who are also citizens).
Chart 1 breaks down the these overall numbers by classification level (note that this reflects the level of the position, not necessarily the head of mission, as some positions are overfilled with former DMs and equivalents, and some are underfilled).
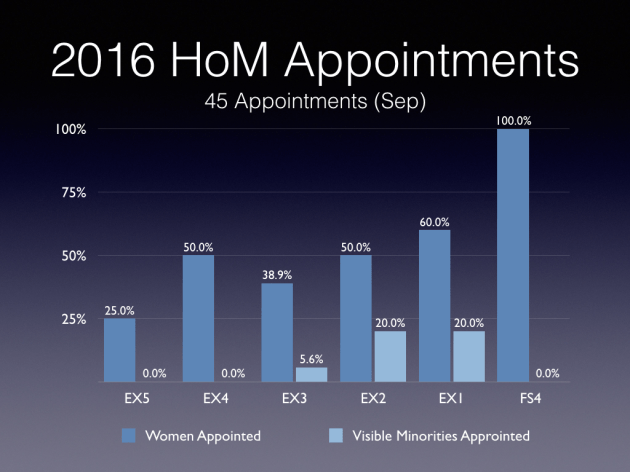
Chart 2
Not surprisingly, there is greater representation of women and visible minorities at more junior levels, particularly apparent between EX4-5 (ADM level) and EX1-3 (DG and Director level), as shown in Chart 2.
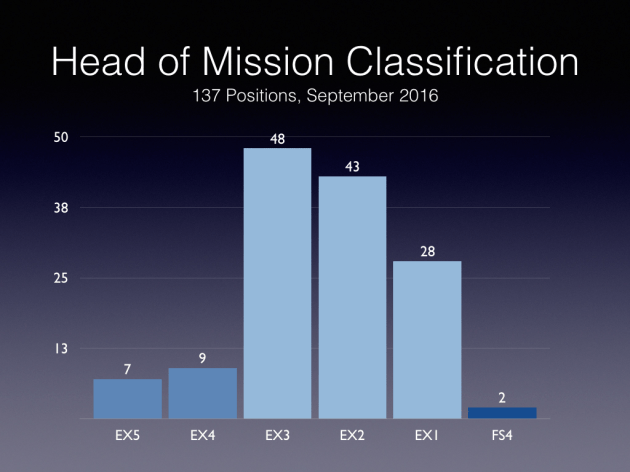
Chart 3
Finally, as a point of reference, Chart 3 shows the classification breakdown of all 137 head of mission positions.
Note: I am grateful to Global Affairs Canada for having provided the classification data. However, as an illustration of the limits of the newer, more open approach, they did not provide this information in spreadsheet form, using the (false) argument that: “Understandably, the GoC cannot send records in a spreadsheet format that could otherwise be manipulated or ‘edited.’ ” (fortunately, I have software that can convert a scanned pdf into spreadsheets or documents).

