Employment Equity in the Public Service of Canada 2013–14
2015/04/10 Leave a comment
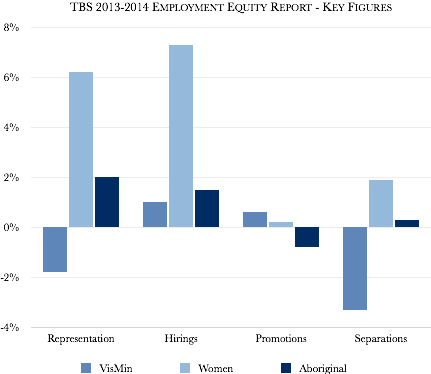
Disappointing that TBS has not updated labour market availability (LMA) from 2006 (unlike Labour Canada for federally-regulated sectors – banking, communications, transport – has (17.8 percent visible minorities). However, while visible minorities remain under-represented, the hirings, promotions and separations data is relatively strong:
As at March 31, 2014, all four employment equity designated groups exceeded their workforce availability, as determined from 2006 Census data. Aboriginal peoples continued to increase their representation, from 5.0 per cent to 5.1 per cent; members of a visible minority group increased their representation from 12.6 per cent to 13.2 per cent; the representation of persons with disabilities decreased marginally from 5.8 per cent to 5.7 per cent; and women’s representation decreased slightly from 54.2 per cent to 54.1 per cent.
Within the executive cadre, representation rates continued to exceed workforce availability for three of the four designated groups. Women increased their representation from 46.0 per cent to 46.1 per cent; persons with disabilities increased their representation from 5.3 per cent to 5.4 per cent; and members of a visible minority group increased their representation from 8.2 per cent to 8.5 per cent. The representation of Aboriginal peoples remained stable at 3.7 per cent, below their workforce availability for executives.
For those interested, this table shows the overall trend over the past 5 years:
|
2009-10 |
2010-11 |
2011-12 |
2012-13 |
2013-14 |
|
| Representation |
10.7% |
11.3% |
12.1% |
12.6% |
13.2% |
| Hirings |
11.3% |
9.8% |
10.7% |
14.7% |
16.0% |
| Promotions |
12.1% |
12.5% |
13.5% |
13.5% |
13.8% |
|
Separations |
6.4% |
7.1% |
7.7% |
8.9% |
9.9% |
Despite most of these years being under restraint and cutbacks, it is encouraging that representation, hirings and promotions continue to increase (separations may reflect cutbacks).
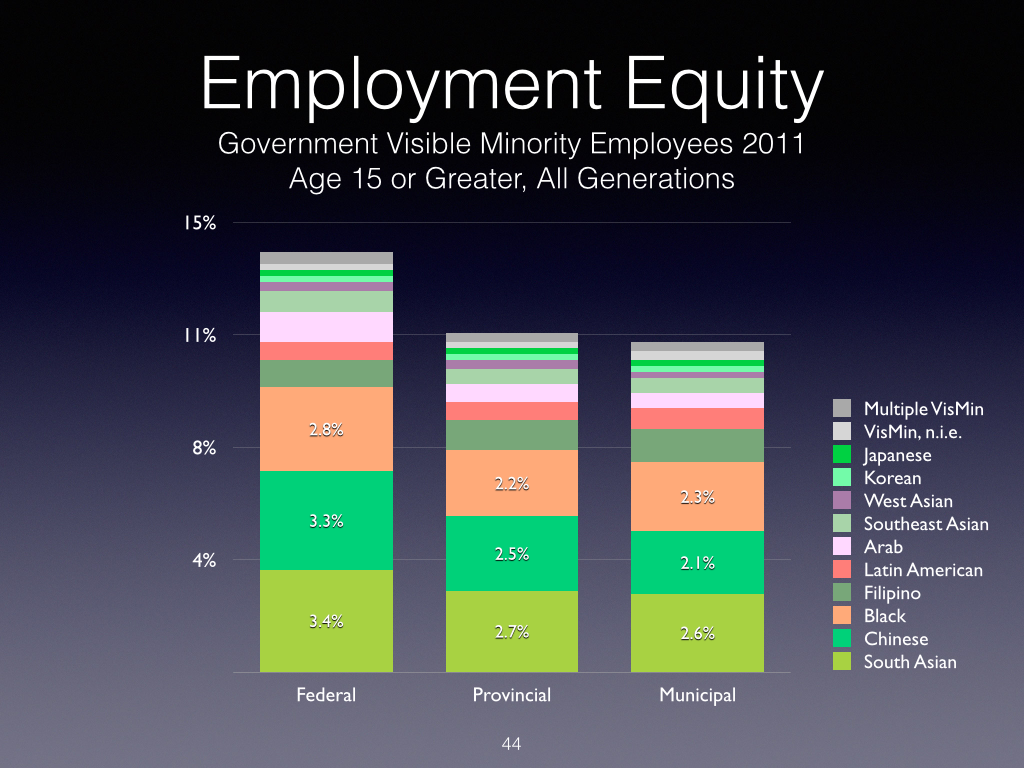
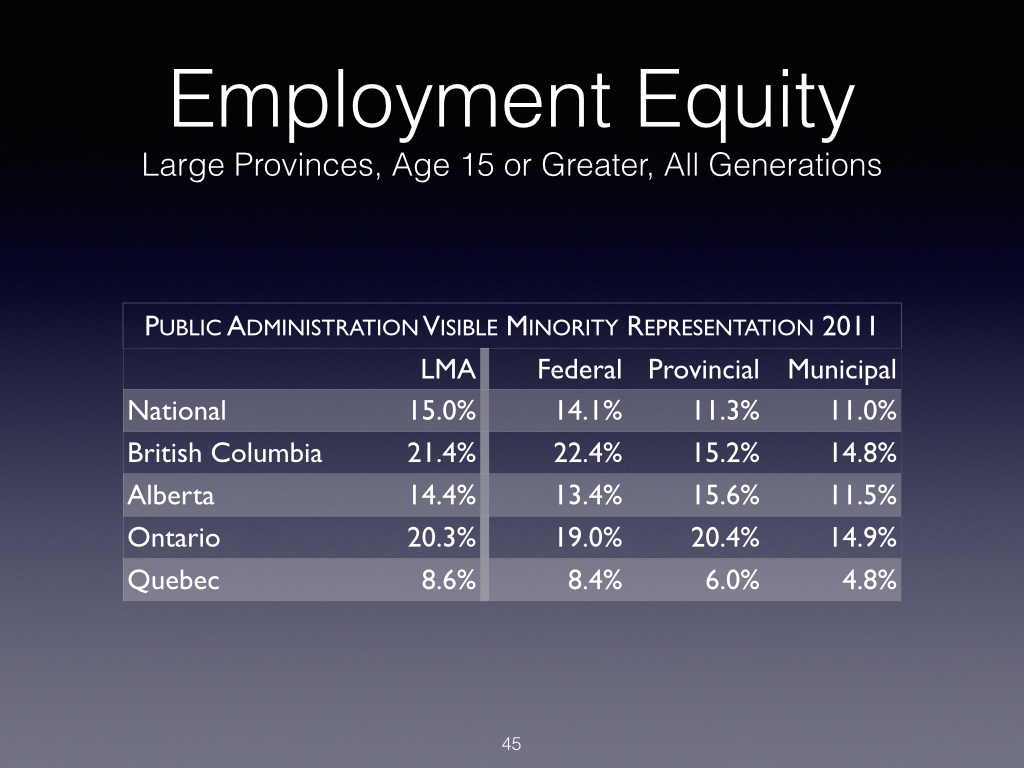
While TBS has not yet issued a revised LMA, a rough calculation would suggest the LMA has increased from 12.4 in 2006 to 15.0 percent in 2011.
This is based on the percentage of the population which is visible minority (19.1 percent) and adjusting for the percentage that are also Canadian citizens (78.3 percent).
Another view of public service employment equity can be derived from the National Household Statistics on public sector employment, which covers all federal public institutions (less the Canadian Forces), not just the Schedule 1 departments covered in the TBS reports: