Transition from temporary foreign workers to permanent residents

Former Minister Alexander’s asserted before CIMM during its study of C-24 that:

…it’s very important to distinguish between the two different broad categories of status that non-Canadian citizens can have here. One is temporary resident status and the other is permanent resident status. We are saying that the time that will count toward citizenship is permanent resident status. We don’t want those lines to be blurred. (28 April 2014)

This latest Statistics Canada belies that dichotomy, as do IRCC’s Open Data data sets (my chart below based upon this series – Transition from Temporary Resident to Permanent Resident Status.

There were 310,000 temporary work permit holders on December 31, 2015, accounting for 1.7% of the national employed workforce. The number of TFWs has more than quadrupled since 2000 (Immigration, Refugees and Citizenship Canada 2017).

Over the 2000s, immigration to Canada was increasingly drawn from TFWs. For instance, the proportion of newly landed adult immigrant men already holding a job in Canada rose from 16.3% in 1999 to 28.9% in 2010. Most of this increase consisted of immigrants who had high-paying jobs in Canada before attaining permanent resident status.

About 9% of TFWs who came to Canada between 1995 and 1999 became permanent residents within five years of receiving their first work permit. This was the case for 13% of those who came to Canada between 2000 and 2004, and for 21% of those who came between 2005 and 2009.

Most transitions from TFW status to permanent resident status occurred within the five years following receipt of the first work permit. The rate rises another 1 to 3 percentage points by the 10th year, with little increase observed thereafter.
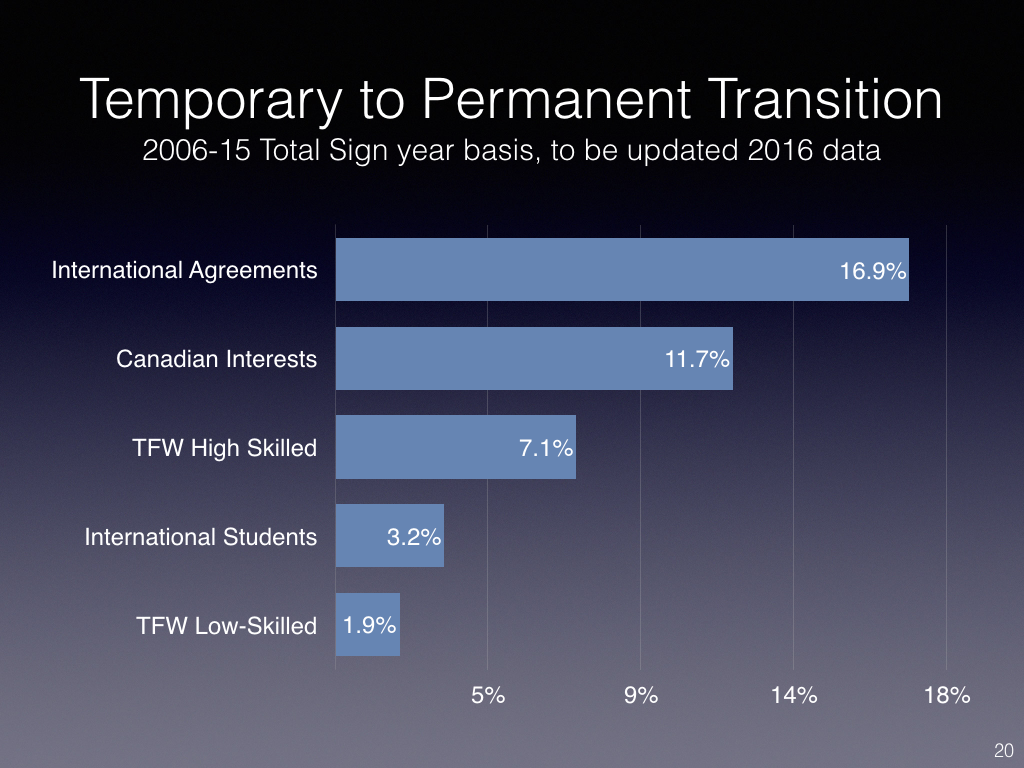
Transition rates

The rate of transition to permanent residence varied by type of work permit. Among those who came to Canada between 2005 and 2009, the five-year transition rate was highest among those in the Live-in Caregiver Program (LICP), at 56%, and the Spouse or Common-law Partner category, at 50%. The lowest rates for transition to permanent residence were among those in the Seasonal Agricultural Workers Program (SAWP), at 2%, and the Reciprocal Employment category, at 9%.

A large difference in the transition rate by type of work permit is a result of government policy. For example, while all those in the LICP are allowed to apply for permanent residence after two years of full-time work as domestic workers, SAWP workers have no dedicated stream for transition, and may only be employed for a maximum of eight months per year. Their SAWP permits, however, can be renewed over many years.

Source: Transition from temporary foreign workers to permanent residents

Intergenerational Income Transmission: New Evidence from Canada

Interesting study. No breakdown by immigrants/non-immigrants or visible minority/non-visible minority:

Comparative studies of intergenerational earnings and income mobility largely rank Canada as one of the most mobile countries among advanced economies, such as Denmark, Finland and Norway. The assertion that Canada is a highly mobile society is drawn from intergenerational income elasticity estimates reported in Corak and Heisz (1999). Corak and Heisz used data from the earlier version of the Intergenerational Income Database (IID), which tracked the income of Canadian youth only into their early thirties. Recent theoretical literature, however, suggests that the relationship between childrens’ and parents’ lifetime income may not be accurately estimated when children’s income is not observed from their mid-careers—known as lifecycle bias.

The present study addresses this concern by re-examining the extent of intergenerational earnings and income mobility in Canada using the updated version of the IID, which tracks children well into their mid-forties, when mid-career income is observed. This information is essential for intergenerational analysis, as the literature shows that bias arising from lifecycle variation can be greatly mitigated by comparing fathers’ and offspring’s earnings near their mid-careers. Moreover, this paper also examines whether intergenerational mobility differs across the population. With nearly 250,000 observations, the study can differentiate the degree of intergenerational transmission across the full spectrum of the income distribution.

The empirical analysis in this study is based on Statistics Canada’s IID, which was constructed from various tax records to link together children and their parents. The IID consists of youth aged 16 to 19 in 1982 whose tax records are linked to the tax records of their parents by means of the parents’ and the children’s Social Insurance Numbers and information from Statistics Canada’s T1 Family File. The data provide more than 20 years of income history for both parents (1978 to 1999) and children (1986 to 2008) that allows for comparison of the income of children and parents when they were at the main stage of the lifecycle.

The results from the analysis suggest that Canada is still a mobile society, but not to the same extent as previously thought. The new estimate of the father–son earnings elasticity is about 0.32, which is noticeably higher than the values previously reported in the literature (which have been in the neighbourhood of 0.2): lifecycle bias alone explains about two-thirds of the discrepancy between the early estimates and the new result. The extent of intergenerational persistence tends to be greater when market income (i.e., the sum of earnings, self-employment income and asset income) is measured. This suggests that other mechanisms, such as transmission of jobs or entrepreneurial skills, may also be at work. Interestingly, the analysis also shows that the father–daughter elasticity is much less sensitive to these biases. Moreover, the paper documents a clear pattern of nonlinearity in the intergenerational transmission of earnings and income in Canada. In particular, the path to the top of the distribution appears to be quite challenging for sons born to low-income fathers. On the other hand, these same sons appear to have significant chances of moving into the middle class. Social institutions may help explain the latter findings. Finally, this paper demonstrates that the patterns of nonlinearity can be significantly misread when the lifecycle bias is not adequately addressed, especially over the upper part of the distribution.

Source: Intergenerational Income Transmission: New Evidence from Canada

Census needs to reflect modern reality about gender | Toronto Star

I am sure StatsCan is already thinking about this in the context of the 2021 Census and the best means to do so (may just be an “other” category:

After 10 years, the long-form Canadian census is back. Young Canadians, primed by a decade of digital media saturation, flocked online in droves so large we took down the website.

It makes sense — and it’s not just false enthusiasm as we collectively do our duty because “it’s the law.” A generation used to sharing its descriptive statistics online (finding friends, networking, dating) would intuitively understand the benefit of the census. Understanding the sociodemographic landscape helps us know and better service ourselves. And after all, that’s what millennials want: a fairer and more representative social democracy.

Yet, as Canadians fill out the census, some gawk at the glaring anachronism of the gender binary, the idea that there are two mutually exclusive genders: males and females, who occupy distinct cultural, social, and sexual roles.

But we know this isn’t true. The recent media awakening to transgender people (Laverne Cox, Caitlyn Jenner, Jazz Jennings) is evidence that gender variance has gone mainstream.

If we recognize men and women who identify with the genders they were assigned at birth (cisgender) and we recognize men and women who do not identify with their assigned gender (transgender), then surely we agree this difference is worth recording.

As my friend quipped, “Well, they’re not asking about gender. They’re asking about sex!” His point reflects the growing awareness about gender as the patterns of behaviour and expression associated with its respective sex categories. This is good. It shows a recognition of people whose self-concepts do not match the gender assigned them at birth.

…Despite a variety of new ways to capture gender variation in the population, this simple two-step approach takes us miles further than the two-option approach of the 2016 Census:

  1. Do you identify with the gender you were assigned at birth? Yes / No / Not sure / Prefer not to say
  2. Please indicate your current gender: Male, Female, Non-Binary, Intersex, Other (please describe):

As the 2016 census has done with its categories for race, we must open up how we assess gender. I know it seems hard, but let’s no longer pretend we cannot do better.

Source: Census needs to reflect modern reality about gender | Toronto Star

StatsCan — Reasons for not voting in the federal election, October 19, 2015

Voter Turnout 2015-2011 Elections.001Good overview. Overall striking that turnout rates for longer-term foreign-born citizens are virtually identical to the Canadian-born, and that the gap between more recent citizens shrunk between elections, perhaps reflecting opposition to a number of the citizenship and immigration changes made by the previous government.

Extract from the StatsCan report below:

By immigrant status, the largest increase was among immigrant Canadians with citizenship who had been in Canada for 10 years or less, as their turnout rate went up from 56% to 70%. The turnout rate for immigrant Canadians with citizenship who had been in Canada for more than 10 years increased from 71% to 76%. Among Canadian-born citizens, the rate also increased, up from 70% to 78%.

Source: The Daily — Reasons for not voting in the federal election, October 19, 2015

2016 census drops income and benefits over faulty data given data to come from CRA

Good change and use of existing and more accurate data:

When Canadians receive their census questionnaires this May, they’ll no longer be asked to report their income and benefits — something Statistics Canada says produced subpar data.

“To substantially reduce the burden on Canadians, and improve the quality of income data compared to previous censuses, Statistics Canada will use income and benefits data from the Canada Revenue Agency for all census respondents to replace questions previously asked on the 2011 National Household Survey questionnaire,” a recently-published order-in-council explained.

Aside from the return of the mandatory component of the long-form census, which Minister of Innovation, Science and Economic Development Navdeep Bains announced the day after being sworn in last November, the 2016 Census of Population will essentially mirror the 2011 National Household Survey.

“There are no new questions on the short or long form. To ensure comparability over time, with the exception of two changes, questions asked by the Census of Population will remain the same as they were in 2011,” a Statistics Canada agency spokesperson told iPolitics.

“First, the question on religion will not be included as the census program has asked this question only every 10 years since 1871. Second, in order to reduce the time required and make it easier for Canadians to respond, income questions will be replaced with more precise tax and benefit data that have been available to Statistics Canada since 1985.”

The latter change is welcomed by Philip Cross, formerly the chief economic analyst at the agency.

When asked about it, Cross referred to a paper he wrote with Munir Sheikh — the head of Statistics Canada who resigned in the wake of the Harper government’s decision end the long-form census in 2010.

That paper, published by the University of Calgary school of public policy last March, attempted to assess the extent of the middle class plight dominating the Canadian political discourse.

And one problem it highlighted was the “disquieting” difference between what people reported as income when surveyed, as in the census, and the tax data reported by the Canada Revenue Agency.

In a nutshell, Canadians were underestimating their income.

“One reason households routinely underestimate their income in surveys is they respond as if only wages and salaries are income, ignoring the growing importance of supplementary benefits such as employer contributions to pensions or health care that are included in taxable benefits,” Cross and Sheikh wrote.

Supplementary income, they added, had risen to over 13 per cent of all labour income.

“Most of these benefits accrue to middle-income earners, something that should be taken account of when examining how their real income has fared in survey data. As well, surveys exclude irregular sources of income, such as bonuses or stock options,” they wrote.

“Income tax data are less timely but more complete.”

Will miss the religion question but it has always been on a 10-year cycle.

You needn’t talk money anymore