Anxious about immigration? Here’s some food for thought – Geddes

Another good piece by John Geddes, with this excellent summary of the data and evidence from the latest OECD immigrant indicators report.

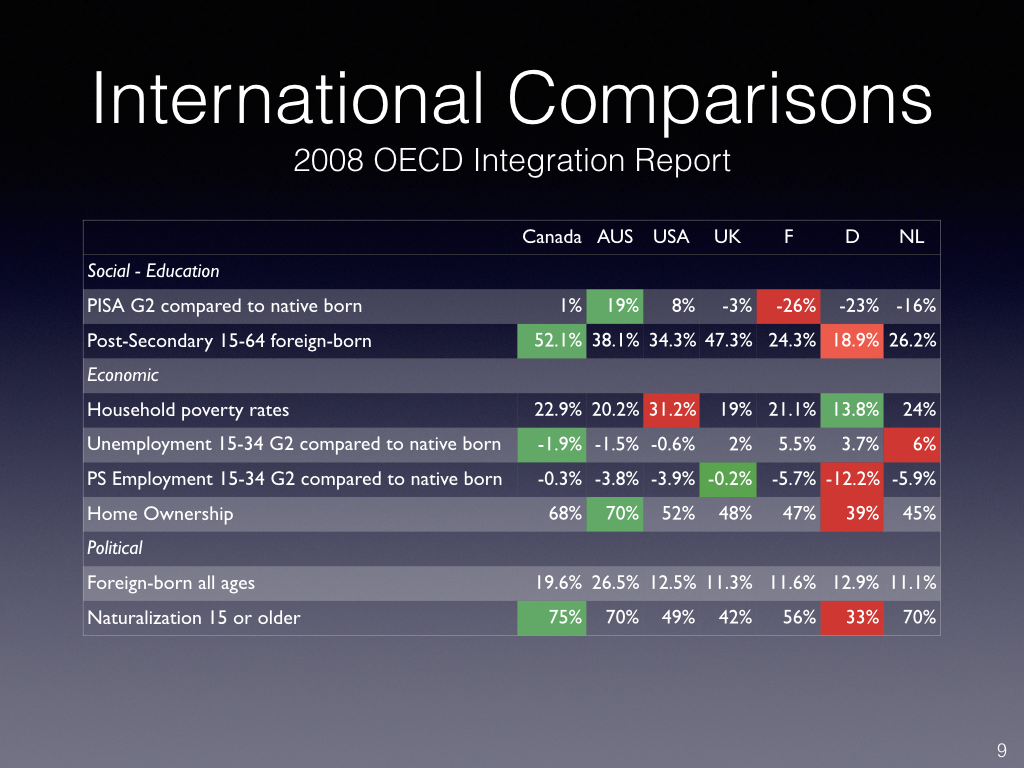
I am a great fan of these reports (used it for the above summary table in Multiculturalism in Canada: Evidence and Anecdote) and am using it to prepare for an upcoming seminar in Copenhagen.

I generally find these data based comparisons more informative than the policy comparison indexes like MIPEX or the Multiculturalism Policy Index although both, of course, are helpful to understanding and discussion.

As with previous and other studies, the sharp contrast between immigration-based countries, particularly Canada, Australia, New Zealand and to a lesser extent, the USA, is striking:

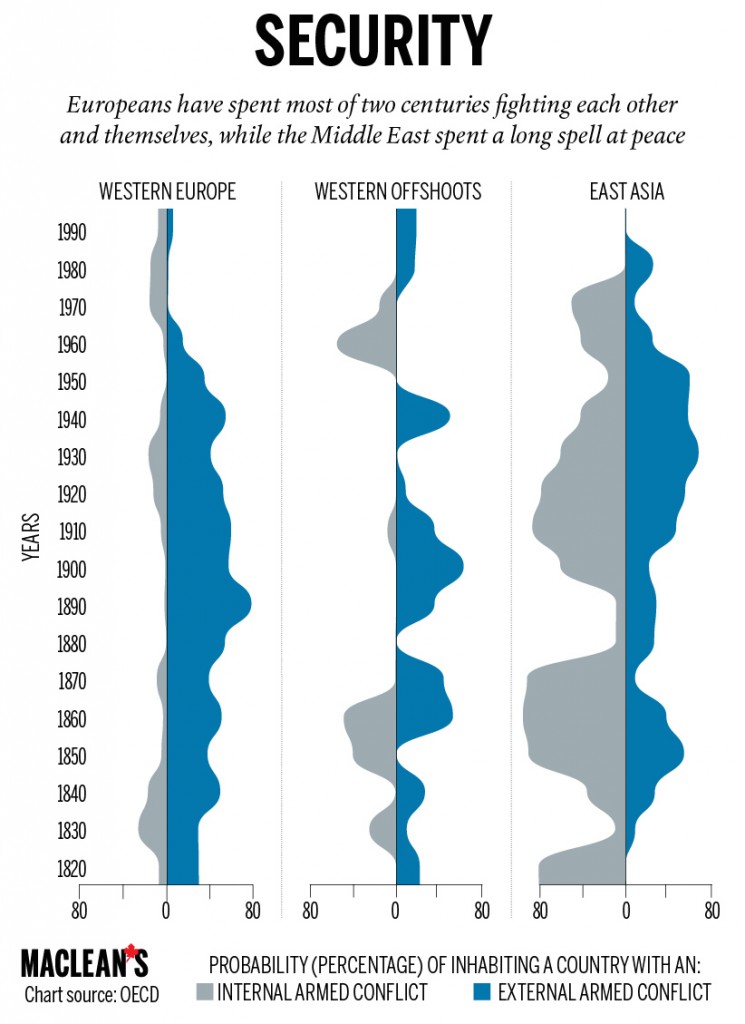
All those images of border-crossing migrants, and swaggering tough talk about what to do about them from some federal Conservative leadership aspirants, have prompted a lot of discussion about how Canada absorbs newcomers, and if we do it differently, maybe better, than other countries.

My colleague Scott Gilmore warned here that we should brace for anti-immigrant populism to rise in Canada, as it has in other countries after the immigrant portion of their populations reached a certain level. I reported here on research that suggests that where immigrants tend to live in Canada, and how they vote, makes the path to political power steeper for right-leaning populists in this country than in the U.S. and Europe.

No matter how you see the issue, understanding how immigrants fare in Canada suddenly seems essential—if the debate is going to be about more than hunches. If you’re really gripped by the subject, you might want to take a look at “Indicators of Immigrant Integration 2015: Settling In,” by the Organization for Economic Cooperation and Development.” Here’s some of what jumped out at me from that study of the OECD’s 35 member countries [I have only listed the titles, the article has charts and narrative – well worth reviewing]:

  1. The Big Picture

  2. Recent Change and Stability

  3. Points of Origin Vary

  4. A Gender Gap

  5. Credentialed Newcomers

  6. Second-Generation Acceleration

  7. But Catching Up Isn’t Easy

  8. … And Some Will Stall

Source: Anxious about immigration? Here’s some food for thought – Macleans.ca

Where immigrants go to school is more important than where they came from | The Economist

More on the OECD PISA results focussing on immigrant children:

IF YOU think starting a new school is scary stuff—try doing it in a new country. Migrants can face a twin disadvantage. They are often concentrated in struggling schools. And, at least at first, they may suffer from having to toggle between languages at home and in class. Two-thirds of pupils born outside their host country use another tongue at home. Nearly one in two second-generation immigrants does so.

It is little wonder that many migrants struggle on the latest Programme for International Student Assessment (PISA) tests. The children of foreign-born parents are on average about a year behind their peers, even after accounting for parental income.

This finding hides a lot of variation (see chart). In Australia and Canada pupils whose parents were born abroad do better on science tests than similar teenagers with native-born parents.

Meanwhile immigrants in European countries are often far behind. In Germany first-generation and second-generation migrants are respectively about 2.5 and 1.5 years behind teenagers with German-born parents, even after accounting for their different economic backgrounds. There are similar results in Finland, a country often lauded for its record of equality in education.

For sure, migrants’ origins matter a lot. Second-generation East Asian pupils in Australia are roughly 2.5 years ahead of those with native-born parents. They do even better than pupils in Singapore, the highest-performing country in PISA, even as results in Australia as a whole have fallen.

Yet the country in which the immigrant attends school is more important than the one he comes from, says the OECD’s Andreas Schleicher. Turkish-born pupils in Germany are nearly two years behind in science tests compared with those in the Netherlands, after adjusting for different economic backgrounds.

Policy makes a difference. Attending nursery or extra language tuition helps migrants catch up. Limiting selection by academic ability gives them more time to make up ground. Not making them repeat a year has the same effect.

Admissions policies matter, too. Avoiding high concentrations of migrants in particular schools would help their academic achievement. It would probably also help poorer native children.

The task of educating migrants better is urgent, especially in Europe. The share of children of foreign-born parents in the OECD that took PISA increased from 9.4% in 2006 to 12.5% in 2015. It could rise further in light of the numbers of migrants settling in Europe in 2015 and 2016.

A survey last year by the OECD found that about 80% of second-generation immigrants feel at home at school. But outliers should cause concern. In France, for example, just 40% of second-generation immigrants say they feel as if they belong in school. That is a figure to make everyone in the country sit up straight.

Source: Where immigrants go to school is more important than where they came from | The Economist

Canadian students are excelling: Don’t get complacent (OECD PISA)

Good overall assessment of the latest OECD PISA results and Canadian students and schools by Bonnie Schmidt and Andrew Parkin:

Canadians can be proud of our showing in the 2015 Programme for International Student Assessment report, released Tuesday. We are one of only a handful of countries that places in the top tier in the Organization for Economic Co-operation and Development in each of the three subjects tested: science, reading and math.

Canadian students not only exceeded the international average in science performance – they were among the best in the world in this subject. This is a positive result, given the diversity of our education systems and of our student population. Canada was also near the very top in reading, and remained in the top 10 in math. The OECD even singled Canada out for our ability to combine high achievement with a commitment to equity in education.

There is no gender gap in science performance in Canada, nor is there a gap between immigrant students and those born in Canada. Parents should welcome these findings.

Not only do Canadian students perform well in science, but they are also more likely than the OECD average to expect to have STEM careers (in science, technology, engineering and math) – 34 per cent of Canadian students have this expectation, compared with an international average of 25 per cent. This is good news for Canada and a testament to the many organizations across the country that help schools connect the dots between classroom science learning and the world of work.

But significant gender differences remain in terms of the specific types of STEM careers that boys and girls expect to have, with girls much more likely to expect careers in health sciences (29 per cent versus 10 per cent) and boys much more likely to expect careers in engineering (18 per cent versus 7 per cent) and information and communications technology (3.7 per cent in the ICT field versus 0.3 per cent).

While the PISA results do warrant celebration, we can’t become complacent. Challenges continue, not the least of which is figuring out how to continue evolving learning opportunities for Canadian youth so they can participate as citizens and in the labour market in a rapidly changing world.

And even though Canada stands out for its record in equity, some students still struggle to get the necessary attention. For example, PISA makes no reference to indigenous students. In addition, girls continue to significantly outperform boys in reading (though the gap narrows with digital reading) and, in some (but not all) provinces, boys outperform girls in math. Minority language classrooms (i.e. French learners outside Quebec and English learners in Quebec) also continue to lag behind.

Source: Canadian students are excelling: Don’t get complacent – The Globe and Mail

Immigrant students fare best heading quickly into classroom, OECD study shows

No surprise. Canada has always done well, both absolutely and in relation to other OECD countries, in immigrant education outcomes:

A sweeping new study of immigrant students around the world shows they do best in countries that bring them into regular classrooms as quickly as possible, where teachers feel comfortable working with children of different backgrounds and where extra help is offered to immigrant families — all hallmarks of GTA schools.

The 124-page report by the Organization for Economic Co-operation and Development (OECD), to be released Thursday, looks at how immigrant students in some 30 countries, including Canada, performed on a standardized test in the “3 Rs” in 2012, and concludes their success depends largely on how the host country helps them integrate in school.

“Immigrant students perform better and report feeling more accepted in some countries than others, which suggests education policy has an impact on integration,” said the report, “Immigrant Students at School: Easing the Journey towards Integration.”

It suggests the countries that best help immigrant students succeed move them into regular classrooms while giving them a crash course in their new language, rather than segregate them until they have mastered the language, as happens in some countries.

In Ontario, schools must place newcomers in a regular classroom for at least part of each day, noted Paula Markus, the Toronto District School Board’s co-ordinator of English as a Second Language (ESL).

“We don’t want to segregate children, even from the first days, because while we’re giving them English language support we know it’s important for them to get to know English-speaking peers and make friends and that helps their adjustment,” she said.

Nor should teachers in the diverse GTA be intimidated by the wave of refugees Canada is expecting, she said, “because we have the most amazing, diverse classrooms in the world here. “As Justin Trudeau said, this is 2015.”

Source: Immigrant students fare best heading quickly into classroom, study shows | Toronto Star

Richer, smarter, taller: A measure of Canada from the OECD

OECD-11-745x1024 - ConflictsInteresting long-term study by the OECD on the last 200 years. Not quite as captivating as the Rosling videos (200-years-that-changed-the-world-bbc), but some of the graphics are clever and well-done:

In 1820, the OECD says, Canada’s GDP per capita stood at $904—behind Western European nations, but not bad for a colonial backwater that was governed from an ocean away. That mark doubled to $1,816 by 1880, doubled again by 1920, and surpassed the colonial powers by mid-century. Meanwhile, Canadians always stood taller than even the richest nations. We averaged heights of more than 170 cm in 1820, a mark the OECD attributes to the “abundant food supply” afforded to settlers in our corner of the New World. That’s 11 cm taller than the average Mexican. The Swedes and Dutch have since surpassed Canada, but we’re still taller, on average, than Americans and every non-European country. We’ve also steadily grown older. Fifty-eight years might seem like a short life now, but in the 1920s that average Canadian life expectancy was among the world’s longest. These days, our 80-year average is only slightly behind the Japanese at 82.

It’s not all good news for Canadians. We’re among the highest per-capita emissions belchers in the world, trailing only the United States and Australia. No one else comes close. Most European countries are reducing their emissions per capita, and Russia’s world-leading numbers plummeted after the Soviet Union’s collapse.

The OECD report also tells magnificent and tragic stories about the rest of the world. It charts a massive global spike in education levels. It explains how much longer human beings live now than just a few decades ago, even if war- and disease-ravaged African nations are the glaring exception. It maps the spread of women’s suffrage, a basic political right almost unheard of in 1913 but now the global rule—except in Saudi Arabia. As the world fights for a better lot in life, the OECD makes one thing clear: the average Canadian has always had more money in their pocket, a better view in a crowd, and more schooling than most of humanity.

Richer, smarter, taller: A measure of Canada from the OECD.

Canada facing more competition in drawing immigrants, says OECD study

Interesting study by the OECD on the essentially neutrality of immigration overall, even though it may be significant in particular sectors with skills shortages.

So both the claims of its benefits are likely exaggerated, as are the claims of its costs (i.e., Herbert Grubel: The invisible price tag of immigration):

“Even though most migration is not directly driven by workforce needs, immigrants are playing a significant role in the most dynamic sectors of the economy,” the study states.

“The impact of the cumulative waves of migration that arrived over the past 50 years in OECD countries is on average close to zero, rarely exceeding 0.5% of GDP in either positive or negative terms,” it says.

An examination of the fiscal impact of immigration on Canada, the U.S., Europe and Australia over the past 50 years suggests “is, on average, zero.”

New arrivals to OECD nations are “neither a burden to the public purse, nor are they a panacea for addressing fiscal challenges. In most countries, except in those with a large share of older migrants, migrants contribute more in taxes and social contributions than they receive in individual benefits.

Gives both perspectives reason for further reflection and analysis, as well as where does citizenship policy figure in immigration competitiveness.

Canada facing more competition in drawing immigrants, says OECD study.