Really interesting and nuanced study with regional breakdowns:
In August 2022, the Centers for Disease Control and Prevention reportedthat over the last two years, Black Americans’ life expectancy declined to about 71 years old, six years lower than their white counterparts. National disparities in life expectancy can represent the permanency of racism, offering little reason for hope.
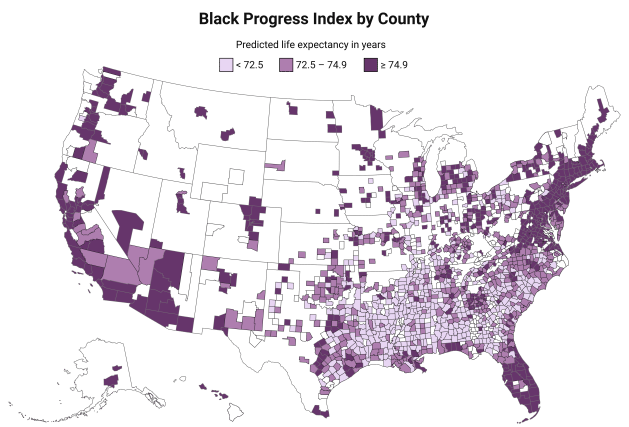
But in Manassas Park, Va. and Weld County, Colo., the mean-life expectancy for Black residents is 96—a national high among all Black citizens by county. Black people are living in their 80s in larger Democratic jurisdictions like Montgomery County, Maryland and smaller Republican districts like Collier County, Florida.
[time-brightcove not-tgx=”true”]
My colleague Jonathan Rothwell and I reported hundreds of places that exceed commonly held expectations in Brookings’s recently released Black Progress Index, an interactive tool and report developed in partnership with the NAACP that provides a means to understand the health and well-being of Black people and the conditions that shape their lives. Instead of comparing Black people to white people, we examine life expectancy differences among the Black population in different places. This method reveals the locales where Black people are thriving.
Courtesy of the Brookings Institution.
Researchers often sloppily compare rates of home ownership, educational attainment, income and mortality without attending to past and present discrimination that intended to create disparities. Consequently, broad national averages void of context policy and local contexts camouflage the very real progress that’s occurring across the country.
Still, in places like Jefferson County, Ohio, the average Black person lives 33 fewer years than Manassas Park, Va. and Weld County, Colo. That gap is roughly equivalent to 100 years of progress in living standards, medical science, and public health.
Black people are not a monolith. They have widely different outcomes in very different places. Local contexts matter as Black people do. Lower life expectancy in counties and metro areas across the country suggests that people are losing battles against racism. But geographic areas where Black people are thriving offer more than hope: People’s civic actions are delivering positive change.
What accounts for such vast differences? Life expectancy, a cumulative measure of health and well-being, summarizes both the biological and non-biological influences on our lives. Because race is a sociological construct and not a biological one, we should assume disparities in life expectancy represent differences in non-biological influences on our lives. Our current life expectancy data suggest that people are breaking down specific social conditions that influence longevity, giving real reason for optimism.
Using a common machine-learning algorithm to select variables and rank their importance, the Index identifies 13 social conditions that predict Black life expectancy. Many are those one might expect, such as income, education, housing, and family composition. Others were more surprising, including the top predictor of high Black life expectancy: larger shares of foreign-born Black residents. One standard deviation above the mean in this variable adds one year to predicted life Black expectancy. For instance, Brooklyn, N.Y. is in the 89th percentile of life expectancy at 78.5. The more than 43% of Black residents of King’s County who are immigrants, places it in the 98th percentile among all counties.
The cause for this interpretation is unclear; it may be a pure composition effect, in that foreign-born Black Americans enjoy better health than the native Black population. Though, this data points to a larger question: Is less exposure to U.S. racism good for your health?
On the other end of the spectrum, a surprising predictor of low Black life expectancy is religious membership. Keeping in mind all the social determinants that showed to be significant in our study are correlational, not causal. Revoking a church membership will not automatically add years to a person’s life. The challenge is understanding why religious adherence is associated with lower life expectancy. Church goers are more likely to be obese and, on the surface, asking “Jesus to take the wheel” may negate any agency we have in influencing our health outcome. We also know that place-based bias that comes out of the wash of housing devaluation hurts the families and institutions, including churches, in those locales. More research is needed to uncover the conditions and behaviors underlying all the variables that strongly influence life expectancy.
The fact that we realize progress and stagnation in Black life expectancy in different places makes clear that people have agency. The gains and losses reflect that. When we take an overly optimistic or pessimistic view of the state of Black America and treat Black people as a monolith, we don’t see localized stories of growth, determination, and thriving.
The diversity of places where Black people are thriving suggests that it has something to do with Black people themselves. In places like Montgomery County, Md., individuals, civil rights groups, organizers, and politicians are dismantling the architecture of inequality that takes away years of life.
That said, we still need to examine and throw away the overly optimistic position on race relations—that the country has moved beyond slavery, Jim Crow racism, and the array of discriminatory policies and their long-term effects. People who hold this perspective contend that America is a level playing field and that with effort, Black people can achieve anything a white person can.
But locales that post life expectancies under 70 perform poorly on environment or institutional indicators like the air and school quality, suggesting that life is harder in some places due to systemically racist forces. In Lowndes County, Ala. where Montgomery is the county seat, Black life expectancy is 68.5. In Greenwood, Miss., it’s 67.3. In Salem, Ore., life expectancy is 64.4.
It’s also worth speculating on seemingly obvious reason why some cities, like Jackson, Miss., don’t post higher rates than 72.6. Jackson has higher homeownership rates than most places (94th percentile) and a higher percentage business ownership (59th percentile). But the recent water crises show how local politics of Mississippi play out in lower investments in the city’s water infrastructure, which plays out in other municipal services that impact life expectancy like education.
“Social reforms move slowly,” wrote W.E.B. Du Bois, suggesting that we must learn from our circumstances in ways that reject intemperance and blame. “[W]hen Right is reinforced by calm but persistent Progress we somehow all feel that in the end it must triumph.”
Society is toiling with the same struggles around racism that Du Bois faced at the turn of the 20th century. Nonetheless, we must take the time to recognize empirical signs of progress and not rush toward unsophisticated, untruthful narratives of hopelessness or blind ignorance that remove or dismiss our agency. A path of progress demands that we have a clear view of the social, political, and economic landscape in which we live. Recognizing progress and defeats will have us see the very real capacity for future change. The assumption—backed with data—that Black people in places with higher life expectancy had a hand in their outcomes should inspire us to seek change in places where discrimination is robbing people of years of life
Interesting study for both first and second generation immigrants, and the factors influencing shorter lifespans of non-immigrants:
If immigrants to the United States formed their own country, their pre-COVID-19 life expectancies would exceed or match those of the world’s leaders in longevity -; Swiss men and Japanese women. A new study by USC and Princeton researchers estimates that immigration adds 1.4 to 1.5 years to U.S. life expectancy at birth. In 2017, foreign-born life expectancy reached 81.4 and 85.7 years for men and women, respectively. That’s about 7 and 6.2 years longer than the average lifespan of their U.S.-born counterparts.
Demographers knew that immigrants lived longer. The main question that we set out to answer was, How much is this really contributing to national life expectancy trends? Our results show that they’re making an outsized contribution to national life expectancy.”
Arun Hendi, the lead author of the study and assistant professor of sociology and public affairs at Princeton University
The study was published in the September 2021 issue of SSM Population Health, by Hendi and Jessica Ho, an assistant professor of gerontology and sociology at the USC Leonard Davis School of Gerontology. Their work provides new insights on how immigrants contributed to national life expectancy trends over nearly three decades, from 1990 to 2017.
The research suggests that immigrants are responsible for approximately half of the recent U.S. gains in life expectancy. Moreover, the gap in life expectancy between foreign-born and native-born residents is widening.
In fact, the researchers say, Americans’ life expectancy would steeply decline if it weren’t for immigrants and their children. Under that scenario, U.S. life expectancy in 2017 would have reverted to levels last seen in 2003 -; 74.4 years for men and 79.5 years for women -; more closely resembling the average lifespans of Tunisia and Ecuador.
Study shows diverging trends during the last decade
Prior research has shown that between 2010 and 2017, overall U.S. life expectancies saw an unprecedented stagnation. The plateau has been largely attributed to drug overdose deaths among adults in their prime working ages and slowdowns in the rate of improvement in cardiovascular disease mortality. But this new study shows that immigrants experienced life expectancy gains during this period, while the U.S.-born population experienced declines.
“If it weren’t for immigrants, our national life expectancy stagnation that we experienced since 2010 would instead be a national decline in life expectancy,” Ho said. “For them to have that large an impact is unexpected because they represent a relatively small proportion of the U.S. population.”
In addition, while the immigrant advantage was already present in 1990, the research shows that the difference between immigrants and the U.S.-born has widened substantially over time, with the ratio of American-born to foreign-born mortality rates nearly doubling by 2017.
“When compared to immigrants’ life expectancy, the U.S.-born are doing poorly. Much of this is related to their very high mortality at the prime adult ages,” said Ho, an expert in the social determinants of health and mortality. “Low mortality among prime-aged immigrants doesn’t just help the foreign-born -; it helps the U.S.-born too. Prime-aged adults are likely to be in the labor force and raising children. This means that they contribute to higher tax revenues and slower population aging.”
Hendi says this is particularly relevant today because those prime adult ages are where the country is losing years of life due to drug overdose mortality and other preventable causes of death.
“The fact that immigrants are doing well suggests that there is a capacity to thrive in the U.S., but the U.S.-born aren’t fulfilling that potential,” he said.
Immigrants are a small but influential share of the U.S. population
Immigrants make up under 15% of the U.S. population, up from around 8% in 1990 but still a small percentage of the total. Hendi and Ho cite healthy behaviors and the changing selectivity of the immigrant population as factors that may contribute to their influence on total life expectancy.
“Immigrants tend to be healthier in part due to the selective migration of those who have the health, resources and stamina to migrate to the U.S., and this selectivity may have grown stronger,” Ho said.
The researchers highlight the role of increases in high-skilled immigration, which is partly reflected in changes in countries of origin as immigrant streams shift from Mexico to places like India and China. They also note that there may be pro-longevity characteristics of immigrant populations, regardless of country of origin, including a lower propensity to drink, smoke and use drugs than U.S.-born residents.
“Many of America’s immigrants come from lower-income, less-developed nations, leading some to worry that these immigrants bring their home countries’ high-mortality conditions with them and thus drag down America’s national average longevity,” Hendi said. “But the results say just the opposite. Far from dragging down the national average, immigrants are bolstering American life expectancy. A big part of the story appears to be that immigrants take fewer risks when it comes to their health.”
The study additionally found that the children of foreign-born residents retain some life expectancy advantage but do not fare as well as their parents.
Hendi and Ho used data from the National Vital Statistics System and the U.S. Census Bureau to estimate life expectancy levels among foreign-born, U.S.-born and total populations between 1990 and 2017.
The team plans to examine COVID-19’s impact on immigrant life expectancies. A January 2021 study by USC and Princeton researchers found the COVID-19 pandemic had significantly affected life expectancy, with stark declines in life expectancy among Black and Latino populations. A separate USC study last July of a large diverse group of Medicaid enrollees found Latino patients had starkly higher odds than whites of testing positive for COVID-19 as well as higher odds of hospitalization and death.
Telling. Haven’t seen any comparative Canadian data but likely a similar but smaller effect:
The average U.S. life expectancy dropped by a year in the first half of 2020, according to a new report from the National Center for Health Statistics, a part of the Centers for Disease Control and Prevention.
Life expectancy at birth for the total U.S. population was 77.8 years – a decline of 1 year from 78.8 in 2019. For males, the life expectancy at birth was 75.1 – a decline of 1.2 years from 2019. For females, life expectancy declined to 80.5 years, a 0.9 year decrease from 2019.
Deaths from COVID-19 are the main factor in the overall drop in U.S. life expectancy between January and June 2020, the CDC says. But it’s not the only one: a surge in drug overdose deaths are a part of the decline, too.
“If you’ll recall, in recent pre-pandemic years there were slight drops in life expectancy due in part to the rise in overdose deaths,” explains NCHC spokesperson Jeff Lancashire in an email to NPR. “So they are likely contributing here as well but we don’t know to what degree. COVID-19 is responsible for an estimated 2/3 of all excess deaths in 2020, and excess deaths are driving the decline.”
The group that suffered the largest decline was non-Hispanic Black males, whose life expectancy dropped by 3 years. Hispanic males also saw a large decrease in life expectancy, with a decline of 2.4 years. Non-Hispanic Black females saw a life expectancy decline of 2.3 years, and Hispanic females faced a decline of 1.1 years.
Throughout the coronavirus pandemic, Black and Latino Americans have died from COVID-19 at disproportionately high rates.
The life expectancy decline was less pronounced among non-Hispanic whites: males in that group had a decline of life expectancy of 0.8 year, while for white females the decline was 0.7 year.
Women tend to live longer than men, and in the first half of 2020, that margin grew: the difference in their life expectancy widened to 5.4 years, from 5.1 in 2019.
The report estimated life expectancy in the U.S. based on provisional death counts for January to June 2020. Because the NCHS wanted to assess the effects of 2020’s increase in deaths, for the first time it published its life expectancy tables based on provisional death certificate data, rather than final counts.
Its authors point out a few limitations in these estimates. One is that the data is from the first six months of 2020 – so it does not reflect the entirety of the COVID-19 pandemic. There is also seasonality in death patterns, with more deaths generally happening in winter than summer. This half-year data does not account for that.
Another limitation is that the COVID-19 pandemic struck different parts of the U.S. at different times in the year. The areas most affected in the first half of 2020 are more urban and have different demographics than the areas hit hard by the virus later in the year.
As a result, the authors write, “life expectancy at birth for the first half of 2020 may be underestimated since the populations more severely affected, Hispanic and non-Hispanic black populations, are more likely to live in urban areas.”
The report parallels the findings published last month by researchers at the University of Southern California and Princeton University, which found that the deaths caused by COVID-19 have reduced overall life expectancy by 1.13 years.
In the U.S., more than 488,000 people have died from COVID-19. The latest estimates from the University of Washington’s Institute of Health Metrics and Evaluation predict 614,503 U.S. deaths by June 1.