 Interesting but not surprising: Maslov’s hierarchy of needs means economic outcomes prevail:
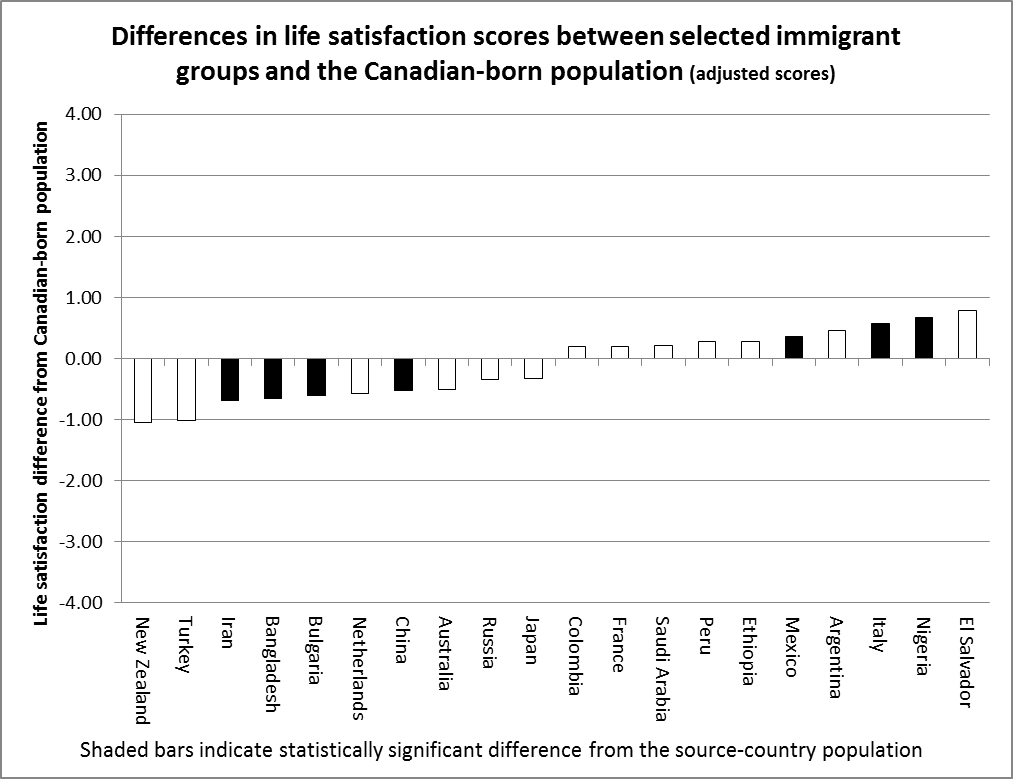
Interestingly, economic differences far outweighed the influence of civil liberties (freedom of expression, assembly, association, education and religion) in determining the final happiness score.
“The regression results indicate that when we control for both source-country GDP and civil liberty, only the effect of source-country GDP is statistically significant. This indicates that immigrants who come to Canada from nations with lower GDP per capita [poorer nations] generally have larger improvements in their life satisfaction compared to their source-country population.
“In a separate model, we also found that about one-quarter of the variation in life satisfaction across source countries was accounted for by GDP per capita. These results again indicate that immigrants from countries with lower levels of GDP experience greater improvements in their life satisfaction,” Frank said in exclusive comments. For example, for India, the difference in “life satisfaction” between the resident population and immigrants in Canada went down from 2.04 to 1.73 points when the difference in GDP was taken into account.
Further, the researchers were able to show that the ‘happiness gaps’ remain even though immigrants may not be representative of the general population in the countries they come from, given that they tend to be drawn from the middle and upper classes. The survey data in Canada covered those immigrants who continue to stay in Canada: only the relatively successful persevere in Canada.
A separate Statscan study released in 2006 reported the phenomenon of “out migration.” It found that as many as 35 per cent of male immigrants (mainly principal applicants) who have been in Canada for under 20 years return to their home countries, with the bulk of them returning in the first year after arrival. This return to their homelands is most acute in times of economic recession, when the researchers found the exit rate could reach as much as 50 per cent, as in the early 1990s.
Are Immigrants Happy? It Depends … – New Canadian Media – NCM.


