#COVID-19: Comparing provinces with other countries 1 September Update

The latest charts, compiled 1 Septe mberas overall rates in Canada increase slightly due to the variant. Canadians fully vaccinated 67.6 percent, higher than USA 53 percent and the UK 64 percent), although all three countries appear to be reaching a wall with respect to vaccination.

Vaccinations: China second after Atlantic Canada, Quebec ahead of Canadian North, France ahead of Prairies, and Germany ahead of Sweden. Chinese fully vaccinated, 63.3 percent, if numbers are accurate.

Trendline charts

Infections: Same ongoing trend: More pronounced uptick in G7 less Canada (driven largely by USA). While all provinces showing increased infections, greater upticks in Alberta, British Columbia.

Deaths: No significant change.

Vaccinations: Ongoing steady gap between Alberta and Prairies with lower vaccination rates than elsewhere in Canada. More rapid increase of immigration sources countries driven by China and to a lesser extent, India.

Weekly

Infections: No relative change except UK slightly ahead of France.

Deaths per million: No significant change.

#COVID-19: Comparing provinces with other countries 25 August Update

The latest charts, compiled 25 July as overall rates in Canada remain relatively stable but with slight increases due to the variant. Canadians fully vaccinated now 66.4 percent, higher than USA 52.2 percent and the UK 62.8 percent).

Vaccinations: China ahead of Canada and only slightly behind in fully vaccinated, 55.6 percent, if numbers are accurate.

Trendline charts

Infections: Same ongoing trend: More pronounced uptick in G7 less Canada (driven largely by USA). While all provinces showing increased infections, greater upticks in Alberta, British Columbia.

Deaths: No significant change.

Vaccinations: Ongoing steady gap between Alberta and Prairies with lower vaccination rates than elsewhere in Canada, with more pronounced flattening.

Weekly

Infections: No relative change.

Deaths per million: No significant change.

#COVID-19: Comparing provinces with other countries 18 August Update

The latest charts, compiled 18 July as overall rates in Canada remain relatively stable but with slight increases due to the variant. Canadians fully vaccinated now 64.8 percent, higher than USA 51.5 percent and the UK 61.1 percent).

Vaccinations: All Canadian provinces ahead of USA and EU countries, China ahead of UK, Alberta and Prairies.

Trendline charts

Infections: Same trends as last week: More pronounced uptick in G7 less Canada (driven largely by USA). While all provinces showing increased infections, greater upticks in Alberta, British Columbia.

Deaths: No significant change.

Vaccinations: Ongoing steady gap between Canadian provinces and G7, immigration source country increase continues to be driven by China (fully vaccinated 55.6 percent, very steep rise since last week) and India (fully vaccinated 9 percent). Flattening of Canadian vaccination rates as reported elsewhere.

Weekly

Infections: No relative change.

Deaths per million: No significant change.

#COVID-19: Comparing provinces with other countries 11 August Update

The latest charts, compiled 11 July as overall rates in Canada remain relatively stable but with slight increases due to the variant. Canadians fully vaccinated now 62.7 percent, higher than USA 50.8 percent and the UK 59.4 percent).

Vaccinations: All Canadian provinces ahead of USA and EU countries, UK and China now ahead of Alberta and Prairies.

Trendline charts

Infections: More pronounced uptick in G7 less Canada (driven largely by USA). While all provinces showing increased infections, greater upticks in Alberta, British Columbia.

Deaths: No significant change.

Vaccinations: Ongoing steady gap between Canadian provinces and G7, immigration source country increase continues to be driven by China (fully vaccinated still at 16 percent) and India (fully vaccinated 8.5 percent). Flattening of Canadian vaccination rates as reported elsewhere.

Weekly

Infections: No relative change.

Deaths per million: No significant change.

#COVID-19: Comparing provinces with other countries 4 August Update, China’s Delta variant

The latest charts, compiled 4 July as overall rates in Canada remain relatively stable but with slight increases due to the variant. Canadians fully vaccinated now 59.8 percent, higher than USA 50.3 percent and the UK 57.2 percent).

Vaccinations: All Canadian provinces ahead of USA and EU countries, all but Prairies ahead of UK.

Trendline charts

Infections: No significant change but slight uptick in G7 less Canada more apparent given increased infections in UK and USA. The outbreak of the Delta variant in China and consequent lockdowns is covered in the article following the charts.

Deaths: No significant change.

Vaccinations: Ongoing steady gap between Canadian provinces and G7, immigration source country increase continues to be driven by China (fully vaccinated 16 percent) and India (fully vaccinated 7.6 percent).

Weekly

Infections: No relative change.

Deaths per million: No significant change.

China now grappling with the Delta variant with Wuhan under lockdown:

China’s spiraling Delta variant outbreak has reached Wuhan, the original epicenter of the pandemic, prompting citywide coronavirus testing as authorities scramble to contain the city’s first reported local infections in more than a year.China is grappling with its worst outbreak in months, with more than 300 cases detected in more than two dozen cities across the country. The country now has 144 medium- and high-risk areas, the most since the initial outbreak in early 2020, the National Health Commission said Wednesday.The speed and scale of the spread has spurred mass domestic travel restrictions, with all inter-city coach, taxi and online car hailing services suspended in medium- and high-risk areas. Chinese immigration authorities have also vowed to “strictly restrict non-urgent, unnecessary cross-border travel,” including tightening the issuing of passports for Chinese citizens.

On Monday, seven infections were reported among migrant workers in Wuhan, the central Chinese city where the coronavirus was first detected in December 2019. As of Wednesday, a total of 20 local infections have been reported, including 8 asymptomatic cases, according to the Hubei provincial health commission.

The city of 11 million people was placed under the world’s first and arguably strictest coronavirus lockdown in January 2020, during the height of its devastating initial outbreak. The paralyzing 76-day lockdown came at a huge personal cost to residents, but eventually succeeded in taming the virus. Wuhan had not reported any locally transmitted cases since May last year.

Despite the initial mishandling, the Chinese government has heralded Wuhan as a success story in its fight against the pandemic. In August 2020, as much of the world grappled with Covid-19, Wuhan made international headlines when it held an electronic music festival in an open air water park, with thousands of people partying without any masks or social distancing measures in sight. 

Some fear the return of a stringent lockdown. Videos and photos shared on social media Monday show empty shelves and long lines at supermarkets, as residents rushed to stock up daily supplies.”Seeing Wuhan people panic buying at supermarkets makes me feel sad. Only those who have experienced it understand how terrible it is, (we) dread a return to the days of staying at home and not knowing where the next meal is,” said a Wuhan resident on Chinese microblogging site Weibo.During Wuhan’s initial lockdown, millions of residents were ordered to stay in their homes, relying on officials and volunteers for daily necessities — often at a higher price.As of Wednesday, no citywide lockdown has been announced for Wuhan, although residential compounds linked to detected cases have been placed under targeted lockdowns.

Spiraling outbreak

The ongoing outbreak first started in Nanjing, Jiangsu province in eastern China, where nine airport cleaners were found to be infected on July 20 during a routine test. Chinese authorities have linked the cluster to a flight from Russia, which arrived at the Nanjing Lukou International Airport on July 10. 

“It is believed that the cleaners did not strictly follow anti-epidemic guidelines after cleaning Flight CA910 and contracted the virus as a result. The infection further spread to other colleagues, who are also responsible for cleaning and transporting garbage on both international and domestic flights,” reported state news agency Xinhua.

Since then, the cluster has spread to at least 26 cities, including the tourist hot spot Zhangjiajie and the capital Beijing. In just two weeks, China has reported more than 480 locally transmitted confirmed cases, according to a CNN tally of the National Health Commission’s daily reports. Not all infections have so far been directly linked to the cluster in Nanjing.

On Monday, 63 local infections, including 50 asymptomatic cases, were reported in Zhengzhou, the provincial capital of Henan province which was ravaged by deadly floods last month. Most cases are linked to an outbreak at a hospital, where janitors, medical staff and patients are among those infected. The city launched citywide testing Sunday.

The fast spreading Delta variant has posed a major challenge to China’s hardline zero Covid strategy, which relies on mass testing, targeted lockdowns, extensive contact tracing and strict quarantine measures to quickly suppress local flare-ups.

China responded by doubling down on its containment approach, adopting stringent measures on a scale not seen in months. Several cities have been placed under effective lockdowns, ordering residents to stay in their homes and canceling flights and trains. The country has also imposed massive nationwide travel restrictions. All provincial authorities have urged citizens not to travel to medium and high-risk areas or leave the provinces where they live unless it is strictly necessary. 

The Chinese government is particularly concerned about the spread of the virus to Beijing, which is set to hold the Winter Olympics in February next year. The city has reported a handful of cases since last week — its first coronavirus resurgence in months. 

Beijing authorities have banned people from medium- or high-risk areas from entering, suspending flights, trains and buses from Covid-hit places. Since Tuesday, 23 railway stations have halted ticket sales for train rides heading to the capital, Xinhua reported.

Chinese authorities are also tightening restrictions on cross-border travel. China is still largely closed off from the outside world, and those who are allowed to enter are subject to lengthy hotel quarantine. At a press conference Wednesday, an official with the National Immigration Administration said authorities would stop issuing travel documents, such as passports, for Chinese citizens who want to leave China for “non-urgent, unnecessary” reasons. Individuals who need to travel overseas for study, work or business purposes would still be issued travel documents upon approval, he added. 

Mahjong parlors

China reported 71 locally transmitted confirmed cases On Wednesday, with nearly half of them coming from Jiangsu province, according to the National Health Commission. The city of Yangzhou, neighboring Nanjing, has become the latest hotspot, reporting 32 local infections.Authorities have blamed the outbreak in Yangzhou on a 70-year-old Nanjing resident, who traveled to Yangzhou on July 21 despite her residence in Nanjing had been placed under a lockdown, according to a statement from the Yangzhou police.The elderly woman, who stayed in Yangzhou with her sister, did not inform local officials of her travel history as required, and repeatedly visited crowded places including restaurants, markets and mahjong parlors, the statement said.The woman sought treatment at a hospital on July 27 after she started coughing and developed a fever, and tested positive for coronavirus a day later. She has been criminally detained by police and is under investigation for suspected obstruction of the prevention and control of infectious diseases, according to the statement.

Mahjong parlors, popular with older people, have played a central role in the spread of Covid in Yangzhou, according to authorities. On Wednesday, Jiangsu officials said at a press conferencethat 64% of Yangzhou’s 94 confirmed cases as of Tuesday were linked to Mahjong parlors, and 68% of confirmed cases are above 60 years old. Both Yangzhou and Nanjing have conducted several rounds of citywide testing, and suspended all domestic flights, long-distance buses, taxis and online car hailing services from arriving and departing.

Source: https://www.google.com/url?sa=t&rct=j&q=&esrc=s&source=web&cd=&cad=rja&uact=8&ved=2ahUKEwia6cWm95fyAhVNMlkFHVudBGgQFnoECAkQAw&url=https%3A%2F%2Fwww.cnn.com%2F2021%2F08%2F04%2Fchina%2Fchina-delta-outbreaks-intl-hnk%2Findex.html&usg=AOvVaw3PoVYncfFvnc5YrT6b2bw5

#COVID-19: Comparing provinces with other countries 21 July Update, India unreported cases

The latest charts, compiled 21 July as overall rates in Canada continue to decline along with increased vaccinations (Canadians fully vaccinated 51.7 percent, higher than USA 49.2 percent and and just behind UK 54.2 percent).

Vaccinations: All Canadian provinces ahead of USA and EU countries.

Trendline charts

Infections: No significant change but slight uptick in G7 less Canada given increased infections in UK and USA.

Deaths: No significant change.

Vaccinations: Captured above, with steady gap between Canadian provinces and G7.

Weekly

Infections: No relative change.

Deaths per million: No significant change.

Interesting and relevant analysis of India’s under-counting of COVID-19 cases:

India’s excess deaths during the pandemic could be a staggering 10 times the official COVID-19 toll, likely making it modern India’s worst human tragedy, according to the most comprehensive research yet on the ravages of the virus in the south Asian country.

Most experts believe India’s official toll of more than 414,000 dead is a vast undercount, but the government has dismissed those concerns as exaggerated and misleading.

The report released Tuesday estimated excess deaths — the gap between those recorded and those that would have been expected — to be between 3 million to 4.7 million between January 2020 and June 2021. It said an accurate figure may “prove elusive” but the true death toll “is likely to be an order of magnitude greater than the official count.”

The report, published by Arvind Subramanian, the Indian government’s former chief economic adviser, and two other researchers at the Center for Global Development and Harvard University, said the count could have missed deaths occurring in overwhelmed hospitals or while health care was delayed or disrupted, especially during the devastating peak surge earlier this year.

“True deaths are likely to be in the several millions not hundreds of thousands, making this arguably India’s worst human tragedy since Partition and independence,” the report said.

The Partition of the British-ruled Indian subcontinent into independent India and Pakistan in 1947 led to the killing of up to 1 million people as gangs of Hindus and Muslims slaughtered each other.

The report on India’s virus toll used three calculation methods: data from the civil registration system that records births and deaths across seven states, blood tests showing the prevalence of the virus in India alongside global COVID-19 fatality rates, and an economic survey of nearly 900,000 people done thrice a year.

Researchers cautioned that each method had weaknesses, such as the economic survey omitting the causes of death. 

Instead, researchers looked at deaths from all causes and compared that data to mortality in previous years — a method widely considered an accurate metric. 

Researchers also cautioned that virus prevalence and COVID-19 deaths in the seven states they studied may not translate to all of India, since the virus could have spread worse in urban versus rural states and since health care quality varies greatly around India. 

And while other nations are believed to have undercounted deaths in the pandemic, India is believed to have a greater gap due to it having the world’s second highest population of 1.4 billion and its situation is complicated because not all deaths were recorded even before the pandemic. 

Dr. Jacob John, who studies viruses at the Christian Medical College at Vellore in southern India, reviewed the report for The Associated Press and said it underscores the devastating impact COVID-19 had on the country’s under-prepared health system. 

“This analysis reiterates the observations of other fearless investigative journalists that have highlighted the massive undercounting of deaths,” Jacob said.

The report also estimated that nearly 2 million Indians died during the first surge in infections last year and said not “grasping the scale of the tragedy in real time” may have “bred collective complacency that led to the horrors” of the surge earlier this year.

Over the last few months, some Indian states have increased their COVID-19 death toll after finding thousands of previously unreported cases, raising concerns that many more fatalities were not officially recorded.

Several Indian journalists have also published higher numbers from some states using government data. Scientists say this new information is helping them better understand how COVID-19 spread in India.

Murad Banaji, who studies mathematics at Middlesex University and has been looking at India’s COVID-19 mortality figures, said the recent data has confirmed some of the suspicions about undercounting. Banaji said the new data also shows the virus wasn’t restricted to urban centers, as contemporary reports had indicated, but that India’s villages were also badly impacted.

“A question we should ask is if some of those deaths were avoidable,” he said.

Source: https://apnews.com/article/business-science-health-india-pandemics-334c326d86efa73a0631bf7cb6e3f92e?utm_source=Sailthru&utm_medium=email&utm_campaign=MorningWire_July20&utm_term=Morning%20Wire%20Subscribers

#COVID-19: Comparing provinces with other countries 14 July Update

The latest charts, compiled 14 July as overall rates in Canada continue to decline along with increased vaccinations (Canadians fully vaccinated 45.6 percent, higher than EU countries, just slightly behind USA 48.6 percent and UK 52.4 percent).

Vaccinations: All Canadian provinces ahead of USA and EU countries.

Trendline charts

Infections: No significant change

Deaths: No significant change.

Vaccinations: Captured above, with increasing gap between Canadian provinces and G7.

Weekly

Infections: No relative change.

Deaths per million: No significant change.

#COVID-19: Comparing provinces with other countries 6 July Update, Economist Normality Index

The latest charts, compiled 6 July as overall rates in Canada continue to decline along with increased vaccinations (still largely first dose, Canadians fully vaccinated 36.6 percent, comparable to or higher than most EU countries). Steep upward trend as per Globe chart below suggests gap between USA and UK fully-vaccinated will continue to narrow.

Vaccinations: All Canadian provinces ahead of USA, China now ahead of Germany and other EU countries.

Trendline charts

Infections: No significant change

Deaths: No significant change.

Vaccinations: Captured above.

Weekly

Infections: No relative change.

Deaths per million: No significant change.

Interesting integration of various data sources to develop a normality index (Canada is 63.4, slightly below the number for all countries, ranking 35, just ahead of UK):

Since the onset of the coronavirus pandemic in early 2020 many have wondered when the world will return to “normal”. But whether things will ever go back to the way they were is unclear: remote working looks set to continue, for example, and going to the movies may never be as popular as it used to be. 

The Economist has devised a “normalcy index” to track how behaviour has changed, and continues to change, because of the pandemic. Our index comprises eight indicators, split into three domains. The first grouping is transport and travel: public transport in big cities; the amount of traffic congestion in those same cities; and the number of international and domestic flights. The second looks at recreation and entertainment: how much time is spent outside the home; cinema box-office revenues (a proxy measure for cinema attendance); and attendance at professional sports events. The third is retailing and work: footfall in shops; and occupancy of offices (measured by workplace footfall in big cities). 

Our index covers 50 of the world’s largest economies that together account for 90% of global GDP and 76% of the world’s population. Our aggregate measure is the population-weighted average of each country’s score. The pre-pandemic level of activity is set at 100 for ease of comparison. The tracker is updated with new data once a week. 

Overall activity

The global normalcy index plummeted in March 2020 as many countries imposed draconian restrictions on their citizens. It fell to just 35 in April 2020, before improving gradually over the following months. Today it stands at 66, suggesting that the world has travelled roughly half of the way back to pre-pandemic life. Some indicators, such as traffic congestion and time spent outside, have recovered faster than others, particularly sports attendance and flights. The global average masks a lot of variation across countries. Click on the drop-down box to explore how behaviour has changed in each one.

Source:

#COVID-19: Comparing provinces with other countries 30 June Update, Canadian excess deaths

The latest charts, compiled 30 June as overall rates in Canada continue to decline along with increased vaccinations (still largely first dose, fully vaccinated 30 percent, comparable to most EU countries).

Vaccinations: Ontario ahead of USA, all provinces ahead of EU countries, China ahead of Italy in total vaccinations but lower than EU countries in terms of fully vaccinated (16 percent).

Trendline charts

Infections per million: Surge in delta variant has resulted in UK moving ahead of Italy.

Deaths per million: Canadian North now ahead of Atlantic Canada.

Vaccinations per million: Gap between Canada and other G7 countries continues to grow. Gap between China and India narrows (14.4% compared to 13.0%).

Weekly

Infections per million: UK ahead of Italy

Deaths per million: Canadian North ahead of Atlantic Canada, reflecting additional death in Yukon.

And the excess deaths report, indicating that Canadian COVID mortality has been understated (not unique to Canada):

A new study suggests Canada has vastly underestimated how many people have died from COVID-19 and says the number could be two times higher than reported.

Dr. Tara Moriarty, working group lead for the study commissioned by the Royal Society of Canada, said in an interview while most accounts have put the majority of deaths in long-term care, the new data analysis suggests the toll of COVID-19 was also heavily felt outside the homes in the community.

Many of those deaths likely occurred in lower income, racialized communities and affected essential workers, new immigrants and people living in multigenerational homes, as well as clinically frail seniors living at home, the study says.

“If we’d had some sense early on of who was dying where, if we had had a sense of just how many deaths were actually occurring … maybe people would have started looking sooner or listening sooner to people in communities who were saying, ‘It’s really really bad here, people are dying,'” Moriarty said.

“It might have provided support for those claims that might have caused some kind of action that would have saved lives.”

Moriarty said seeing Canada out of step with similar high-income countries on the proportion of long-term care deaths was a red flag that inspired the analysis by the society.

The new peer-reviewed analysis casts doubt on the widely accepted assumption that 80 per cent of Canada’s deaths due to COVID-19 occurred among older adult residents of long-term care homes.

Instead, it says at least two-thirds of deaths caused by COVID-19 in communities outside of long-term care may have been missed. That would put the proportion of deaths in long-term care at around 45 per cent, much closer to the average of 40 per cent reported by peer countries in the Organization for Economic Co-operation and Development.

The conclusion is based on a review of reports of excess deaths across Canada, the pattern of COVID-19 fatalities during the pandemic and cremation data showing a significant spike in deaths at homes versus hospitals in 2020. It also relies on antibody surveillance testing that collectively unmasked the likely broad scope of undetected COVID-19 infections.

The researchers adjusted the data to account for things like increased deaths due to the drug toxicity crisis and the expected drop in deaths linked to the pandemic because of things like reduced traffic accident rates.

The extent of “likely missed” fatalities varies by province and there are major data gaps in what was available, Moriarty said.

The knowledge gap is particularly acute in British Columbia, Saskatchewan, and Manitoba where cause-of-death data is only complete into February 2020, the report says. It was less of a problem in Quebec, where the virus accounted for all excess deaths, and Ontario.

Between Feb. 1 and Nov. 28, 2020, the study found COVID-19 deaths of about 6,000 people aged 45 and older appeared to have gone undetected, unreported or unattributed to the virus.

“This suggests that if Canada has continued to miss these fatalities at the same rate since last November, the pandemic mortality burden may be two times higher than reported,” the report says.

Eemaan Kaur Thind, a public health practitioner who looked at both detected and undetected COVID-19 deaths in racialized communities, said the results weren’t a shock given previous reports linking the communities and deaths or hospitalization rates.

The study suggests it’s likely many cases in those communities were never identified, and the resulting deaths were never counted.

“We know that a high-proportion of essential workers happen to be visible minorities,” she said.

“None of that surprised me, although it never really becomes any less hard to see the official numbers when you see something like this.”

Thind said she hopes the findings push policy-makers to listen to those most affected, many of whom raised alarms about things like the role language barriers played in access to COVID-19 testing and care.

“Data is very important but I think it’s more important to also listen to people and believe them.”

About 25 per cent of likely deaths occurred in people between 45 and 64, the study said.

The researchers make several recommendations, including mandating weekly preliminary reporting of deaths due to all causes to Statistics Canada, performing COVID-19 testing on all people who die in any setting, and immediately adopting methods used by the U.S. Centers for Disease Control for estimating excess mortality during the pandemic.

The group also calls for the creation of a national COVID-19 mortality task force with the provinces and territories, and independent advisers to investigate why so many Canadian COVID-19 cases and deaths have been missed or unreported, including examining demographic and employment data for those who died.

Source: COVID-19 deaths in Canada may be two times higher than reported: Study

#COVID-19: Comparing provinces with other countries 23 June Update, China’s vaccine diplomacy

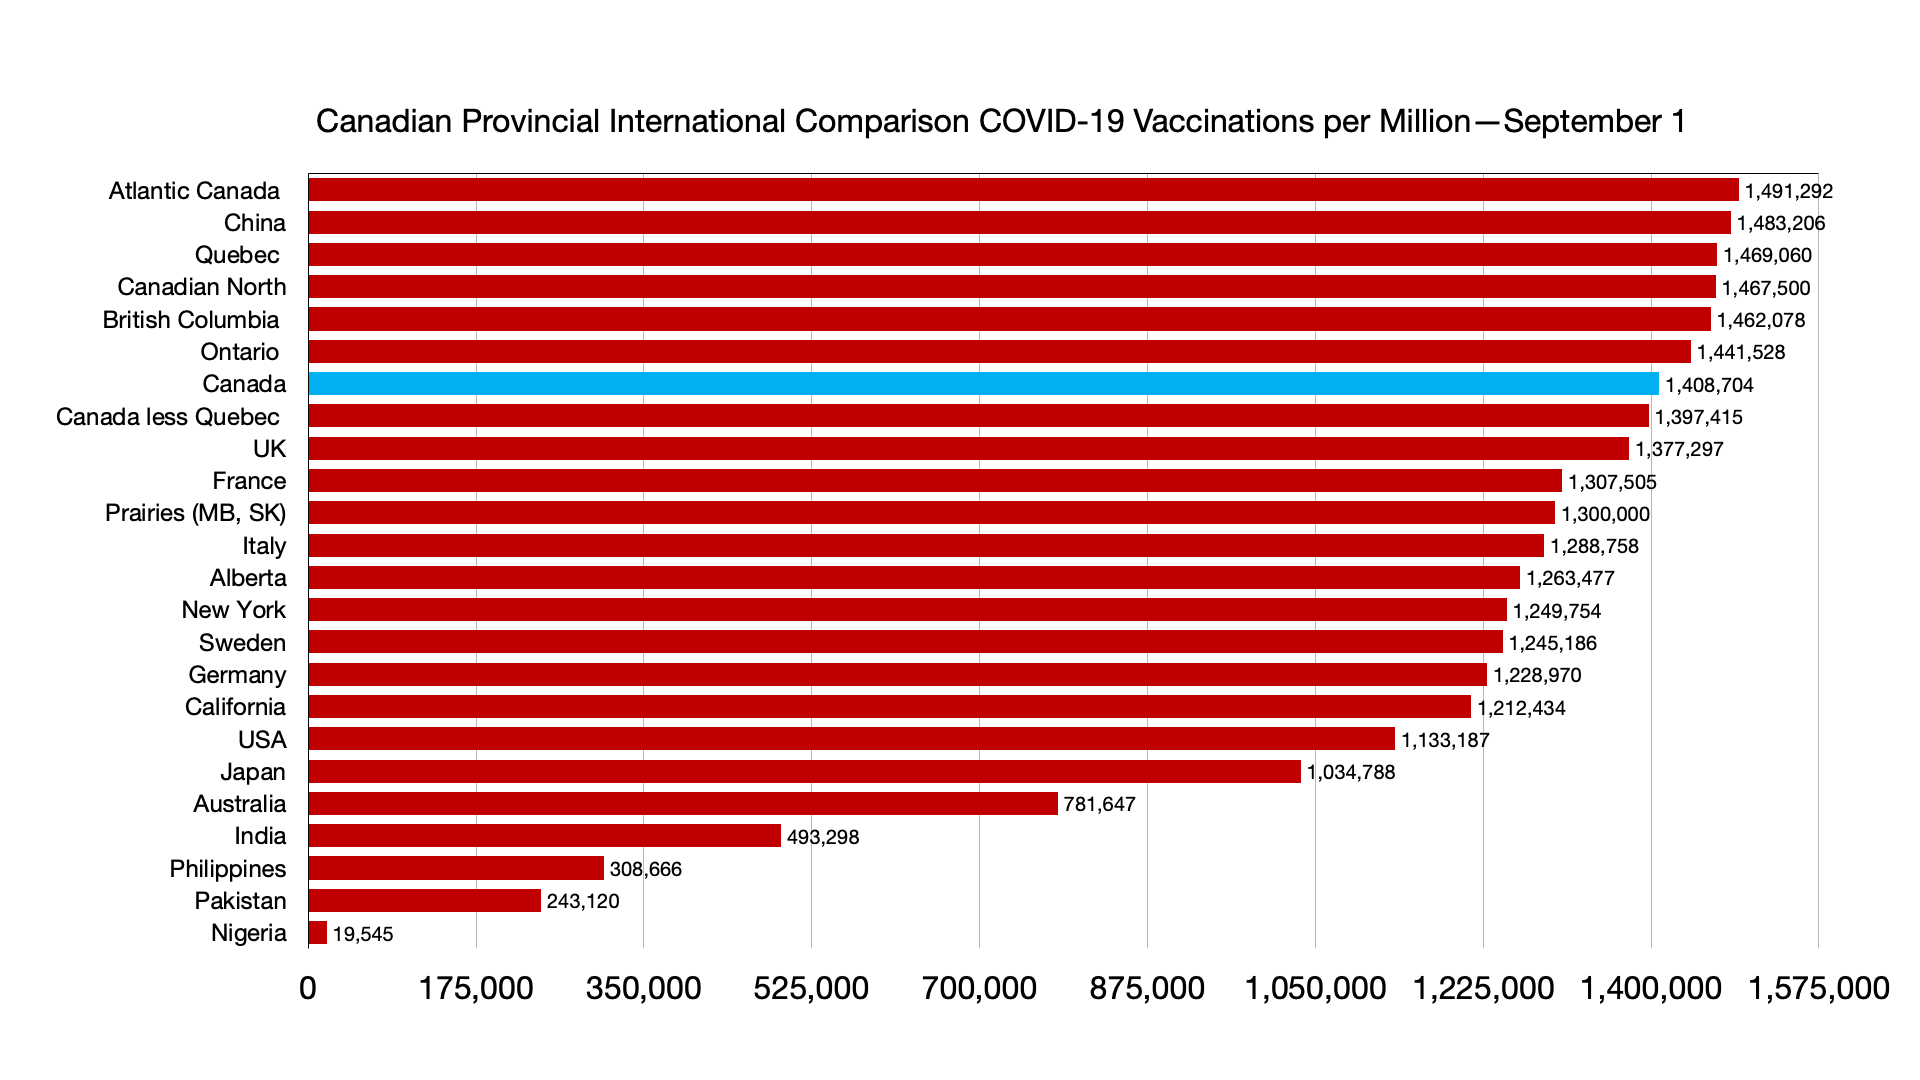
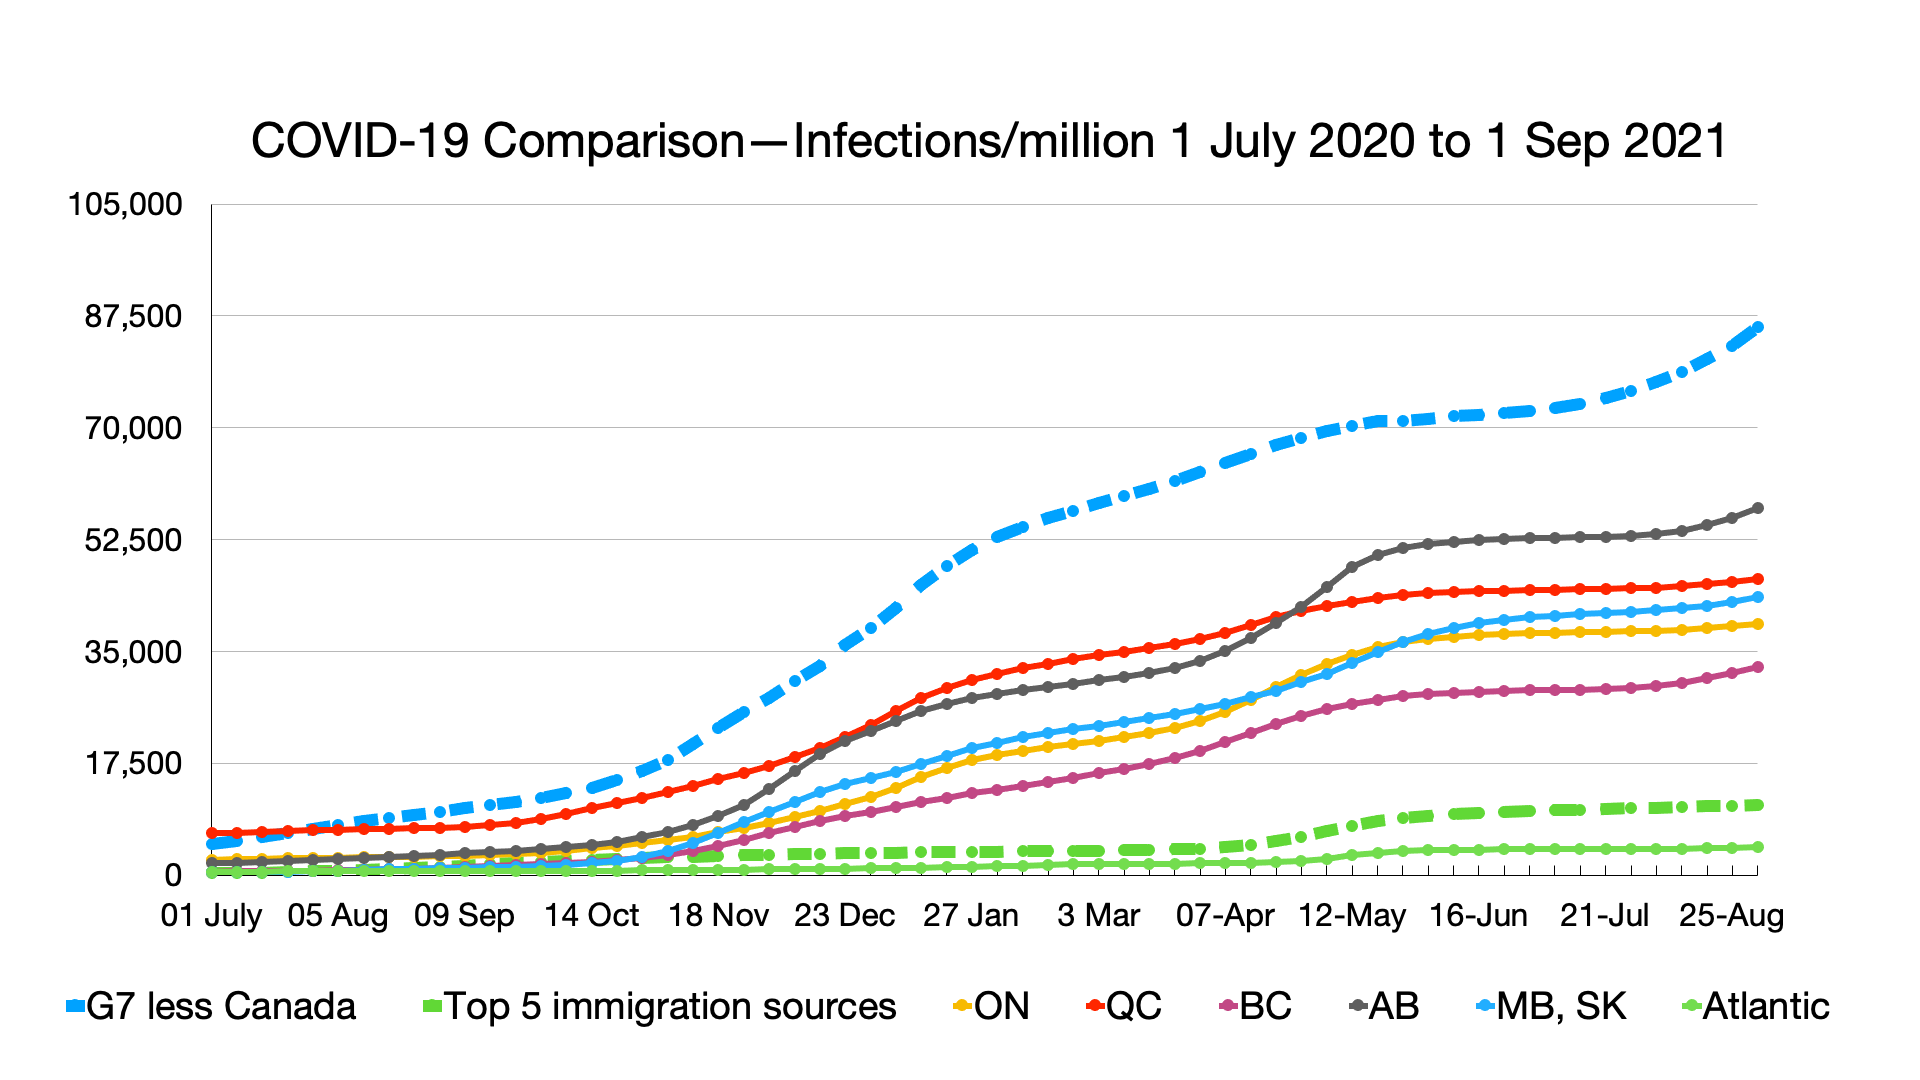
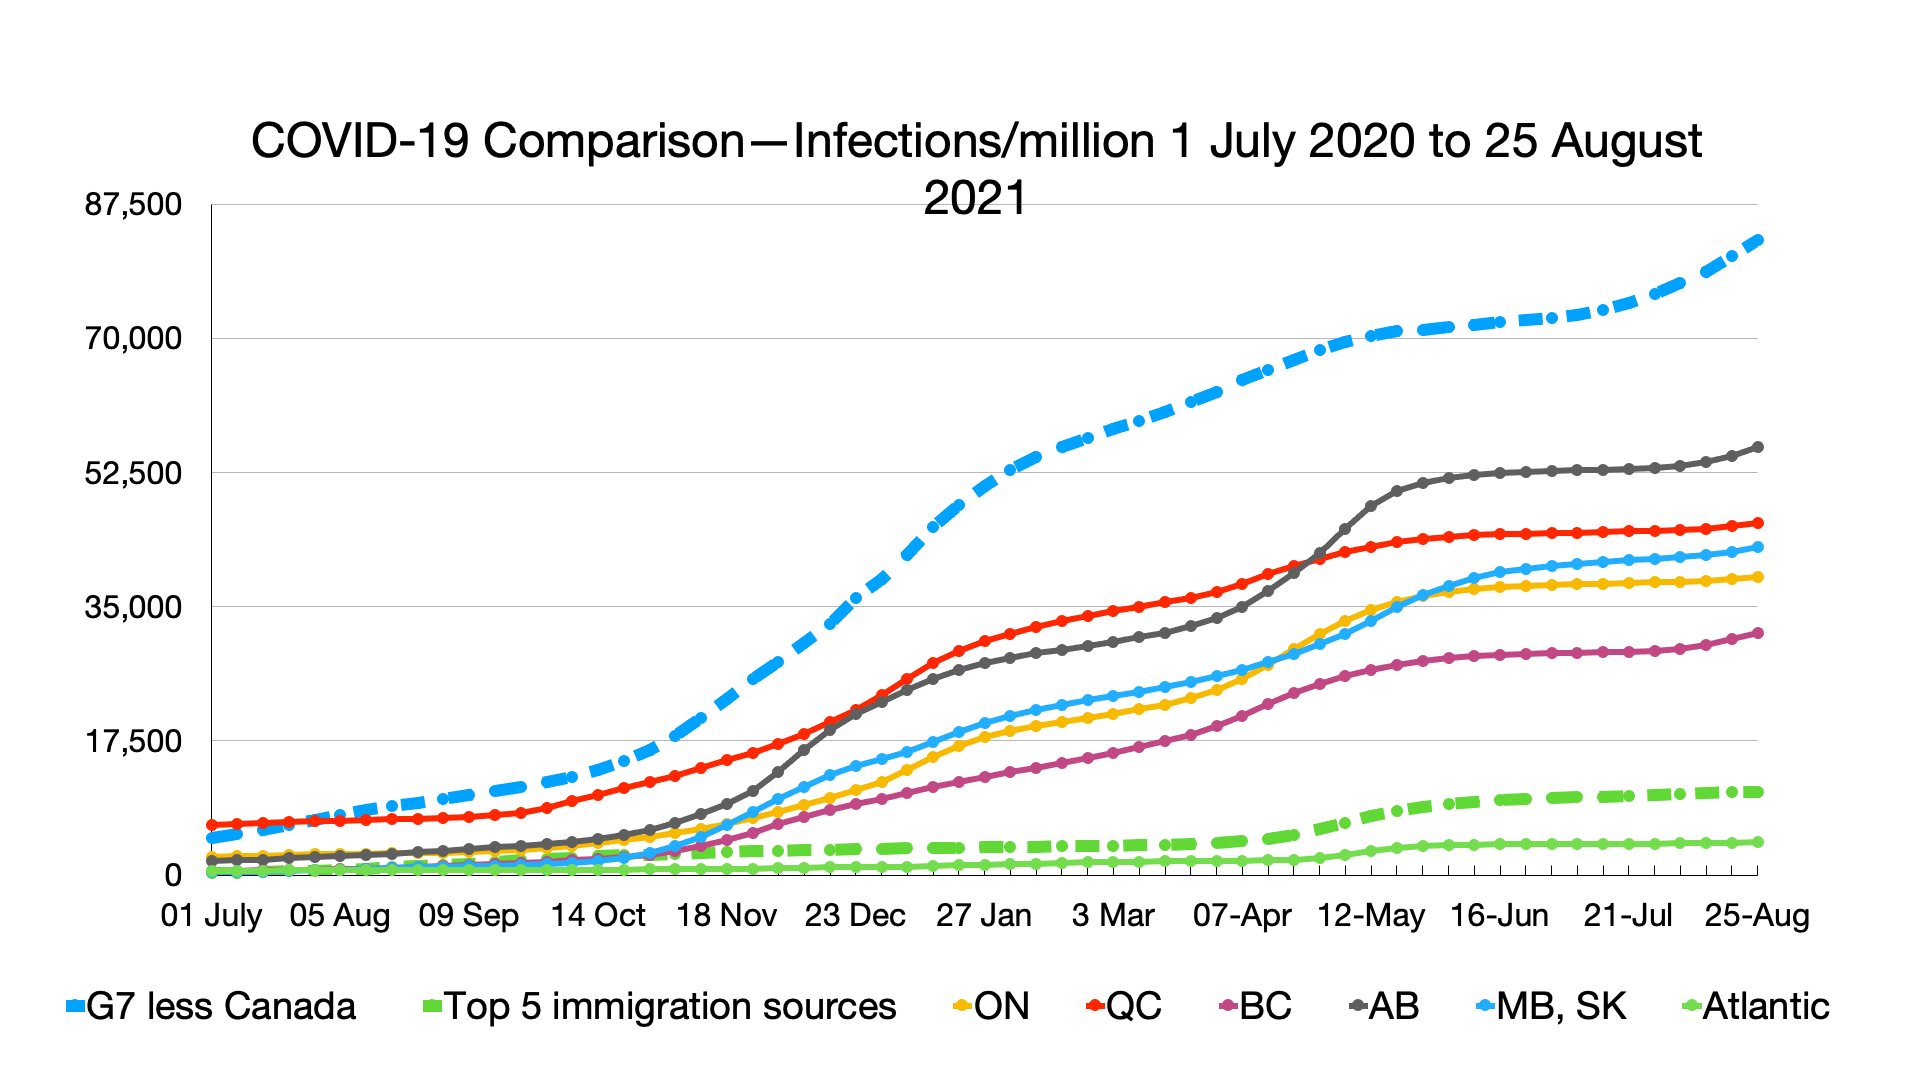
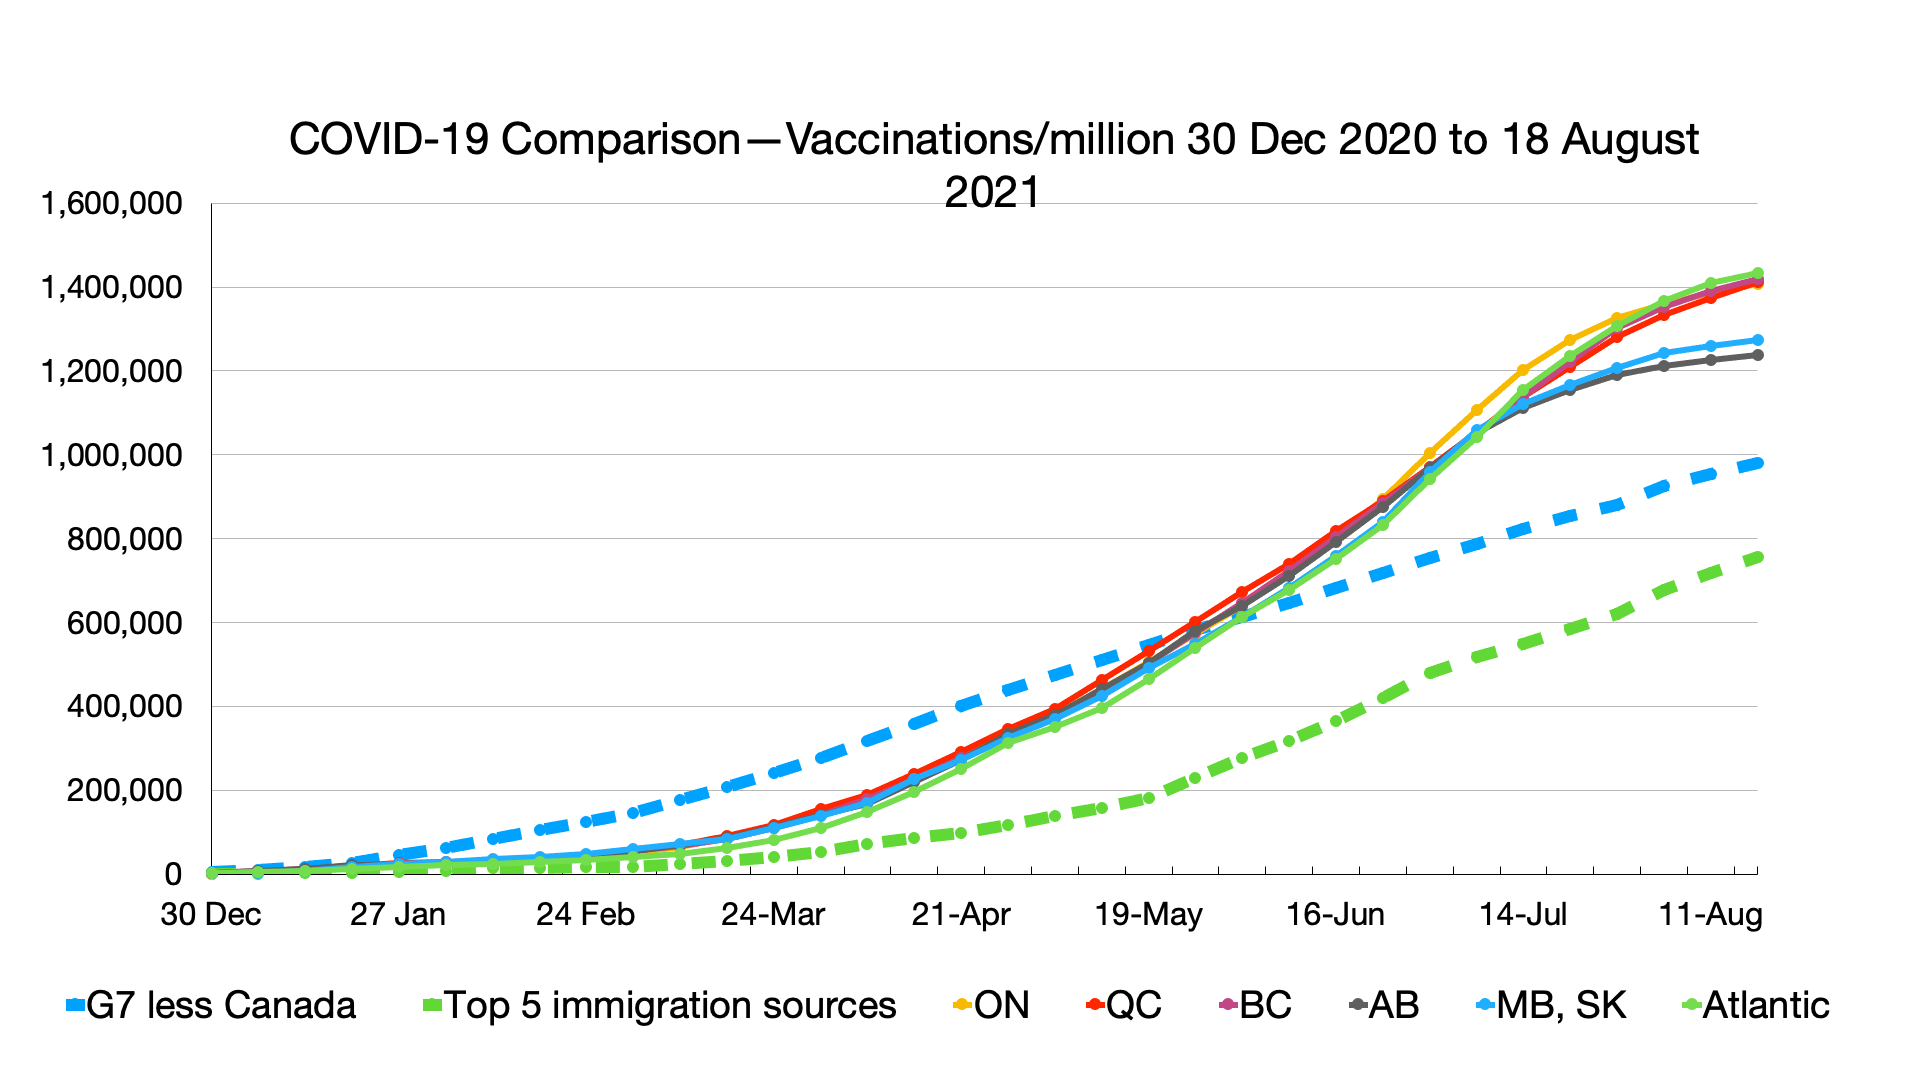
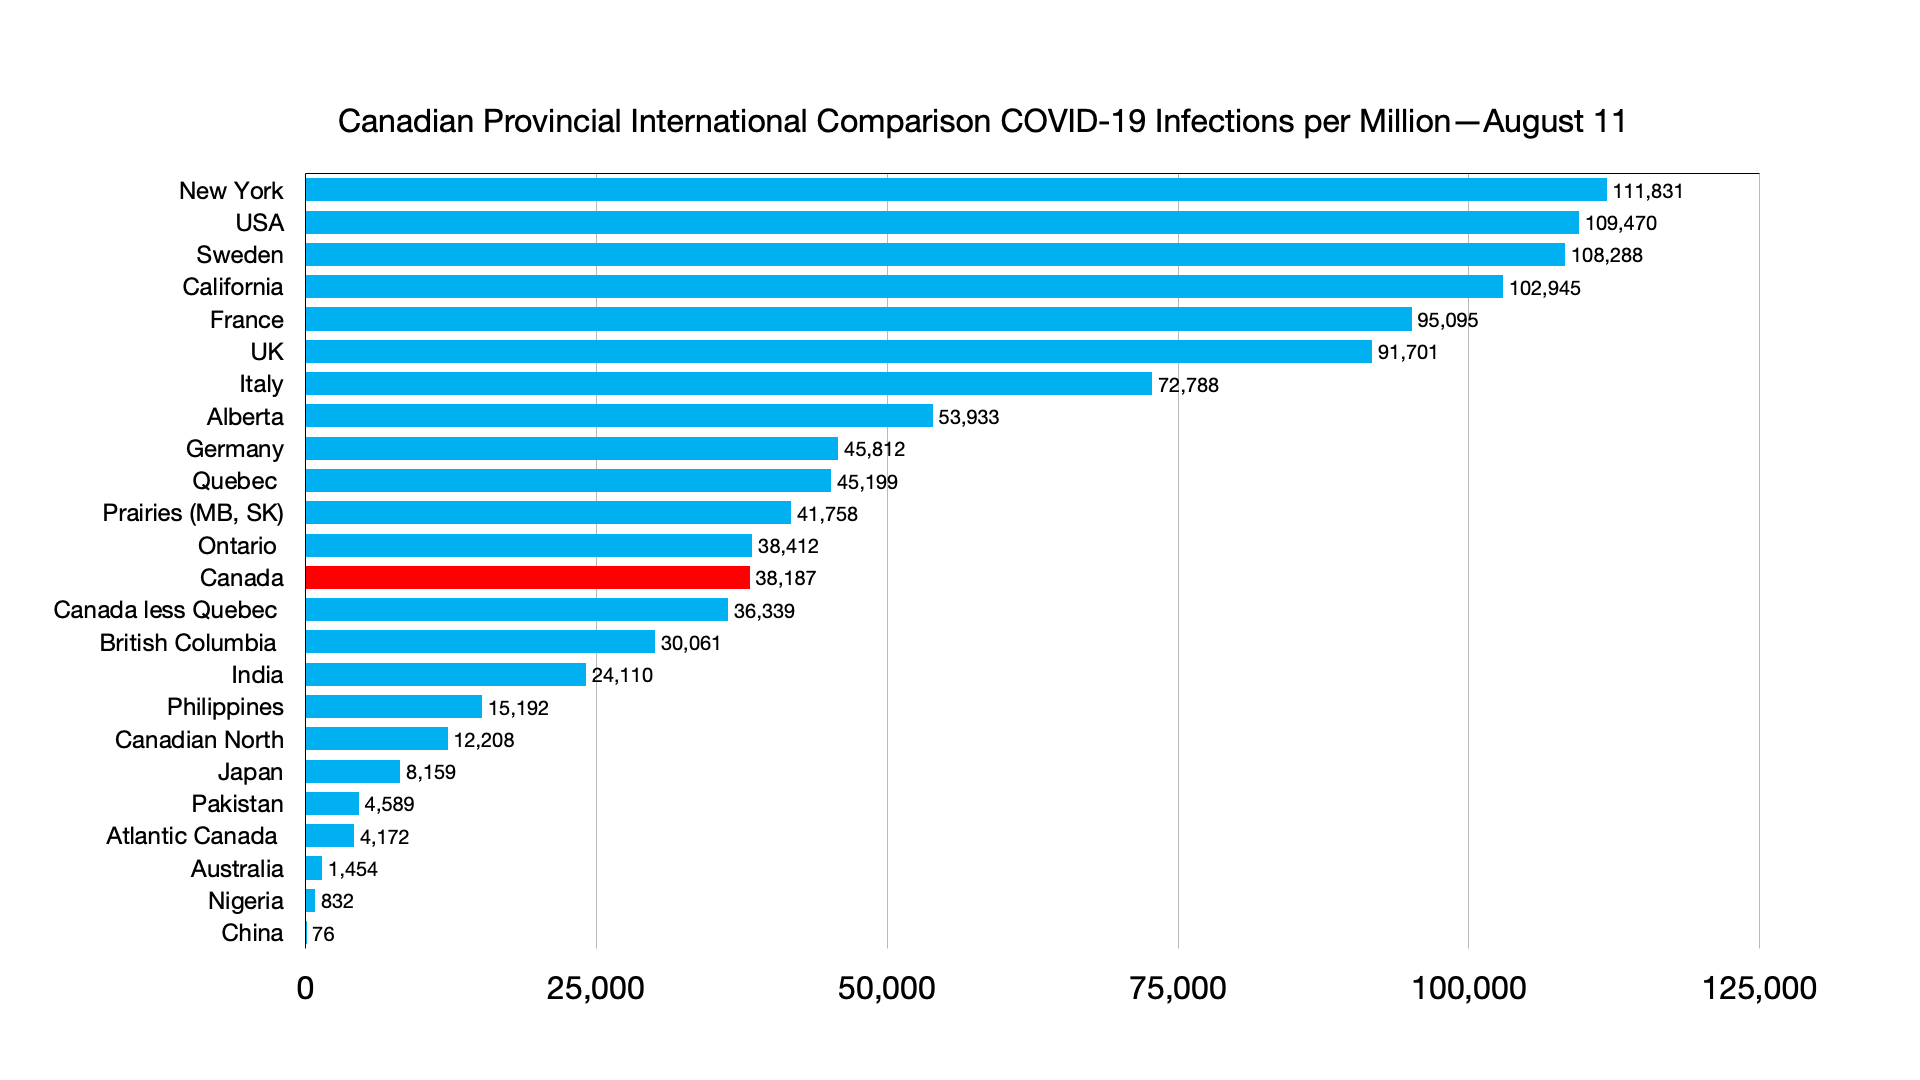
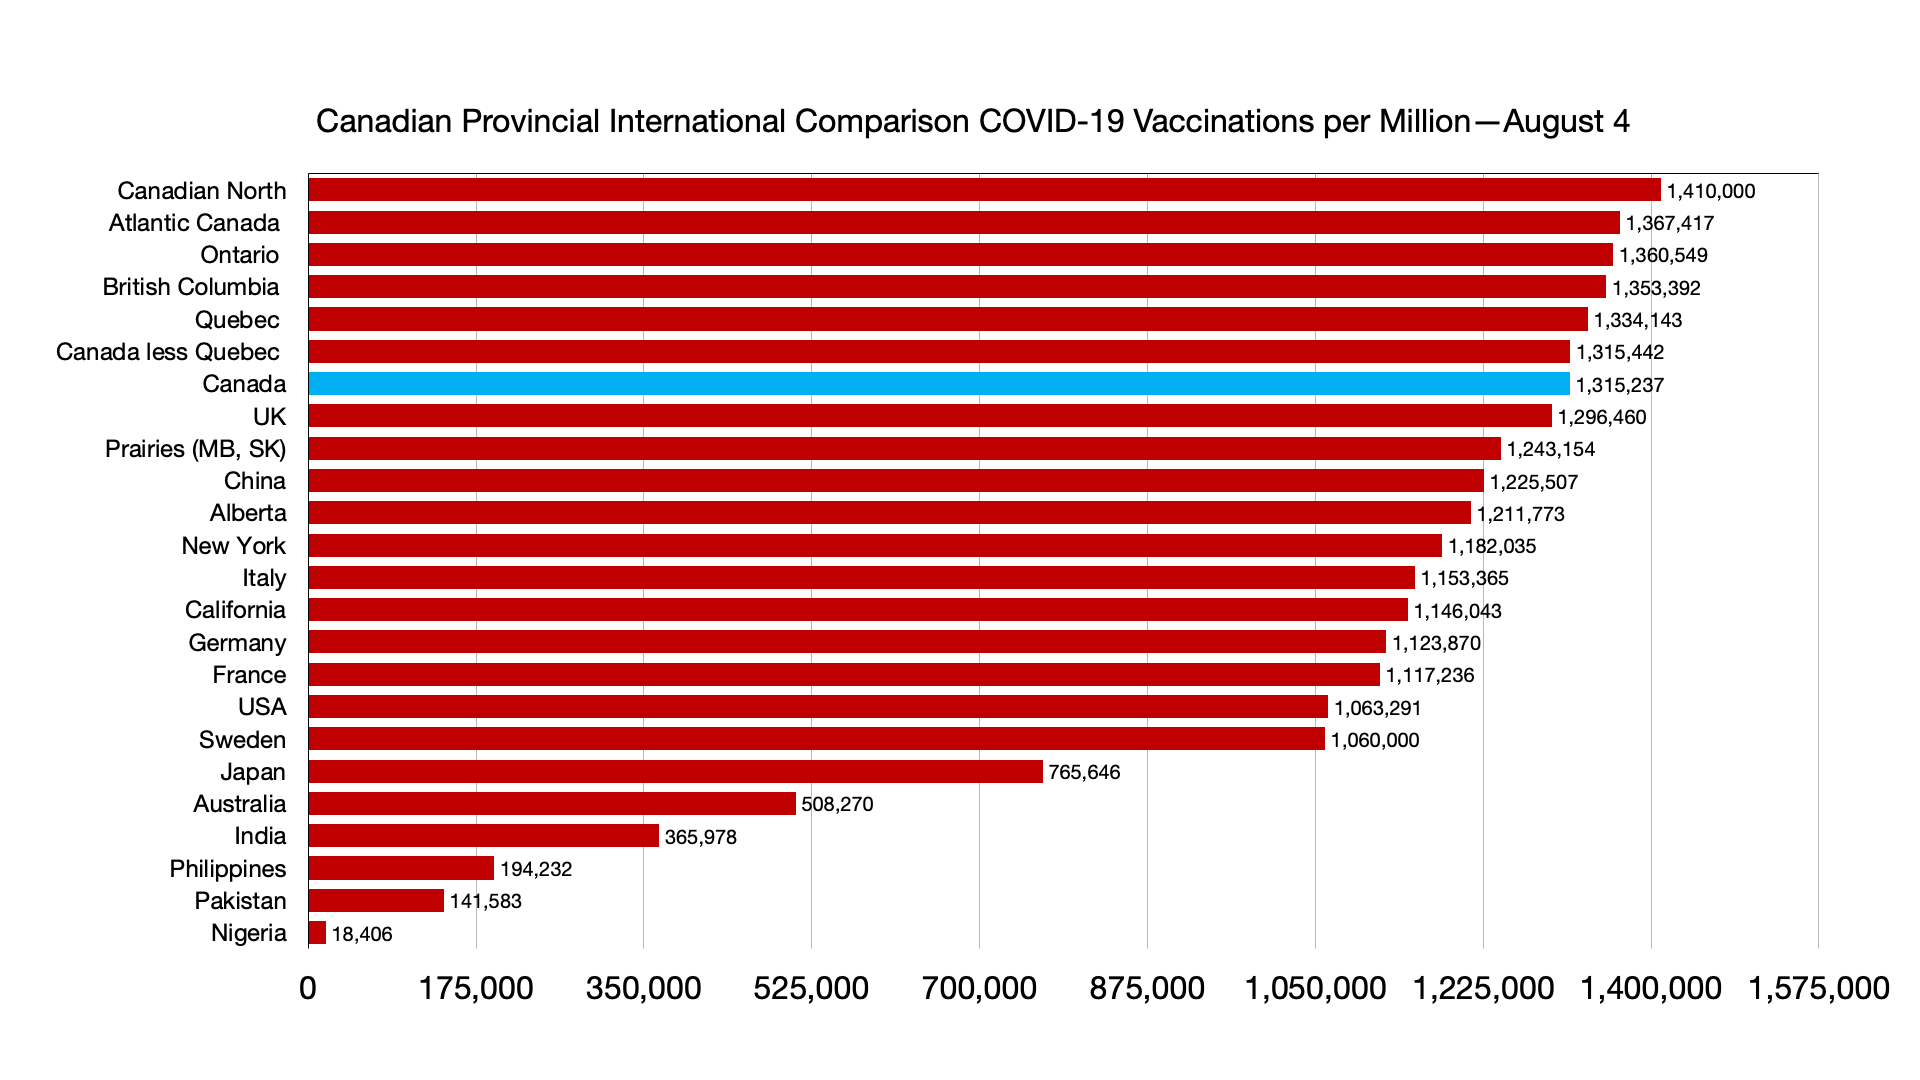
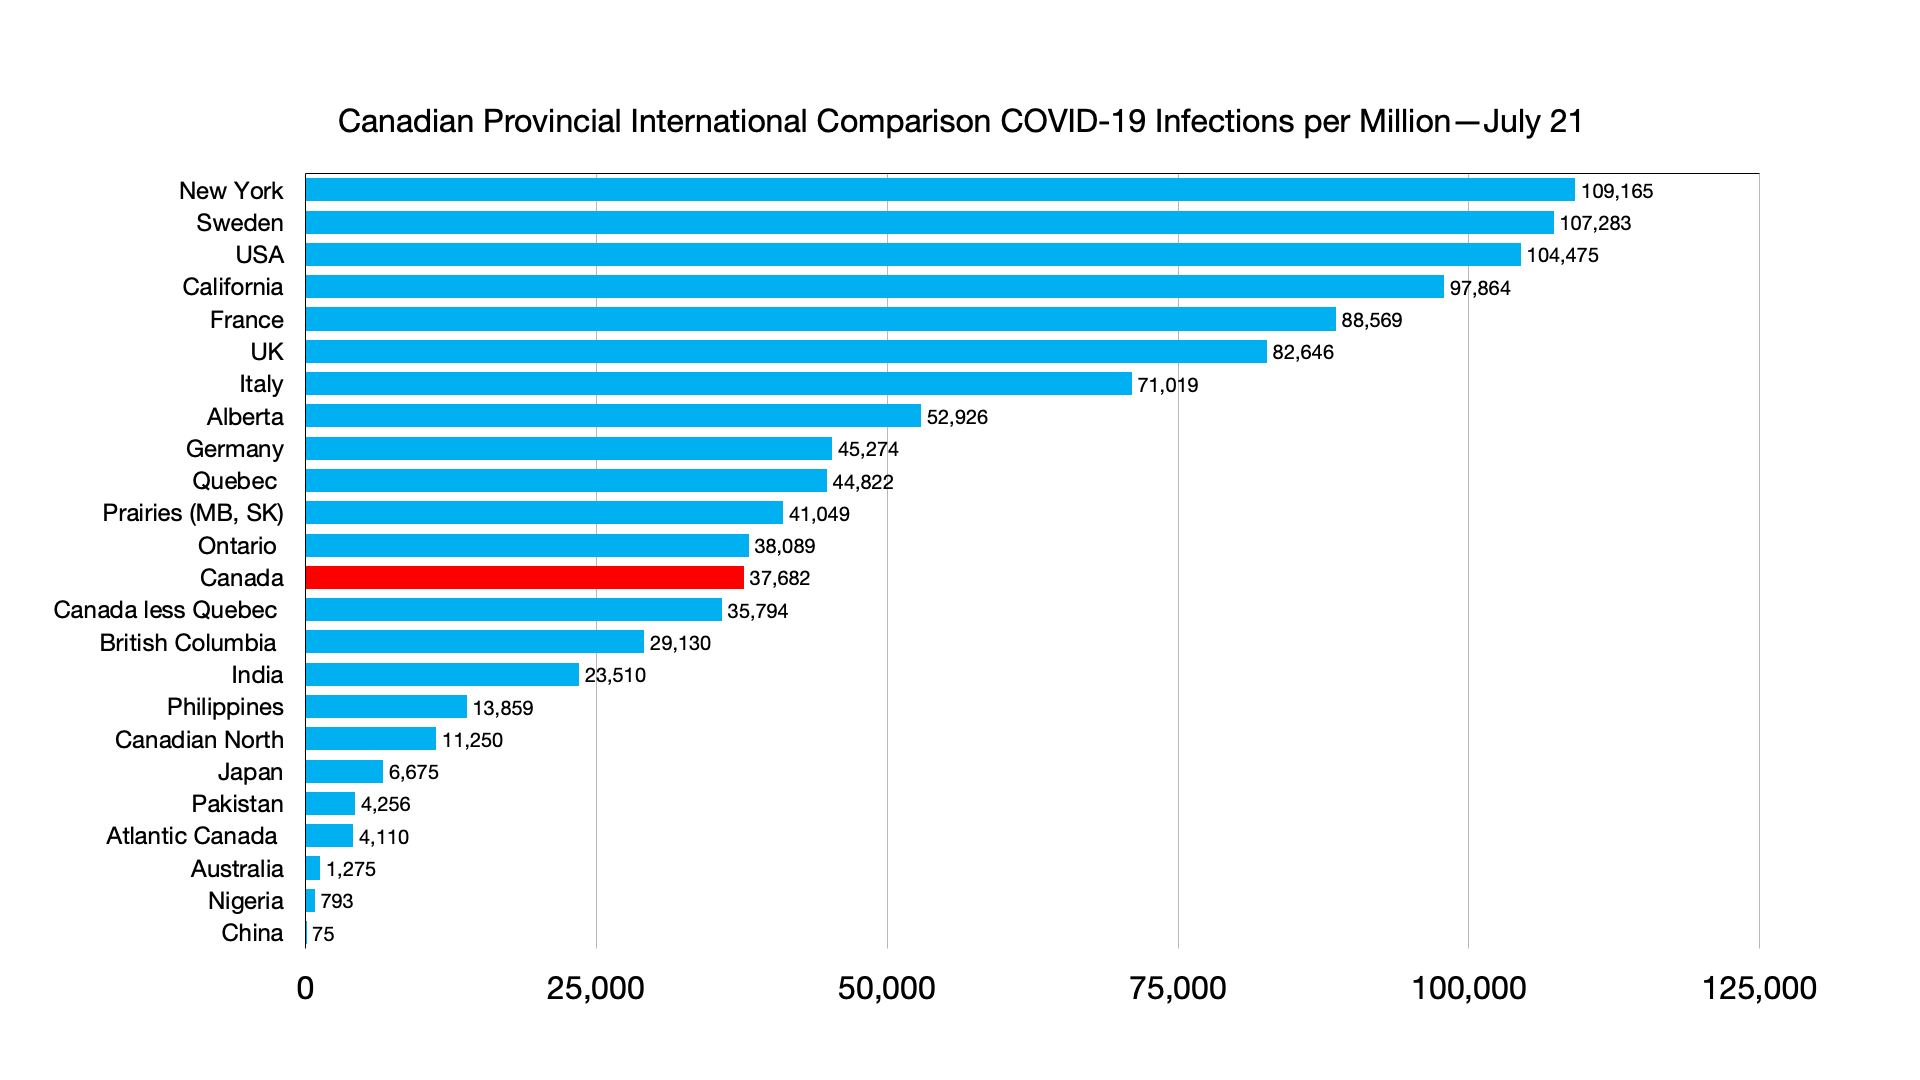
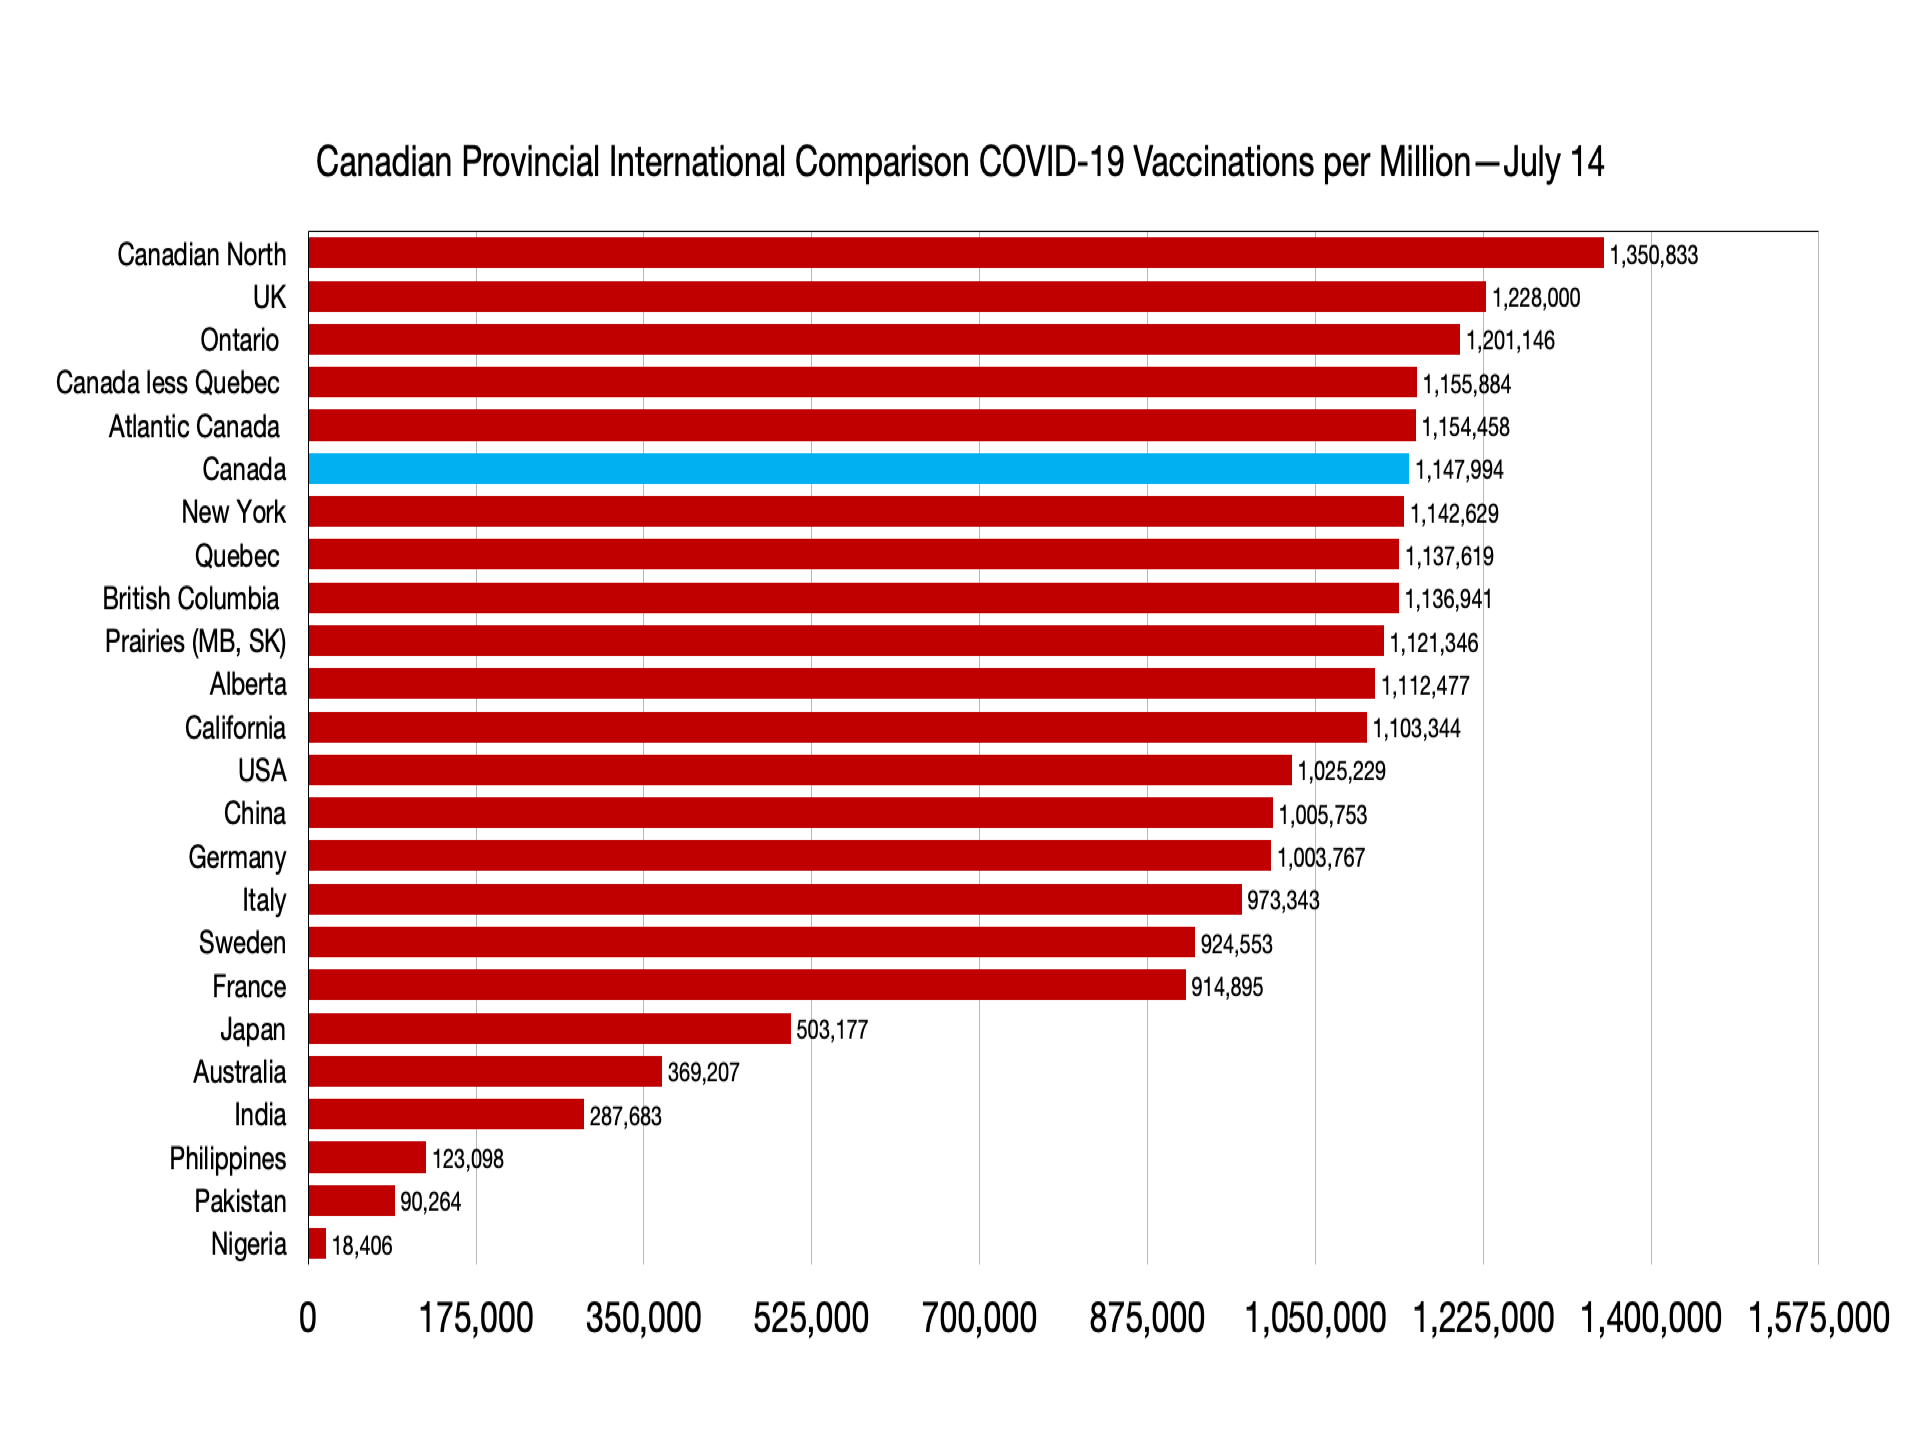
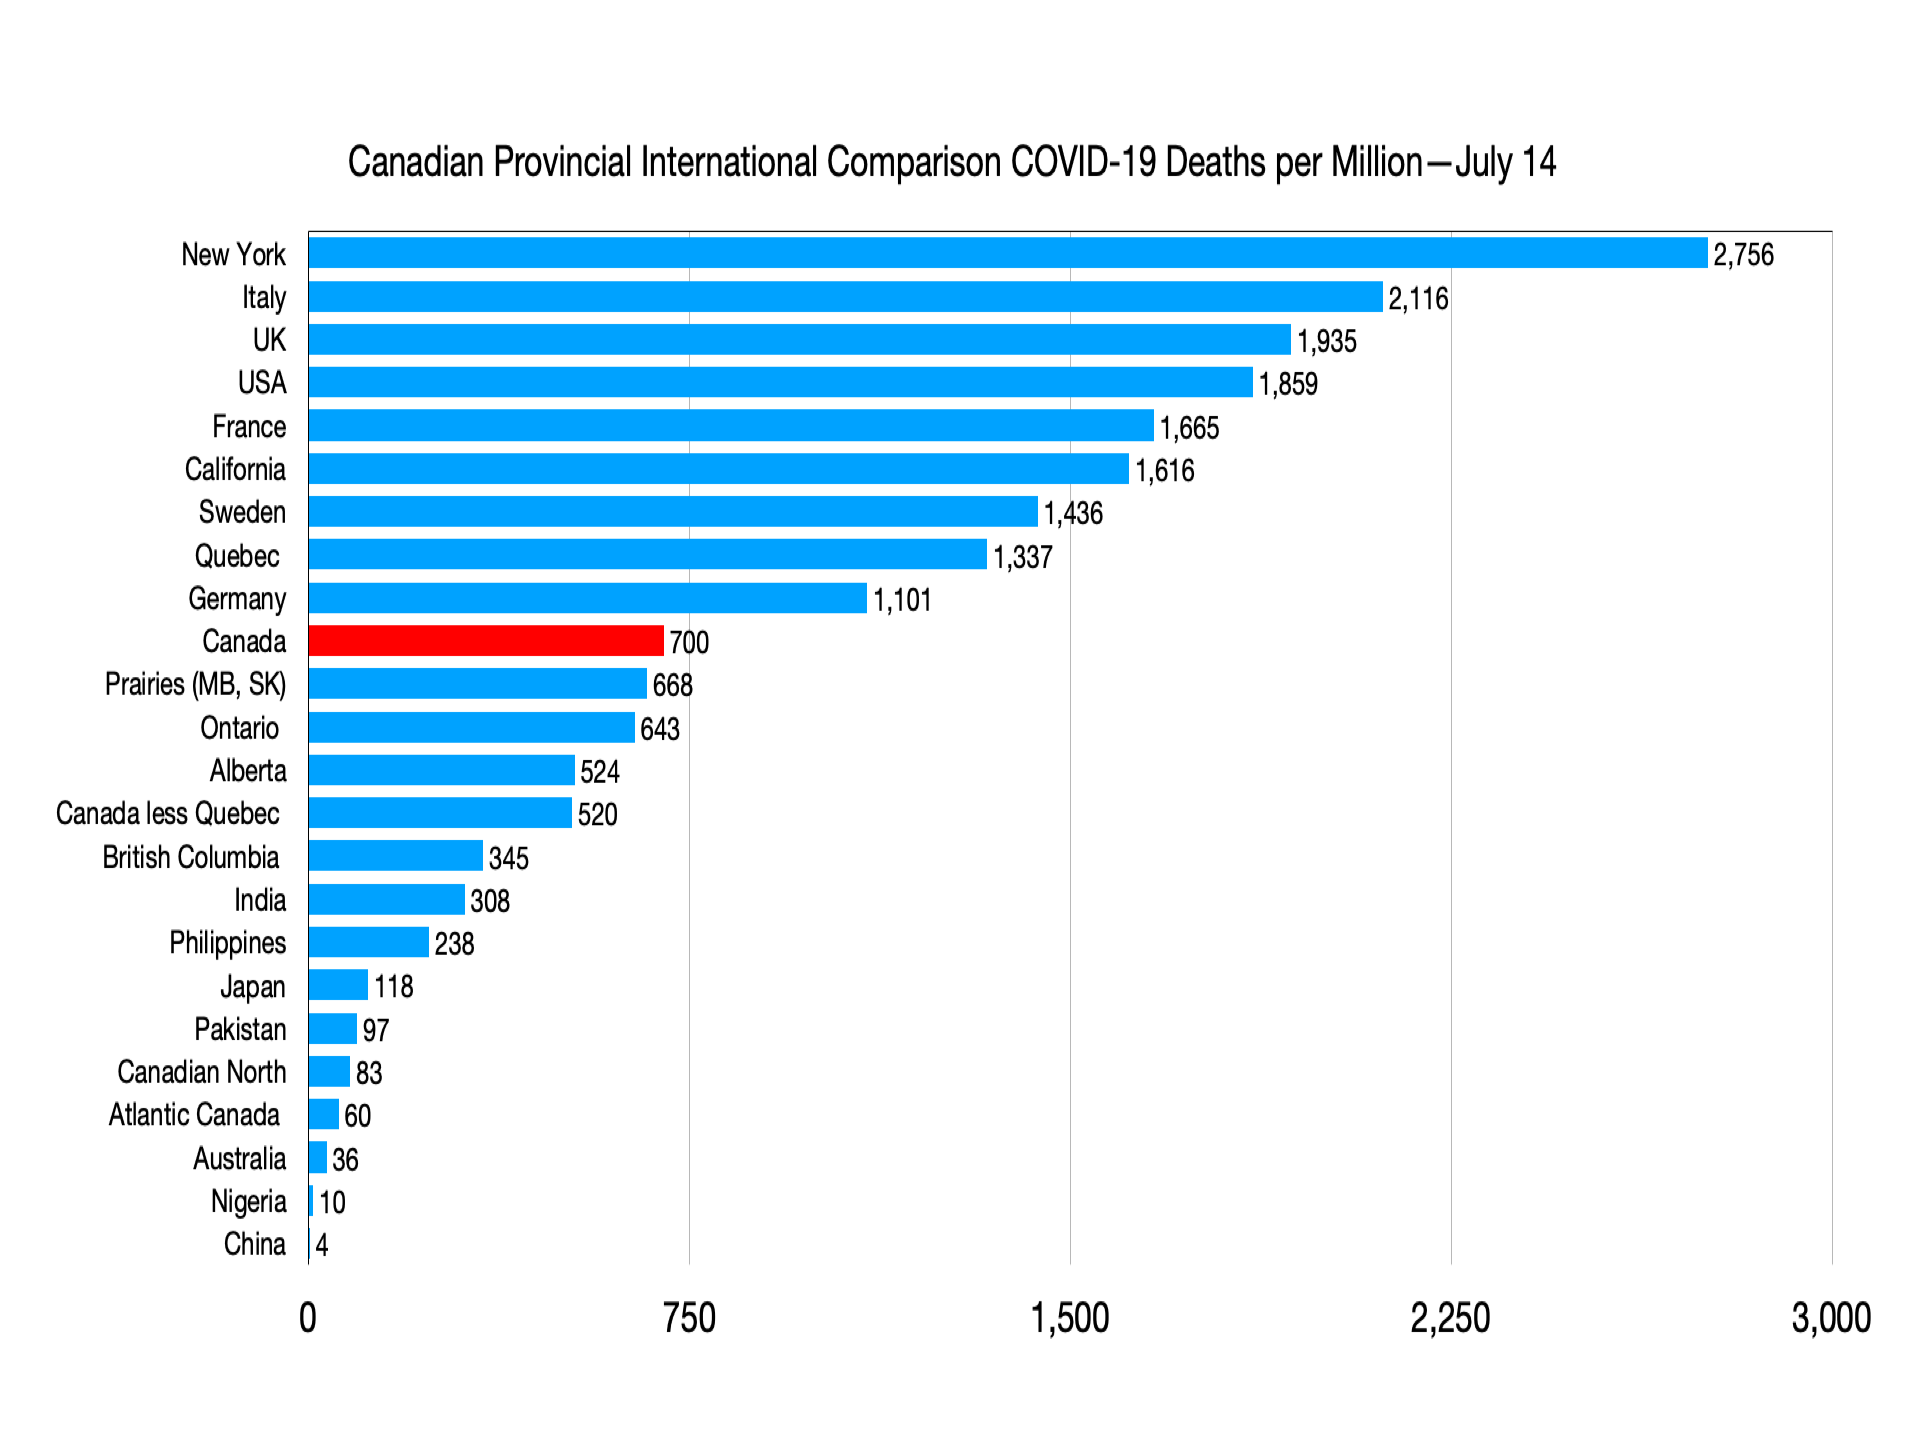
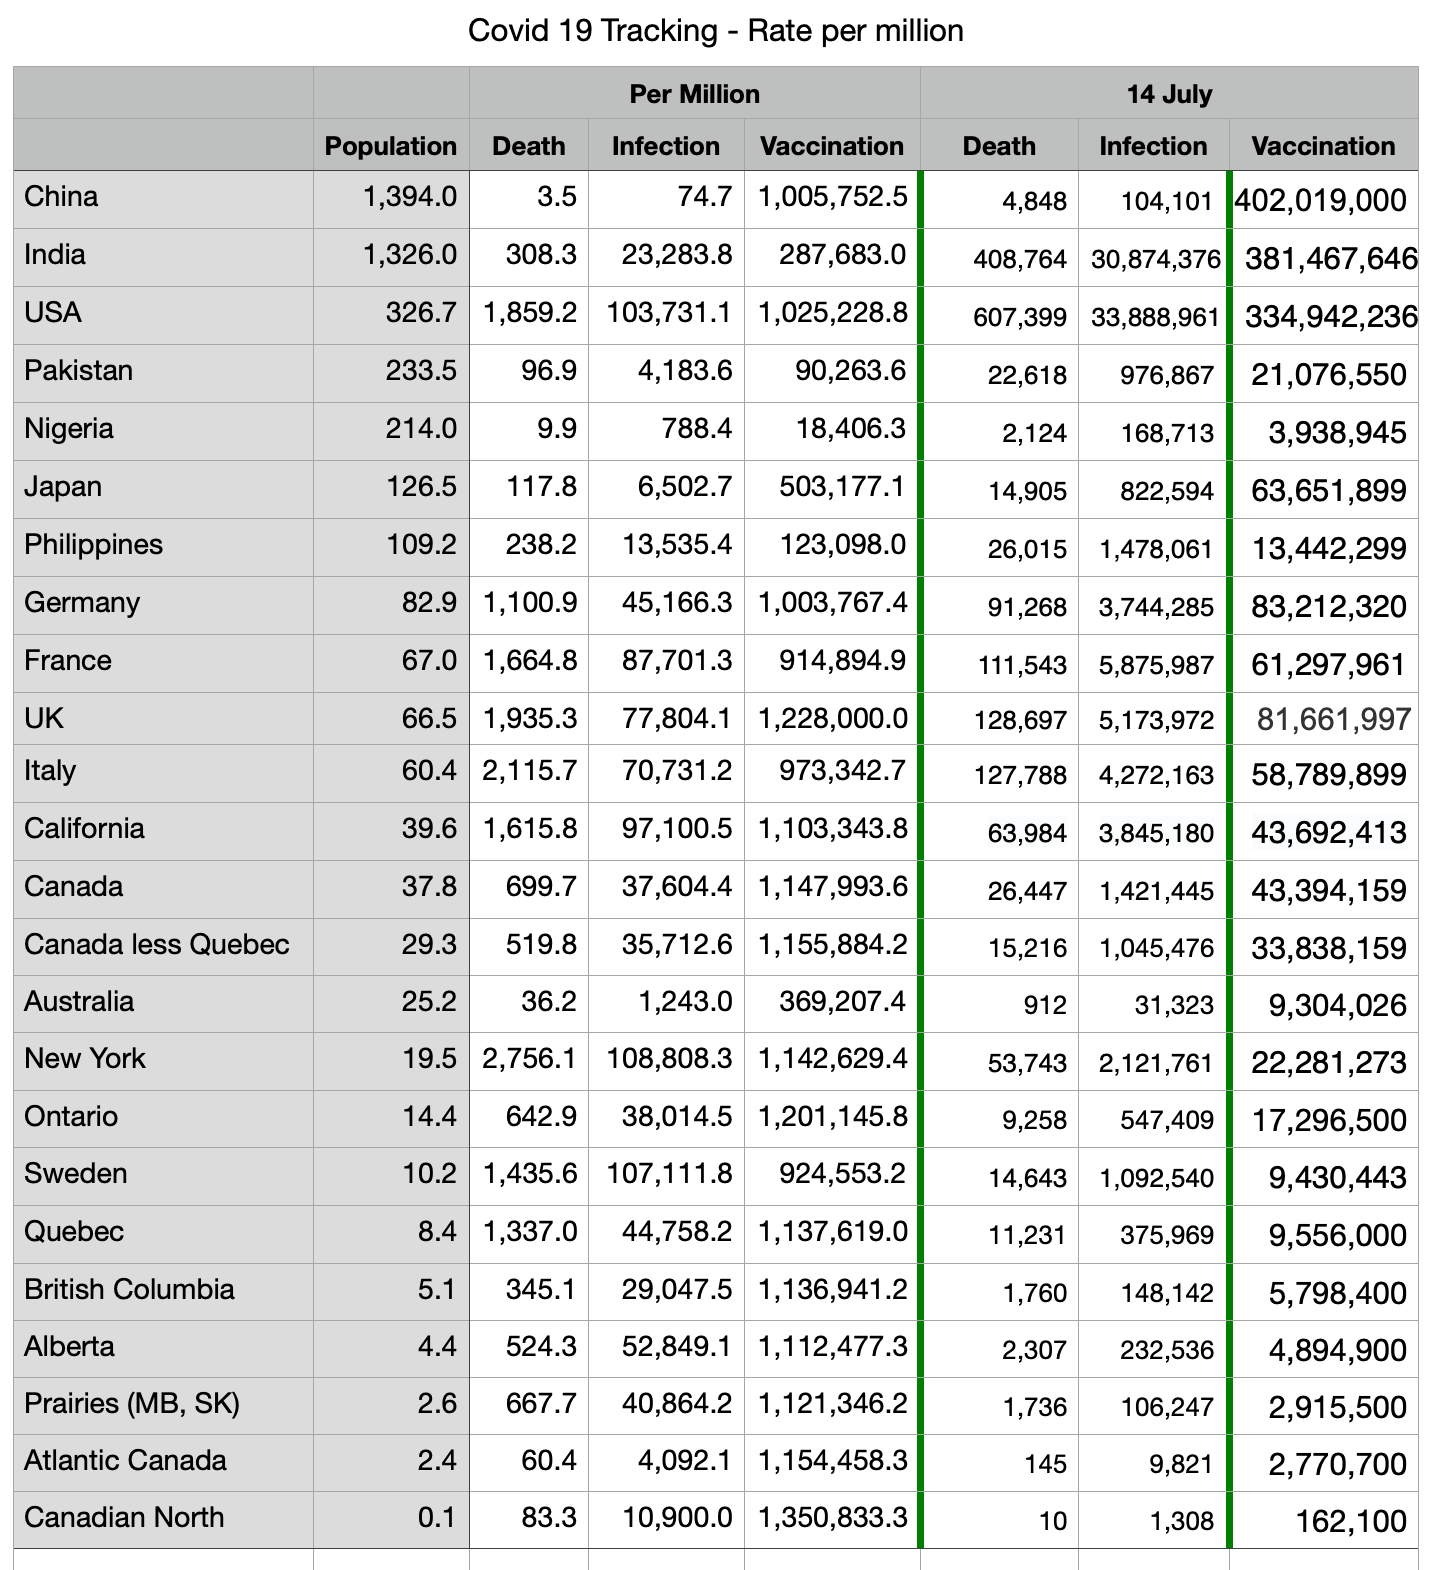
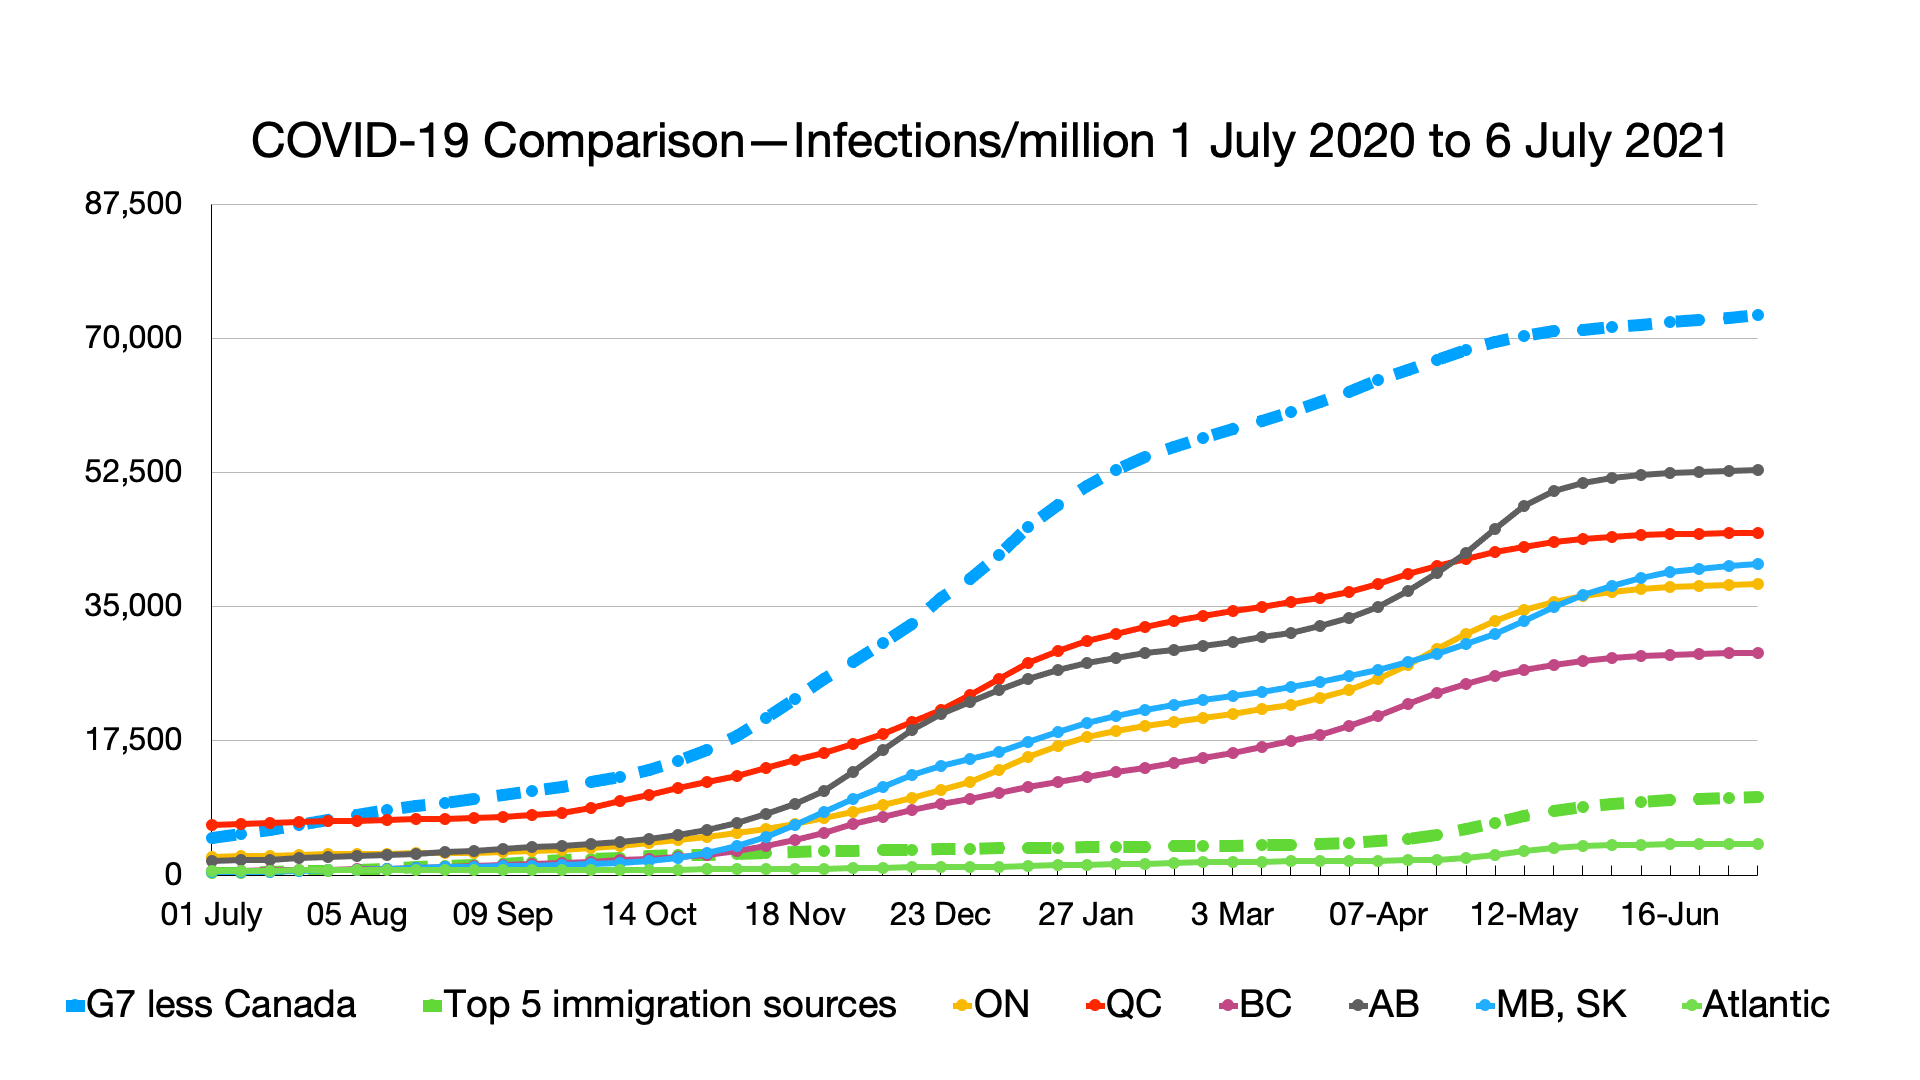
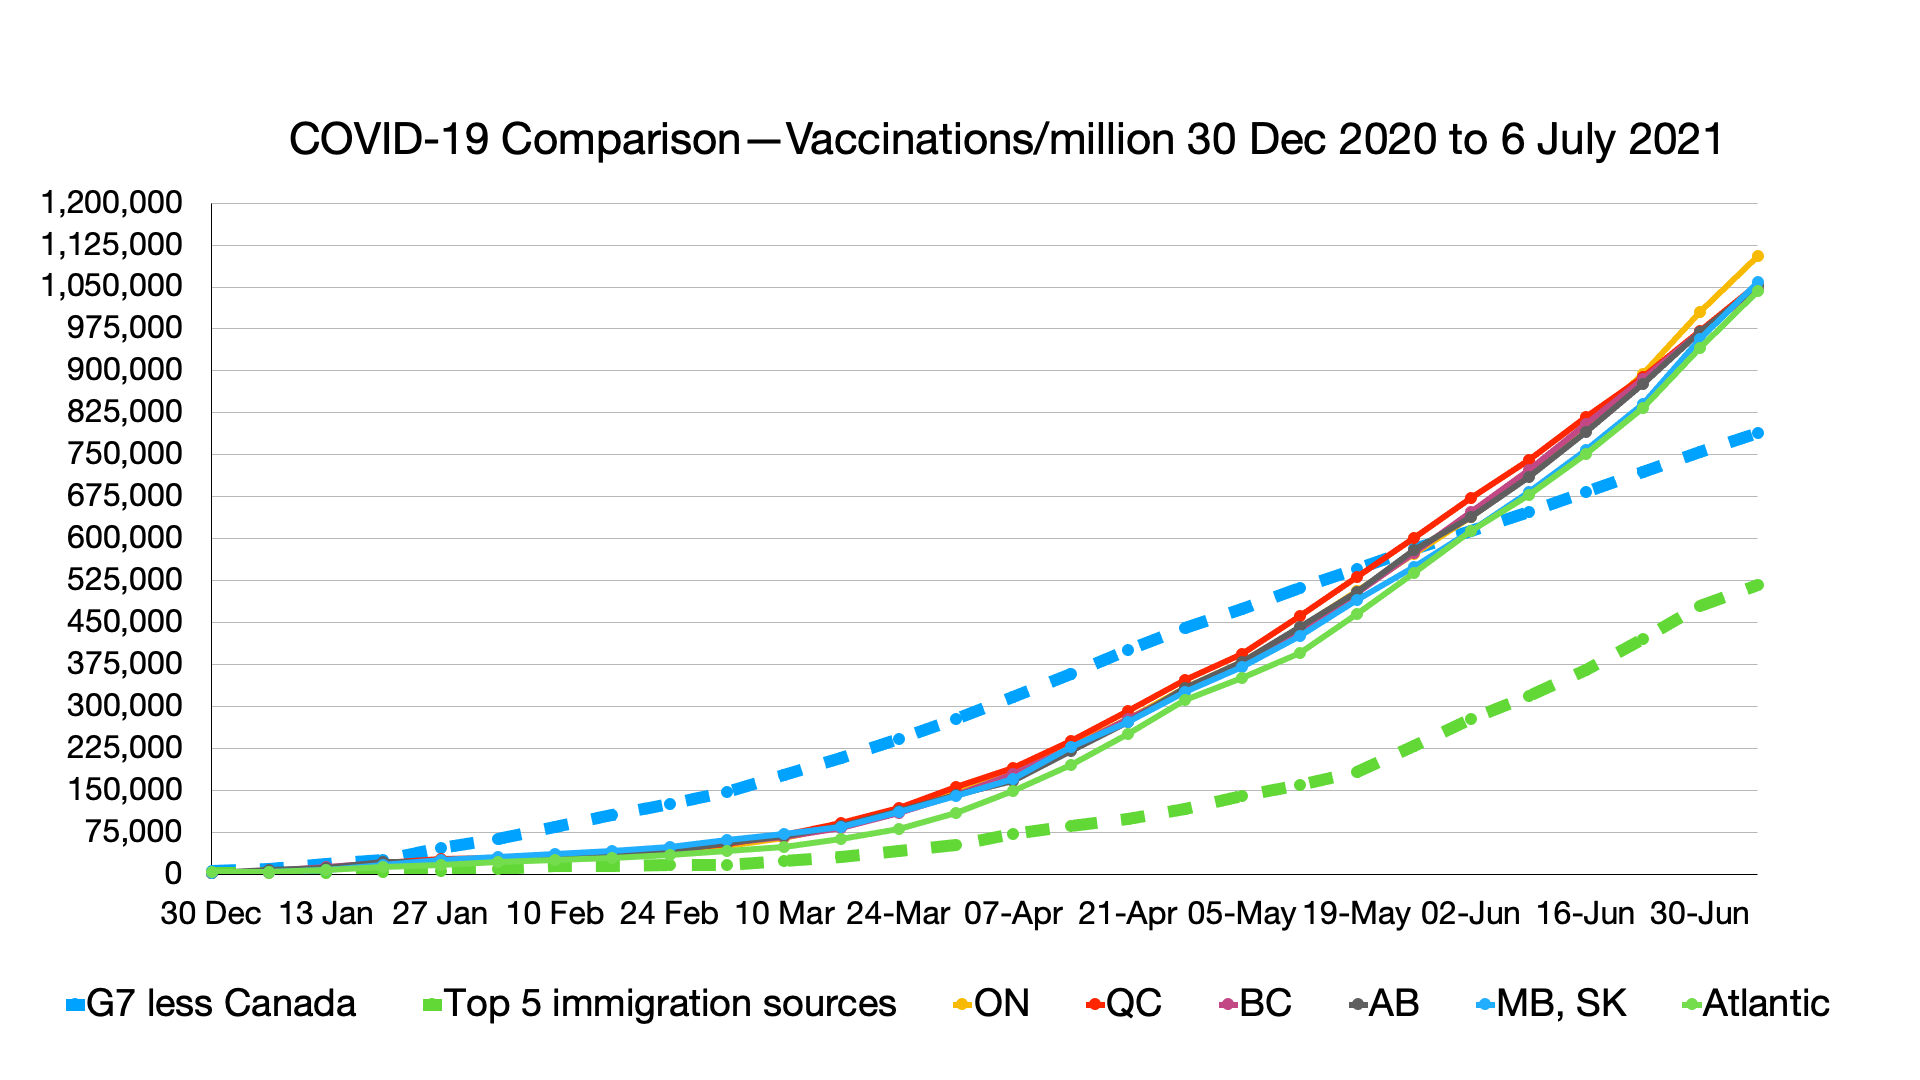
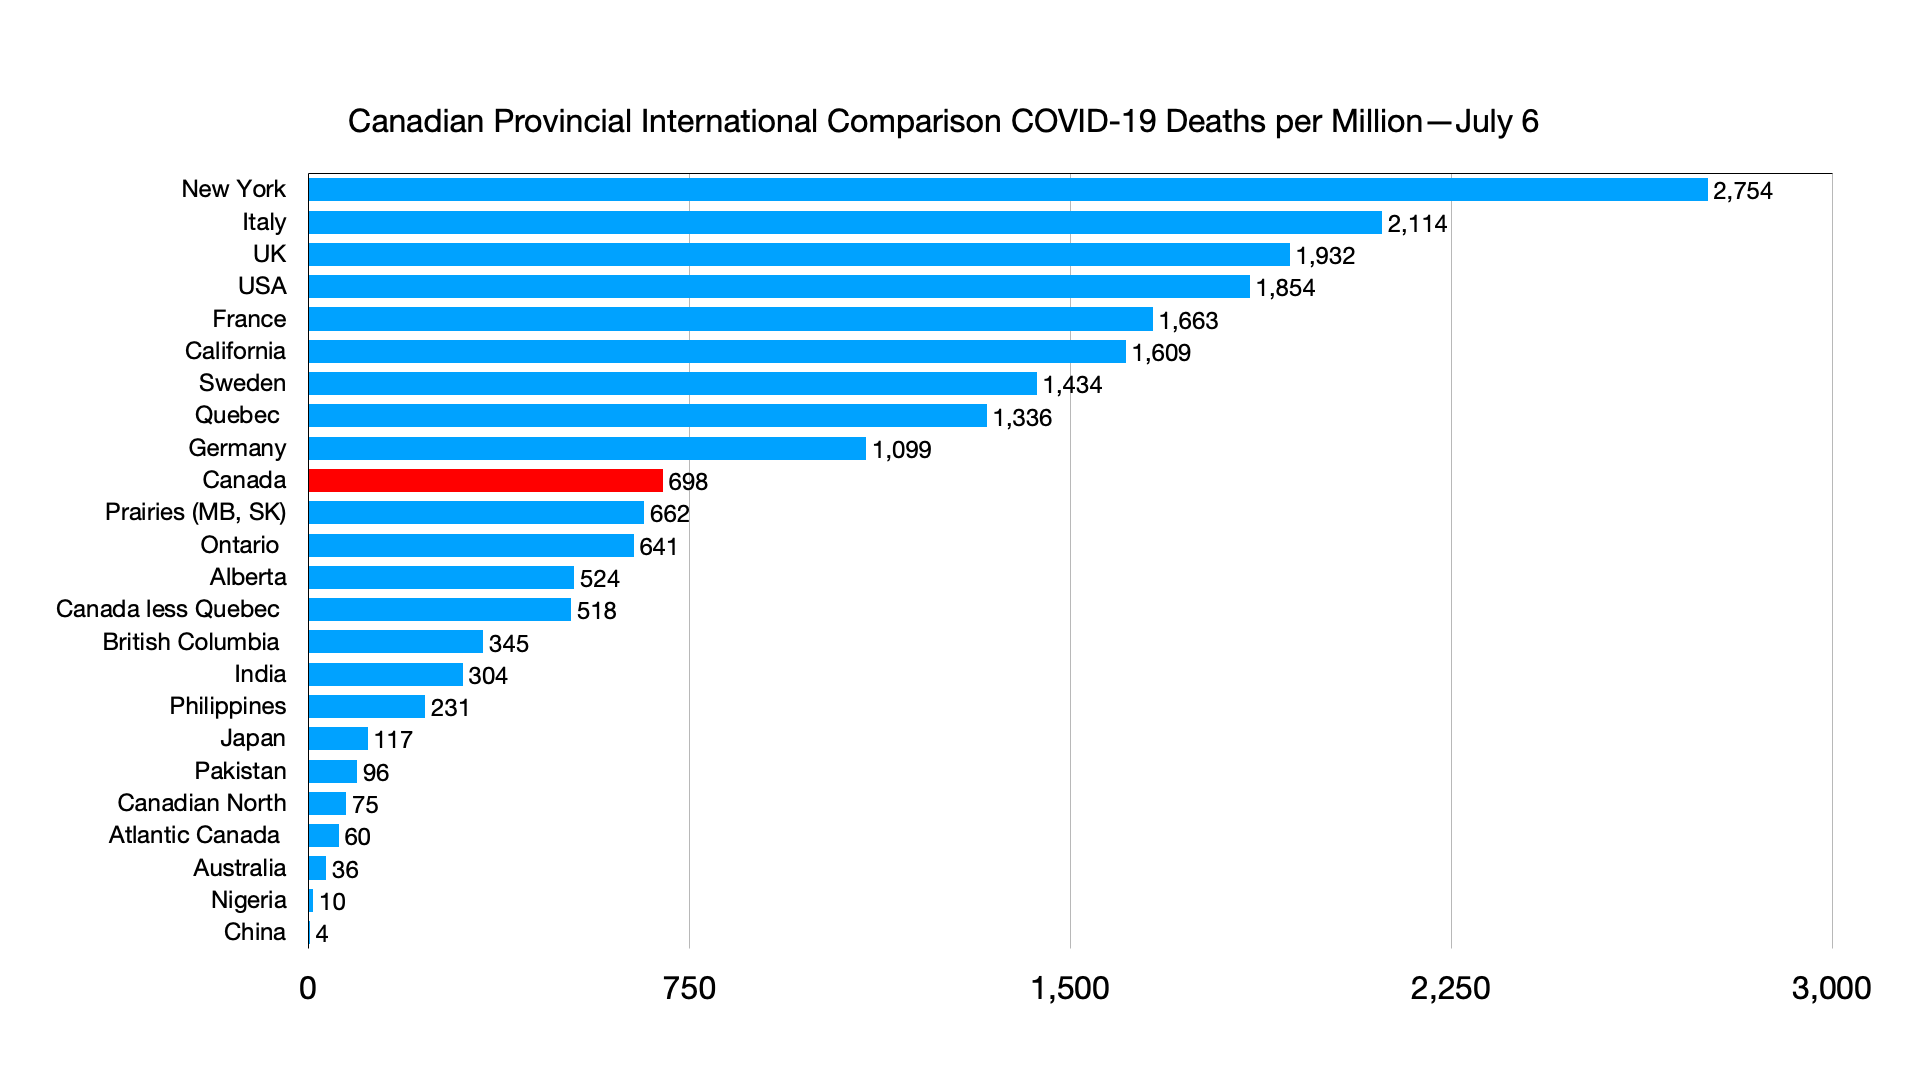
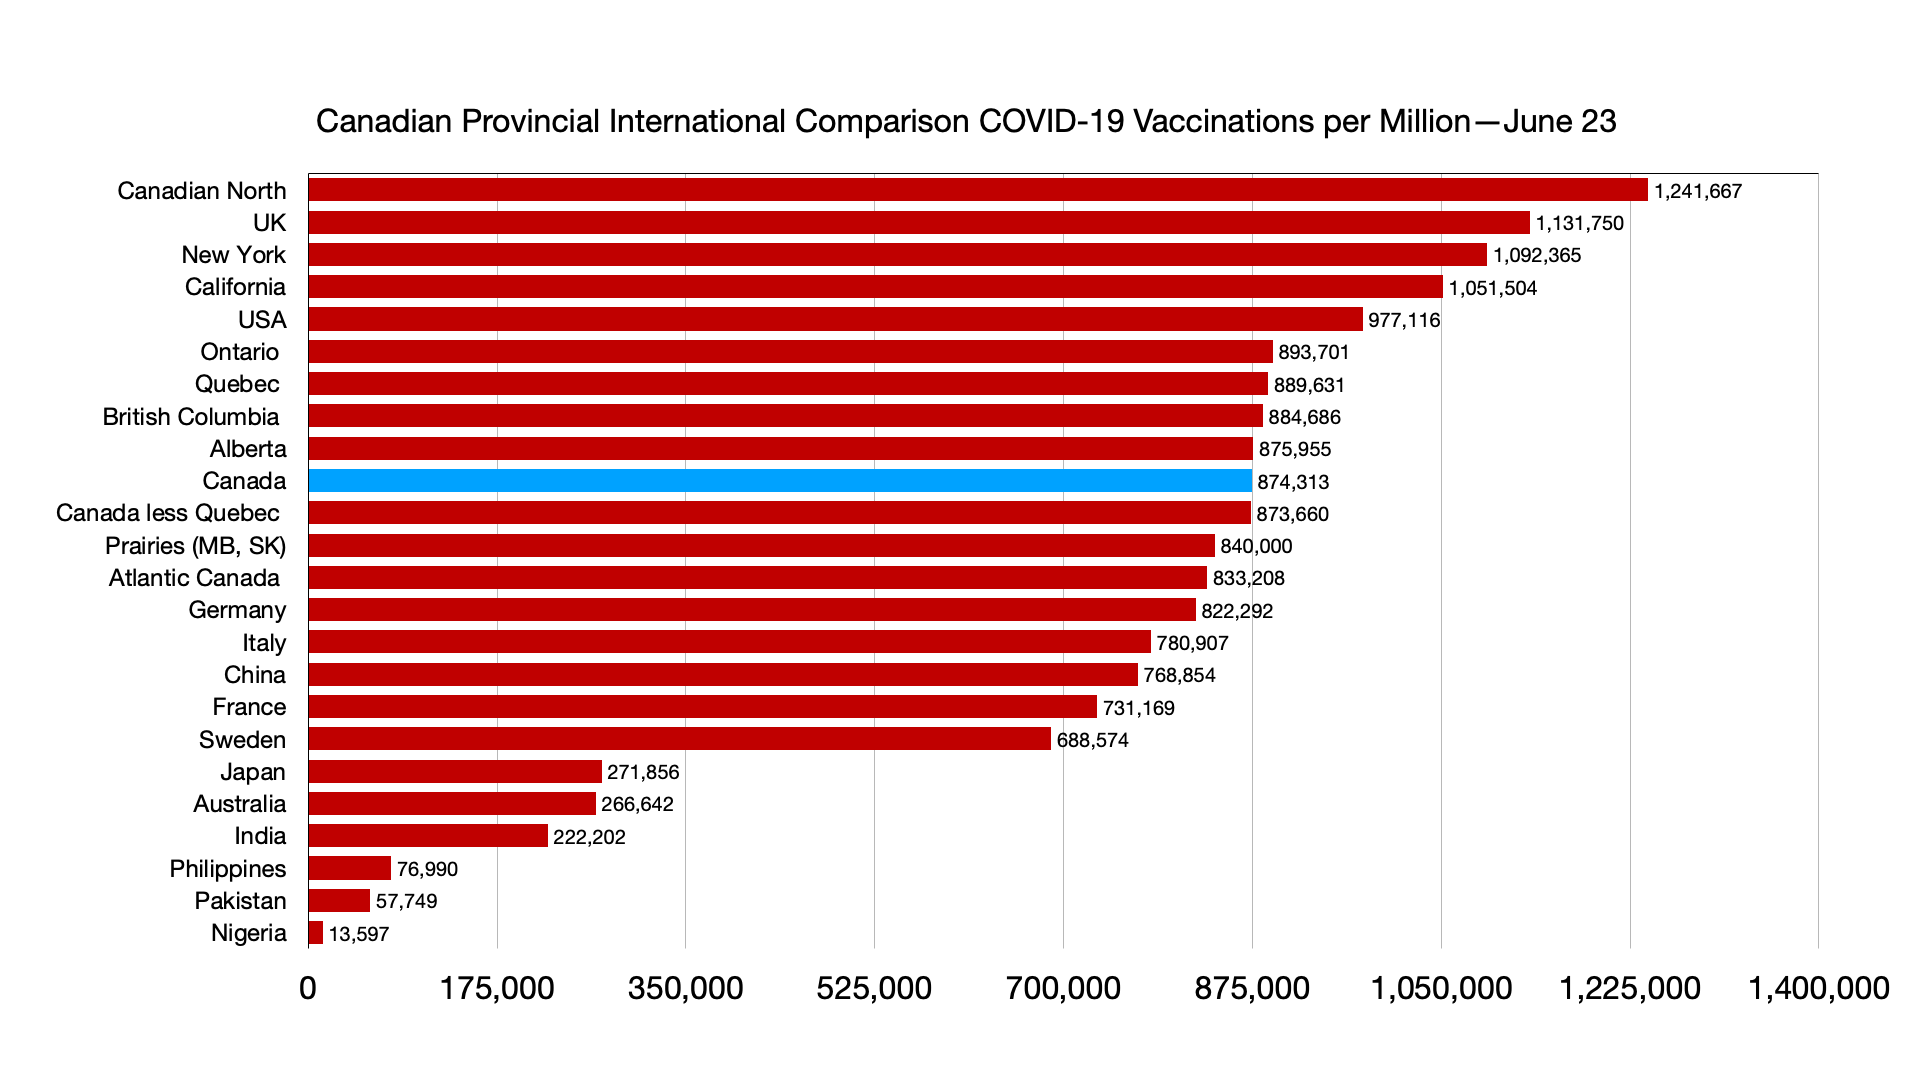
The latest charts, compiled 23 June as overall rates in Canada continue to decline along with increased vaccinations (still largely first dose, fully vaccinated 20.8 percent, most EU countries are between 25 to 35%).

Vaccinations: Minor relative changes with Ontario ahead of Quebec and British Columbia. China’s vaccination rate continues to grow dramatically (about 16% fully vaccinated. Article below charts describes lower efficacy of Chinese-made vaccines.

Trendline charts

Infections per million: No relative changes.

Deaths per million: No relative change.

Vaccinations per million: Canadian vaccination rates continue to exceed G7 less Canada. Vaccination rate increase in immigration source countries driven by China (up 16% from last week) with Indian vaccination rates up 12.5% compared to last week.

Weekly

Infections per million: No relative change.

Deaths per million: No relative changes.

They Relied on Chinese Vaccines. Now They’re Battling Outbreaks

Interesting data on the relative weakness of Chinese vaccines, likely to undermine the Chinese government’s vaccine diplomacy:

Mongolia promised its people a “Covid-free summer.” Bahrain said there would be a “return to normal life.” The tiny island nation of the Seychelles aimed to jump-start its economy.

All three put their faith, at least in part, in easily accessibleChinese-made vaccines, which would allow them to roll out ambitious inoculation programs when much of the world was going without.

But instead of freedom from the coronavirus, all three countries are now battling a surge in infections.

China kicked off its vaccine diplomacy campaign last year by pledging to provide a shot that would be safe and effective at preventing severe cases of Covid-19. Less certain at the time was how successful it and other vaccines would be at curbing transmission.

Now, examples from several countries suggest that the Chinese vaccines may not be very effective at preventing the spread of the virus, particularly the new variants. The experiences of those countries lay bare a harsh reality facing a postpandemic world: The degree of recovery may depend on which vaccines governments give to their people.

In the Seychelles, Chile, Bahrain and Mongolia, 50 to 68 percent of the populations have been fully inoculated, outpacing the United States, according to Our World in Data, a data tracking project. All four ranked among the top 10 countries with the worst Covid outbreaks as recently as last week, according to data from The New York Times. And all four are mostly using shots made by two Chinese vaccine makers, Sinopharm and Sinovac Biotech.

“If the vaccines are sufficiently good, we should not see this pattern,” said Jin Dongyan, a virologist at the University of Hong Kong. “The Chinese have a responsibility to remedy this.”

Scientists don’t know for certain why some countries with relatively high inoculation rates are suffering new outbreaks. Variants, social controls that are eased too quickly and careless behavior after only the first of a two-shot regimen are possibilities. But the breakthrough infections could have lasting consequences.

In the United States, about 45 percent of the population is fully vaccinated, mostly with doses made by Pfizer-BioNTech and Moderna. Cases have dropped 94 percent over six months.

Israel provided shots from Pfizer and has the second-highest vaccination rate in the world, after the Seychelles. The number of new daily confirmed Covid-19 cases per million in Israel is now around 4.95.

In the Seychelles, which relied mostly on Sinopharm, that number is more than 716 cases per million.

Disparities such as these could create a world in which three types of countries emerge from the pandemic — the wealthy nations that used their resources to secure Pfizer-BioNTech and Moderna shots, the poorer countries that are far away from immunizing a majority of citizens, and then those that are fully inoculated but only partly protected.

China, as well as the more than 90 nations that have received the Chinese shots, may end up in the third group, contending with rolling lockdowns, testing and limits on day-to-day life for months or years to come. Economies could remain held back. And as more citizens question the efficacy of Chinese doses, persuading unvaccinated people to line up for shots may also become more difficult.

One month after receiving his second dose of Sinopharm, Otgonjargal Baatar fell ill and tested positive for Covid-19. Mr. Otgonjargal, a 31-year-old miner, spent nine days in a hospital in Ulaanbaatar, the capital of Mongolia. He said he was now questioning the usefulness of the shot.

“People were convinced that if we were vaccinated, the summer will be free of Covid,” he said. “Now it turns out that it’s not true.”

Beijing saw its vaccine diplomacy as an opportunity to emerge from the pandemic as a more influential global power. China’s top leader, Xi Jinping, pledged to deliver a Chinese shot that could be easily stored and transported to millions of people around the world. He called it a “global public good.”

Mongolia was a beneficiary, jumping at the chance to score millions of Sinopharm shots. The small country quickly rolled out an inoculation program and eased restrictions. It has now vaccinated 52 percent of its population. But on Sunday, it recorded 2,400 new infections, a quadrupling from a month before.

In a statement, China’s Foreign Ministry said it did not see a link between the recent outbreaks and its vaccines. It cited the World Health Organization as saying that vaccination rates in certain countries had not reached sufficient levels to prevent outbreaks, and that countries needed to continue to maintain controls.

“Relevant reports and data also show that many countries that use Chinese-made vaccines have expressed that they are safe and reliable, and have played a good role in their epidemic prevention efforts,” the ministry said. China has also emphasized that its vaccines target severe disease rather than transmission.

No vaccine fully prevents transmission, and people can still fall ill after being inoculated, but the relatively low efficacy rates of Chinese shots have been identified as a possible cause of the recent outbreaks.

The Pfizer-BioNTech and Moderna vaccines have efficacy rates of more than 90 percent. A variety of other vaccines — including AstraZeneca and Johnson & Johnson — have efficacy rates of around 70 percent. The Sinopharm vaccine developed with the Beijing Institute of Biological Products has an efficacy rate of 78.1 percent; the Sinovac vaccine has an efficacy rate of 51 percent.

The Chinese companies have not released much clinical data to show how their vaccines work at preventing transmission. On Monday, Shao Yiming, an epidemiologist with the Chinese Center for Disease Control and Prevention, said China needed to fully vaccinate 80 to 85 percent of its population to achieve herd immunity, revising a previous official estimate of 70 percent.

Data on breakthrough infections has not been made available, either, though a Sinovac study out of Chile showed that the vaccine was less effective than those from Pfizer-BioNTech and Moderna at preventing infection among vaccinated individuals.

A representative from Sinopharm hung up the phone when reached for comment. Sinovac did not respond to a request for comment.

William Schaffner, medical director of the National Foundation for Infectious Diseases at Vanderbilt University, said the efficacy rates of Chinese shots could be low enough “to sustain some transmission, as well as create illness of a substantial amount in the highly vaccinated population, even though it keeps people largely out of the hospital.”

Despite the spike in cases, officials in both the Seychelles and Mongolia have defended Sinopharm, saying it is effective in preventing severe cases of the disease.

Batbayar Ochirbat, head researcher of the Scientific Advisory Group for Emergencies at Mongolia’s Ministry of Health, said Mongolia had made the right decision to go with the Chinese-made shot, in part because it had helped keep the mortality rate low in the country. Data from Mongolia showed that the Sinopharm vaccine was actually more protective than the doses developed by AstraZeneca and Sputnik, a Russian vaccine, according to the Health Ministry.

The reason for the surge in Mongolia, Mr. Batbayar said, is that the country reopened too quickly, and many people believed they were protected after only one dose.

“I think you could say Mongolians celebrated too early,” he said. “My advice is the celebrations should start after the full vaccinations, so this is the lesson learned. There was too much confidence.”

Some health officials and scientists are less confident.

Nikolai Petrovsky, a professor at the College of Medicine and Public Health at Flinders University in Australia, said that with all of the evidence, it would be reasonable to assume the Sinopharm vaccine had minimal effect on curbing transmission. A major risk with the Chinese inoculation is that vaccinated people may have few or no symptoms and still spread the virus to others, he said.

“I think that this complexity has been lost on most decision makers around the world.”

In Indonesia, where a new variant is spreading, more than 350 doctors and health care workers recently came down with Covid-19 despite being fully vaccinated with Sinovac, according to the risk mitigation team of the Indonesian Medical Association. Across the country, 61 doctors died between February and June 7. Ten of them had taken the Chinese-made vaccine, the association said.

The numbers were enough to make Kenneth Mak, Singapore’s director of medical services, question the use of Sinovac. “It’s not a problem associated with Pfizer,” Mr. Mak said at a news conferenceon Friday. “This is actually a problem associated with the Sinovac vaccine.”

Bahrain and the United Arab Emirates were the first two countries to approve the Sinopharm shot, even before late-stage clinical trial data was released. Since then, there have been extensive reports of vaccinated people falling ill in both countries. In a statement, the Bahraini government’s media office said the kingdom’s vaccine rollout had been “efficient and successful to date.”

Still, last month officials from Bahrain and the United Arab Emirates announced that they would offer a third booster shot. The choices: Pfizer or more Sinopharm.

Source: https://www.nytimes.com/2021/06/22/business/economy/china-vaccines-covid-outbreak.html?searchResultPosition=1