America’s immigrant voters and the 2024 presidential election

Useful detailed analysis:

…Immigrants are a diverse, growing, and actively engaged voter base

Of the nation’s nearly 46 million total immigrants (about three-fourths of which are U.S. citizens or permanent residents), migrant voters or naturalized citizens, at roughly 24 million, constitute most of the migrant pool and roughly 10% of the total U.S. electorate. Since 1965, when U.S. law expanded voluntary immigration from non-European nations, the migrant cohort has grown significantly. It has increased from about five percent to 13.9% of the U.S. population today and shifted from being predominantly white (80%) and Western to increasingly majority-non-white and less Western. Roughly two-thirds of that growth stems from Latin America and Asia, and to a lesser extent, from other regions including Africa, the Caribbean, North America, and Europe. Stretching across the globe, this rich mosaic of racial and ethnic groups includes Asians, Arabs or Middle Eastern and North Africans (MENA), sub-Saharan Africans, Caribbean groups, Latinos, and white immigrants, and stands in stark contrast to the mostly white, U.S.-born electorate.

At the ballot box, evidence shows that foreign-born voter turnout has typically lagged behind the general electorate, partly due to navigating both the bureaucratic naturalization and voter registration processes. Nonetheless, distinct differences among racial and ethnic subgroups, along with a highly politicized environment, particularly around immigration in recent years, has affected this trend.

Foreign-born Asian and Latino groups vote at higher rates thantheir U.S.-born ethnic counterparts. Black immigrants vote at similar levels while white immigrants participate at lesser rates compared to U.S.-born whites. Yet, in recent years, the foreign-born population appears to be a much more politically engaged cohort, demonstrating above-average levels of voter enthusiasm with turnout exceeding the general electorate. National-level polling conducted between August 16 and August 28, 2024, prior to the election, showed that roughly 97% of naturalized citizens were “definitely or probably going to vote” in the 2024 election. This is above 2020 election levels, where 86.8% of respondents cast their vote, exceeding the nearly 66% of the total electorate—the highest rate since 1900.

In the wake of the pandemic, restrictive immigration and economic and health concerns in Trump’s first term were likely key factors in an atypical 2020 election. Further, in 2024, where many of the same issues were at the forefront, final calculations of voter turnout are likely to be high. Additionally, while migrant voters constitute a small share nationally, they have sizable clout in competitive battlegrounds. For example, 14% of voters in Nevada, seven percent of voters in Georgia and five percent each in Pennsylvania and Michigan are foreign-born. The start of 2024 saw 7.4 million migrants who were likely eligible to naturalize this year and 3.5 million of them have already done so. Their total size tops the margins of victory in virtually all key swing states in the 2020 election, and projected naturalization rates resemble the prior election cycle. For example, in Georgia, the state’s total of 96,469 new citizens surpassed Biden’s roughly 12,000 margin of victory. Mostly comprising foreign-born Asians and Latinos, immigrant participation in this year’s election was expected to be decisive.

Immigrant party affiliation and voter priorities are not uniform

Still, the key issues that drove new American citizens to the voting booth are not uniform. Despite between four in 10 to six in 10 expressing no strong affiliation/not being sure with either party, immigrant voters still lean Democratic across almost all ethnic groups, except for white immigrants who are more evenly split between Democrats and Republicans. Among those who would certainly vote, the polling found they favored Kamala Harris over Trump (by approximately 55% to 41%), both nationally and with some slight variation across key swing states. Similar to the general electorate, high cost of living/inflation ranked as the top issue with immigration following closely behind. Interestingly, on social values issues, foreign-born migrants are almost twice as likely to hold conservative/very conservative views and still identify as a Democrat compared to the overall population. This is further underscored with religious views—overall, immigrant evangelicals identify less with the Republican Party compared to U.S.-born evangelicals and young individuals (ages 18 to 29) are found to be more religious and conservative on social issues than their U.S.-born counterparts.

Linked fate, the idea that policies or issues that affect one’s broader group also impact individuals, could partly suggest why: 60% of respondents believe that what affects immigrants will “strongly or to some extent” affect their own life. In previous generations, European immigrants in the 19th century who were in a pursuit of a better life, were initially dubbed as non-“white” and encountered fierce anti-immigrant rhetoric and policies. Similarly, several generations later, this modern wave of largely immigrants of color, also in pursuit of a better life, is navigating a 21st century assimilation into the American mainstream. In the past decade, Muslim travel bans, the dehumanization of African, Afro-Caribbean, and Latin American groups, anti-Asian hate crimes, and an even more hardline Trump immigration agenda aimed at legal and illegal immigrants have engulfed the political environment. What’s more, many immigrant voters come from mixed status families where one or more members of the household are undocumented while the rest hold legal status—complicating access to resources such as health care and employment. Ultimately, how migrants continue to navigate their foreign identity and new status in support of a political party varies across ethnic lines.

The policy agenda of the immigrant community  

The post-election results on how all immigrant groups voted are still forthcoming, but recent surveys taken just prior to the election and the latest exit polls offer some insights.

Based on a YouGov national survey of the top issues for over roughly 43,000 immigrant voters (conducted between October 25 and October 27), the key differences across the main issues—such as the economy, abortion, immigration, education, and crime—were along gender, age, race, and ideological lines. Men were found to prioritize the economy more highly than women, whereas women ranked abortion more highly than men. However, older voters rank immigration and the economy above higher than younger voters. Similarly, conservative voters, who are likely older, were more likely to rank immigration and the economy as important relative to moderate and liberal voters. Nonetheless, across almost all policy issues and subgroups, U.S.-born voters rated these issues with greater importance than their foreign-born counterparts. Still, by contrast, across all demographic groups, migrant voters ranked crime and education as more salient than the U.S. native-born electorate.

Along racial and ethnic lines, virtually all migrant voters, regardless of political affiliation, ranked the economy and inflation among their top priorities. However, while the economy and the conflict in Gaza were the two top issues respectively among all Arabs, among Arab American Democrats, the conflict in Gaza was ranked as number one. While most Arabs in the U.S. were born here, about 68% of foreign-born Arabs are citizens.

Historically, over the past 15 years, their political support has stood at a two-to-one margin for Democrats. Nevertheless, the humanitarian crisis in Gaza and U.S. support for Israel led to a dramatic reversal—with Trump slightly leading Harris, 42% to 41% in polls ahead of the election, compared to Biden’s 59% to 35% edge in 2020. Additionally, even though expected turnout in the MENA community slipped from 80% to 63%, Michigan for example, where Biden won by 154,000 votes, houses its largest base of voters among all swing states—over 300,000. Further, the recent Democratic primary saw more than 100,000 Michigan primary voters choose “uncommitted” in protest against the administration’s handling of the war, and Arab Americans make up almost half of the populations in the cities where Biden lost to the protest vote. Taking all these factors into account, there were growing signs that Democrat support could be splintered between Trump, a third party, and/or by abstaining—and those indications proved true. The city of Dearborn, an Arab American majority city, saw Trump winning (42.4%), Harris (36.2%), and Jill Stein (18.3%)—a remarkable shift from Biden’s 68.8% to Trump’s 29.9% in the 2020 election. Further, this appears to be somewhat reflected in the latest exit polls—Trump won 60% of Michigan voters that identify as “other race” and 54% of the same cohort nationally.

Asian Americans as a racial subgroup are majority foreign born (67%), lean Democratic (42%), and contain a large number of Independents (31%), compared to the overall electorate. Partly attributable to the fact that they typically experience less campaign outreach, 27% reported not having been contacted by either political party. As a cohort, according to polling conducted in September, 77% of Asian Americans were likely to vote. Overall, they were expected to support Harris by a 38+ margin—largely along gender lines: 70% of Asian women supported Harris while only 57% of Asian men did. Additionally, while almost all ethnic groups trended in this direction, Hawaiian Natives/Pacific Islanders leaned Republican. However, the actual margin turned out to be considerably smaller (15 points in favor of Harris), according to recent election results. Conversely, Since 2020, Trump has made a five-point gain nationally among Asians and, most notably, carried a majority in Nevada (50% to 47%).  Concerns over inflation, health care, and crime, coupled with diverse political views, were likely key driving factors in the broader shift. With roughly 31% of Asian Americans leaning Independent, Trump made a four-point gain with all Independents—in a race where their turnout exceeded Democrats for the first time and was equal to that of Republicans.

Within the Latino base, where migrant voters comprise 25%(as of 2018), Harris secured a majority of all Latino voters (52% to 46%), However, Trump made significant gains—largely driven by the economic anxieties of Latino men. Notching a 10-point advantage with Latino men (54% to 44%), he overcame a roughly 23-point deficit to Biden just four years prior (59% to 36%). Still, while migrants favored Harris (by a seven-point margin) and also favored a path to citizenship for undocumented immigrants (by an eight-point margin), compared to the overall Latino electorate, they still appear to hold somewhat similar views to U.S.-born Latinos. Despite having been subjects of anti-immigrant language by Trump, polling finds that a majority of both U.S.-born (67%) and foreign-born Latino voters (51%) do not feel that the president-elect is referring to them. Surprisingly, this reflects a sharp reversal of what one might expect to see regarding immigrant linked fate within the Latino community. Certain subsets appear to be prioritizing partisanship and other policy issues (largely inflation) above racial and identity politics and immigration, and to be favoring a more conservative agenda. This may partly explain Trump’s relative insulation from promoting racially prejudiced epithets, which has led to inroads with certain swaths of the Latino electorate.

What’s more, this is underscored by the variation seen across country of origin. South American and Central American immigrants are roughly twice as likely as Mexican immigrants to identify with the Republican Party. Even so, there was some expectation that the denigration of Puerto Rico as a “floating island of garbage” by a comedian at the closing Trump campaign rally could be an outlier—having seeped from politics into the cultural mainstream. Drawing swift condemnation from within the campaign, across the political aisle, and by a slew of high-profile Latino celebrities, it went beyond denouncing mostly illegal immigrants to disparaging the very core identity and cultural heritage of an entire territory. Yet, instead of a wider spillover effect among Latinos in favor of Harris, support swung the other way in Trump’s direction—helping to secure above or near-even margins in key states, such as Michigan, Nevada and North Carolina.

Among Black and white immigrants, there is somewhat limited nationally representative data on their voter priorities compared to other demographics. However, evidence suggests that Black immigrants, primarily from the African and Caribbean regions, and roughly 10% of the overall Black population,tend to vote for Democrats, similarly to U.S.-born Blacks. However, Black migrants rank the economy and immigration as more important than native-born Blacks and also rank the economy higher than all other migrant and non-migrant groups—suggesting that Black immigrants and more specifically Black immigrant men may be one of the most economically vulnerable of all the cohorts. The trends in the polls to some extent suggest why. Trump’s relative gains with Blacks overall (currently at roughly 13% support) was mostly driven by disaffected Black men—particularly in Midwest states such as Wisconsin, with large swaths of blue-collar workers now supporting him.Seventy eight percent of Black men supported Harris, compared to 80% for Biden in 2020, Further, an analysis of Black male voters shows that while roughly 11% of U.S.-born Black men voted for Trump in 2020, an even higher number of foreign-born Black men (30%) did so. This reveals how differing socio-cultural experiences formed in one’s home country, distinct from the U.S., and coupled with the challenges of assimilating into a foreign country, can influence voter choice.

On the other hand, white immigrant voters (roughly three percent of the total white electorate as of 2018), in contrast to other racial groups, exhibited more of an even split between the two parties. Still, while they rank immigration and abortionhigher than all other migrant racial cohorts, they rank the economy/inflation and immigration as significantly less important than would U.S.-born white voters. Based on the latest exit polls, there did not appear to be a significant change in the white electorate compared to the previous 2020 election—white men voted at roughly the same levels of support for Trump with a slight softening of support among white women.

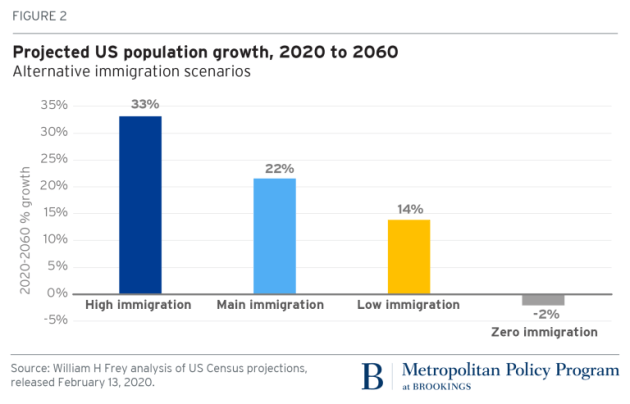
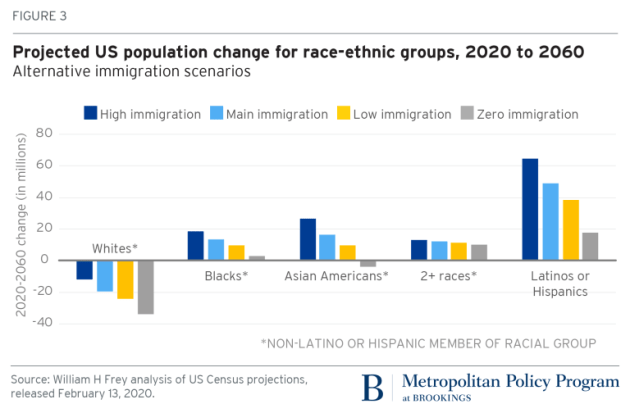
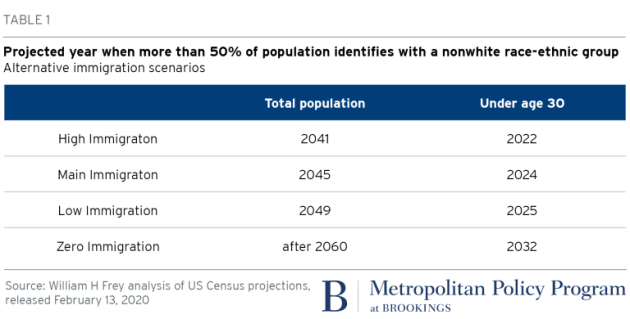
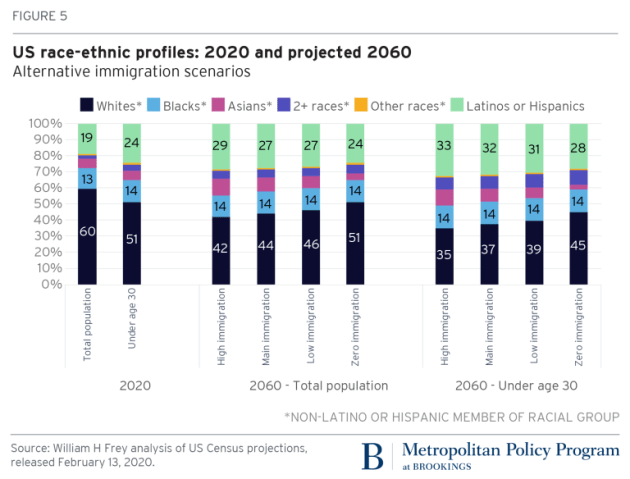
Ultimately, given migrants’ diverse political views and electoral sway in this tight race, both the incoming administration and future campaigns will need to take stock of their concerns. With rising interracial marriages and mixed-race subgroups, not only is international migration estimated to outpace U.S.-born population growth by 2060, but the country is also expected to be majority minority by 2045, more closely resembling its foreign-born makeup of voters. While the president-elect did not secure a majority of migrant voters, he was, with a largely national economic message, able to make significant enough gains within a fractured Democratic coalition. Conversely, the Harris campaign struggled to distance itself from the economic issue saddling the Biden administration, and underperformed among the Democratic base.

Still, despite the deep political rift currently dividing the nation, the country is still inextricably linked to one common shared identity—America is a nation of immigrants, with longer-term descendants of past generations and more recent newcomers. And the majority of its inhabitants continue to pursue the American dream—seeking to make a better life for themselves, their families, and their communities. It is therefore incumbent on the next president to work with Republicans and Democrats to unify the country and enact a set of policies that not only caters to the diverse needs and everyday concerns of the immigrant community across the aisle, but also of the entire country at large. It remains to be seen how this will unfold in the coming weeks, months, and years ahead. But what is certain is that as the country’s racial dynamics continue to evolve, new Americans, like their predecessors from past generations, will continue to play a critical role in U.S. politics for years to come.

Source: America’s immigrant voters and the 2024 presidential election

Life Expectancy Provides Evidence of How Far Black Americans Have Come

Really interesting and nuanced study with regional breakdowns:

In August 2022, the Centers for Disease Control and Prevention reportedthat over the last two years, Black Americans’ life expectancy declined to about 71 years old, six years lower than their white counterparts. National disparities in life expectancy can represent the permanency of racism, offering little reason for hope.

But in Manassas Park, Va. and Weld County, Colo., the mean-life expectancy for Black residents is 96—a national high among all Black citizens by county. Black people are living in their 80s in larger Democratic jurisdictions like Montgomery County, Maryland and smaller Republican districts like Collier County, Florida.
[time-brightcove not-tgx=”true”]

My colleague Jonathan Rothwell and I reported hundreds of places that exceed commonly held expectations in Brookings’s recently released Black Progress Index, an interactive tool and report developed in partnership with the NAACP that provides a means to understand the health and well-being of Black people and the conditions that shape their lives. Instead of comparing Black people to white people, we examine life expectancy differences among the Black population in different places. This method reveals the locales where Black people are thriving.

Courtesy of the Brookings Institution.

Researchers often sloppily compare rates of home ownership, educational attainment, income and mortality without attending to past and present discrimination that intended to create disparities. Consequently, broad national averages void of context policy and local contexts camouflage the very real progress that’s occurring across the country.

Still, in places like Jefferson County, Ohio, the average Black person lives 33 fewer years than Manassas Park, Va. and Weld County, Colo. That gap is roughly equivalent to 100 years of progress in living standards, medical science, and public health.

Black people are not a monolith. They have widely different outcomes in very different places. Local contexts matter as Black people do. Lower life expectancy in counties and metro areas across the country suggests that people are losing battles against racism. But geographic areas where Black people are thriving offer more than hope: People’s civic actions are delivering positive change.

What accounts for such vast differences? Life expectancy, a cumulative measure of health and well-being, summarizes both the biological and non-biological influences on our lives. Because race is a sociological construct and not a biological one, we should assume disparities in life expectancy represent differences in non-biological influences on our lives. Our current life expectancy data suggest that people are breaking down specific social conditions that influence longevity, giving real reason for optimism.

Using a common machine-learning algorithm to select variables and rank their importance, the Index identifies 13 social conditions that predict Black life expectancy. Many are those one might expect, such as income, education, housing, and family composition. Others were more surprising, including the top predictor of high Black life expectancy: larger shares of foreign-born Black residents. One standard deviation above the mean in this variable adds one year to predicted life Black expectancy. For instance, Brooklyn, N.Y. is in the 89th percentile of life expectancy at 78.5. The more than 43% of Black residents of King’s County who are immigrants, places it in the 98th percentile among all counties.

The cause for this interpretation is unclear; it may be a pure composition effect, in that foreign-born Black Americans enjoy better health than the native Black population. Though, this data points to a larger question: Is less exposure to U.S. racism good for your health?

On the other end of the spectrum, a surprising predictor of low Black life expectancy is religious membership. Keeping in mind all the social determinants that showed to be significant in our study are correlational, not causal. Revoking a church membership will not automatically add years to a person’s life. The challenge is understanding why religious adherence is associated with lower life expectancy. Church goers are more likely to be obese and, on the surface, asking “Jesus to take the wheel” may negate any agency we have in influencing our health outcome. We also know that place-based bias that comes out of the wash of housing devaluation hurts the families and institutions, including churches, in those locales. More research is needed to uncover the conditions and behaviors underlying all the variables that strongly influence life expectancy.

The fact that we realize progress and stagnation in Black life expectancy in different places makes clear that people have agency. The gains and losses reflect that. When we take an overly optimistic or pessimistic view of the state of Black America and treat Black people as a monolith, we don’t see localized stories of growth, determination, and thriving.

The diversity of places where Black people are thriving suggests that it has something to do with Black people themselves. In places like Montgomery County, Md., individuals, civil rights groups, organizers, and politicians are dismantling the architecture of inequality that takes away years of life.

That said, we still need to examine and throw away the overly optimistic position on race relations—that the country has moved beyond slavery, Jim Crow racism, and the array of discriminatory policies and their long-term effects. People who hold this perspective contend that America is a level playing field and that with effort, Black people can achieve anything a white person can.

But locales that post life expectancies under 70 perform poorly on environment or institutional indicators like the air and school quality, suggesting that life is harder in some places due to systemically racist forces. In Lowndes County, Ala. where Montgomery is the county seat, Black life expectancy is 68.5. In Greenwood, Miss., it’s 67.3. In Salem, Ore., life expectancy is 64.4.

It’s also worth speculating on seemingly obvious reason why some cities, like Jackson, Miss., don’t post higher rates than 72.6. Jackson has higher homeownership rates than most places (94th percentile) and a higher percentage business ownership (59th percentile). But the recent water crises show how local politics of Mississippi play out in lower investments in the city’s water infrastructure, which plays out in other municipal services that impact life expectancy like education.

“Social reforms move slowly,” wrote W.E.B. Du Bois, suggesting that we must learn from our circumstances in ways that reject intemperance and blame. “[W]hen Right is reinforced by calm but persistent Progress we somehow all feel that in the end it must triumph.”

Society is toiling with the same struggles around racism that Du Bois faced at the turn of the 20th century. Nonetheless, we must take the time to recognize empirical signs of progress and not rush toward unsophisticated, untruthful narratives of hopelessness or blind ignorance that remove or dismiss our agency. A path of progress demands that we have a clear view of the social, political, and economic landscape in which we live. Recognizing progress and defeats will have us see the very real capacity for future change. The assumption—backed with data—that Black people in places with higher life expectancy had a hand in their outcomes should inspire us to seek change in places where discrimination is robbing people of years of life

Source: Life Expectancy Provides Evidence of How Far Black Americans Have Come

USA: Do immigrants harm native students academically?

Interesting debunking:

Over the past 50 years, the United States has experienced the second-largest wave of immigration in its history. As a result, the share of recent immigrants (either foreign-born or children of foreign-born) in public schools reached 23% in 2015, with concentrations over 70% in several school districts in high-immigration states. These trends have generated a policy debate about the effects of immigration on public education and the perceived costs that immigrants may impose on public schools, local governments, and educational outcomes of the U.S.-born student population.

Better understanding the causal effects of immigrants on native students is therefore critical to inform these policy debates, yet there are two factors that complicate any effort to reveal this link. First, immigrant students are not randomly assigned to schools, and are more likely to enroll in schools educating students from disadvantaged backgrounds. Second, U.S.-born students, especially those from comparatively affluent families, may decide to leave when a large share of immigrant students move into their school district—a phenomenon commonly referred to as “native flight.” Both factors imply that simple correlations between immigrant exposure and native student outcomes will likely yield a more negative relationship than the true causal effect of immigrant exposure.

In a recent paper, we show how immigrant exposure affects the academic achievement of U.S.-born students. We do this with an analytical strategy that addresses both concerns above. We make use of rich, longitudinal education and health microdata from Florida. These data are exceptionally detailed. For example, they identify students’ siblings in school records, which enables us to use the within-family, across-sibling variation in immigrant exposure to study the effects of immigrants. In other words, we can compare the learning of U.S.-born siblings when one of those siblings happened to have more immigrants in their school cohort than the other sibling(s).

Figure 1, illustrating our main result, shows the relationship between immigrant exposure and native student math scores, and how this relationship changes when one accounts for native flight. We present the results for all U.S.-born students (black bars), along with the results for white (green bars) and Black students (blue bars) to demonstrate the effects for different student groups.

Estimated Effects of Immigrant Exposure on U.S.-Born Student Math Scores: Overall and by Race

The results on the left of the figure are from a common model that accounts for the non-random sorting of immigrants (by comparing U.S.-born students with their peers in the same school), yet does not address native flight. (That is, we compare the academic performance of native students with their peers in the same school who have different levels of exposure to immigrants because they are enrolled in different grades.) On the right of the figure, we present the results from our preferred model where we rely on sibling comparisons. Several findings are worth highlighting.

First, when we move from our baseline model to sibling comparisons that account for native flight, we see that the relationship between immigrant exposure and U.S.-born student test scores changes from negative to positive.

Second, we find that this trend is entirely driven by students from more advantaged backgrounds. For example, for white students, we find a negative relationship between immigrant exposure and math achievement in models that fail to account for native flight compared to a sizable positive relationship in our preferred model. In contrast, for Black students, the positive effect of immigrant exposure remains virtually unchanged between the two models. This is consistent with the expectation that native flight is a bigger issue when examining the effects of immigrants on students from more advantaged backgrounds who can afford alternative schooling options in the wake of an immigrant influx.

In summary, we find no adverse effects of immigrant students on the academic achievement of U.S.-born students. This is true even when the immigrants’ academic achievement is lower than the U.S.-born students. In fact, we find significant benefits of having immigrant peers on the test scores of native students, especially among students from disadvantaged backgrounds.

This does not necessarily mean that immigrant students do not require public resources initially as they acquire English proficiency and get accustomed to the school system and life in a new country, which could have adverse effects on native students in the short-term—especially in the aftermath of large migrant inflows. That said, our findings suggest that, in the long run, the benefits of exposure to recent-immigrant peers, who are typically higher performing academically and have higher educational aspirationscompared to more established immigrant generations, likely outweigh these potential short-term adverse effects.

Source: Do immigrants harm native students academically?

Reducing immigration will not stop America’s rising diversity, Census projections show

Good long analysis:

Immigration has become a dominant issue in America, as the Trump administration continues to curtail the flow of both legal and undocumented immigrants. Now, newly released Census Bureau population projections through the year 2060 provide an assessment of what differing levels of immigration would mean for the nation’s demographic future. These are the first projections in more than a decade that lay out how changing immigration flows would impact the nation’s future population size, its race-ethnic makeup, and its age structure.

The projections show that the current level of immigration is essential for our nation’s future growth, especially in sustaining the younger population. Moreover, despite suggestions to the contrary from the administration, lowering immigration levels further will not keep the nation from becoming more racially and ethnically diverse. Even if the number of migrants was reduced to zero, the percentage of the population that identifies as a nonwhite race or ethnic group would continue to rise.

IMMIGRATION IS ESSENTIAL TO COUNTER SHARP DECLINES IN GROWTH

Just how much do different immigration levels affect future U.S. population growth? The new census projections through 2060 provide four scenarios about immigration [1]. The one used in existing census projections is termed the “main” scenario, and assumes that immigration to the U.S. will follow the trends seen from 2011 to 2015. The other three scenarios are: 1) a “high immigration” scenario, which assumes a 50% increase in immigration going forward; 2) a “low immigration” scenario, which assumes a roughly 50% decrease; and 3) a “zero immigration” scenario, which assumes no new immigration to the U.S., but does allow for out-migration from the country.

The projected populations over the 40-year period between 2020 and 2060 indicate a wide range of outcomes. The “main” immigration scenario would lead to population growth of 22%, from 333 million to 404 million. This is less than half of the 46% growth observed over the previous 40-year period, and reflects the fact that—compared to the past—the nation’s aging population will be experiencing higher death rates and more modest fertility rates.

Fig1

Fig2

The results of the three alternative scenarios are varied. The 2060 U.S. population size in the high-, low-, and zero-immigration scenarios is 447 million, 376 million and 320 million, respectively—representing growth rates of 33%, 14%, and -2%. In the zero-immigration scenario, the population begins to decline in 2035 due to a combination of more deaths than births and that emigration from the U.S. would not be countered by immigration into it.

Zero immigration would be demographically unsustainable and unlikely to occur. However, even the low-immigration scenario would lead to tepid population growth rates—in the range of 0.2% to 0.3%—over the final 20 years of the projection period.

DIVERSITY WILL RISE UNDER ALL IMMIGRATION SCENARIOS

Much of the current political discourse equates immigration with a rise in racial and ethnic diversity. While it is true that a large share of immigrants are people of color (especially those arriving from Latin America, Asia, and Africa), the new projections show that the U.S. will continue to become more racially diverse under all migration scenarios, even with zero additional immigration.

A major reason for this is the aging and projected decline of the population of whites who do not identify with another race or ethnic group. In 2018, the median age of this population was 44, compared to 38 for the nation as a whole, 29.5 for the Latino or Hispanic population, and 21 for those of two or more races. With a rising number of deaths compared to births, the older white population will experience a natural decrease in all projection scenarios, which immigration flows will not counter.

Fig3

The other race-ethnic groups will show mostly positive population contributions over each projection scenario. The largest will occur for the Latino or Hispanic population, which will increase between 18 million and 64 million over the 40-year period, depending on the scenario. Births from existing Latino or Hispanic residents will lead to a natural increase in this population even under low- and zero-migration scenarios.

All other race and ethnic groups contribute to projected population gains with the exception of Asian Americans, whose size is reduced under the zero-immigration scenario. In this case, Asian emigration from the U.S. is not countered by a natural increase. It is noteworthy that in both the low- and zero-immigration scenarios, persons identifying with two or more racial groups contribute more to projected population gains than Black or Asian American residents.

No matter the scenario, the U.S. will experience a rise in the share of the total population that identifies as a nonwhite race or ethnic group.

Fig4

Table 1

Fig5

As previously reported, the “main” immigration scenario shows that in 2045, more than 50% of the U.S. population will identify as a nonwhite race or ethnic group, rising to 56% in 2060. In the high-immigration scenario, the 50% tipping point occurs in 2041; in the low-immigration scenario, it is 2049. Even in the zero-immigration scenario, the share of the U.S. population that identifies as a nonwhite race or ethnic group will rise to 49% by 2060.

Because all nonwhite race and ethnic groups are, on average, younger than white residents, their shares of the under-30 population are even larger than for the population as a whole. More than half of the under-30 population is projected to identify with a nonwhite group by the year 2024 in the main immigration scenario; in 2022 for the high-immigration scenario; and in 2025 for the low-immigration scenario. In the zero-immigration scenario, the share of the under-30 population that identifies as a nonwhite race or ethnic group exceeds 50% in 2032 and all years thereafter.

While shrinking in size, the white population is projected to comprise a larger share of the total population than any other single racial or ethnic group in all scenarios. The next largest group in all projections is the Latino or Hispanic population, which is projected to comprise around a quarter of the total population and roughly 30% of the under-30 population by 2060. 

IMMIGRATION IS NEEDED TO BOLSTER YOUNGER POPULATION GROWTH

The aging of the U.S. population over the next decade will be propelled by the large baby boomer generation entering its senior years. Meanwhile, the younger population will be growing far more tepidly. This aging will be especially acute over the 2020 to 2035 period—as a result, immigration will make an important difference in how much the nation’s youth (under-18) and primary labor force (ages 18 to 64) populations grow.

Fig5

Under the high-immigration scenario, the youth population would grow by 9% and the labor force population would grow by 8% from 2020 to 2035. Both populations would grow by a modest 4% if current immigration patterns persist. A low- or zero-immigration scenario, however, would lead to stagnating growth or declines for these populations, while the 65-and-older population experiences a projected growth rate exceeding 36%.

The short-term implications of lower immigration levels could lead to noticeable labor force shortages. The longer-term impact is increased age dependency: the extent to which the retirement-age population will be dependent on younger workers for support. In 2020, the old-age dependency ratio (a measure of age dependency found by dividing 65-and-older population by the 18- to 64-year-old population) is 28. But as the population ages over the next 40 years, and age dependency rises, immigration will make a difference. In 2060, the dependency ratio can vary from 39 (under the high-immigration scenario) to a whopping 48 under the zero-immigration scenario. The latter would mean there would be only two working-age persons for every retiree.

THE NECESSITY OF IMMIGRATION TO THE NATION’S FUTURE

The Census Bureau’s alternative population projections make plain that continued immigration at current levels—at a minimum—is necessary to maintain the nation’s growth. With a rapidly aging native-born population, immigration will ensure growth—especially among the youth and labor force populations. Any appreciable lowering of immigration levels will lead to tepid national population growth, potentially negative growth in the youth population, and extreme age dependency.

It is also important to note that the nation will continue to become more racially and ethnically diverse under all immigration scenarios. This is a function of the country’s already large and youthful nonwhite populations, and the projected aging and decreased size of the white population.

Any political rhetoric suggesting that reduced immigration will make the nation “whiter” flies in the face of demographic evidence. In fact, the main reason the United States is growing more rapidly than most other industrialized counties stems from its healthy immigration levels over the past four decades. The Census Bureau’s projections suggest that similar or higher immigration levels will be necessary for the nation to grow and prosper in the decades ahead.

Source: Reducing immigration will not stop America’s rising diversity, Census projections show

The robot revolution will be worse for men

Interesting long read and analysis:

Demographics will determine who gets hit worst by automation. Policy will help curb the damage.

The robots will someday take our jobs. But not all our jobs, and we don’t really know how many. Nor do we understand which jobs will be eliminated and which will be transitioned into what some say will be better, less tedious work.

What we do know is that automation and artificial intelligence will affect Americans unevenly, according to data from McKinsey and the 2016 US Census that was analyzed by the Brookings think tank.

Young people — especially those in rural areas or who are underrepresented minorities — will have a greater likelihood of having their jobs replaced by automation. Meanwhile, older, more educated white people living in big cities are more likely to maintain their coveted positions, either because their jobs are irreplaceable or because they’re needed in new jobs alongside our robot overlords.

The Brookings study also warns that automation will exacerbate existing social inequalities along certain geographic and demographic lines, because it will likely eliminate many lower- and middle-skill jobs considered stepping stones to more advanced careers. These jobs losses will be in concentrated in rural areas, particularly the swath of America between the coasts.

However, at least in the case of gender, it’s the men, for once, who will be getting the short end of the stick. Jobs traditionally held by men have a higher “average automation potential” than those held by women, meaning that a greater share of those tasks could be automated with current technology, according to Brookings. That’s because the occupations men are more likely to hold tend to be more manual and more easily replaced by machines and artificial intelligence.

Of course, the real point here is that people of all stripes face employment disruption as new technologies are able to do many of our tasks faster, more efficiently, and more precisely than mere mortals. The implications of this unemployment upheaval are far-reaching and raise many questions: How will people transition to the jobs of the future? What will those jobs be? Is it possible to mitigate the polarizing effects automation will have on our already-stratified society of haves and have-nots?

A recent McKinsey report estimated that by 2030, up to one-third of work activities could be displaced by automation, meaning a large portion of the populace will have to make changes in how they work and support themselves.

“This anger we see among many people across our country feeling like they’re being left behind from the American dream, this report highlights that many of these same people are in the crosshairs of the impact of automation,” said Alastair Fitzpayne, executive director of the Future of Work Initiative at the Aspen Institute.

“Without policy intervention, the problems we see in our economy in terms of wage stagnation, labor participation, alarming levels of growth in low-wage jobs — those problems are likely to get worse, not better,” Fitzpayne told Recode. “Tech has a history that isn’t only negative if you look over the last 150 years. It can improve economic growth, it can create new jobs, it can boost people’s incomes, but you have to make sure the mechanisms are in place for that growth to be inclusive.”

Before we look at potential solutions, here are six charts that break down which groups are going to be affected most by the oncoming automation — and which have a better chance of surviving the robot apocalypse:

Occupation

The type of job you have largely affects your likelihood of being replaced by a machine. Jobs that require precision and repetition — food prep and manufacturing, for example — can be automated much more easily. Jobs that require creativity and critical thinking, like analysts and teachers, can’t as easily be recreated by machines. You can drill down further into which jobs fall under each job type here.

Education

People’s level of education greatly affects the types of work they are eligible for, so education and occupation are closely linked. Less education will more likely land a person in a more automatable job, while more education means more job options.

Age

Younger people are less likely to have attained higher degrees than older people; they’re also more likely to be in entry-level jobs that don’t require as much variation or decision-making as they might have later in life. Therefore, young people are more likely to be employed in occupations that are at risk of automation.

Race

The robot revolution will also increase racial inequality, as underrepresented minorities are more likely to hold jobs with tasks that could be automated — like food service, office administration, and agriculture.

Gender

Men, who have always been more likely to have better jobs and pay than women, also might be the first to have their jobs usurped. That’s because men tend to over-index in production, transportation, and construction jobs — all occupational groups that have tasks with above-average automation exposure. Women, meanwhile, are overrepresented in occupations related to human interaction, like health care and education — jobs that largely require human labor. Women are also now more likely to attain higher education degrees than men, meaning their jobs could be somewhat safer from being usurped by automation.

Location

Heartland states and rural areas — places that have large shares of employment in routine-intensive occupations like those found in the manufacturing, transportation, and extraction industries — contain a disproportionate share of occupations whose tasks are highly automatable. Small metro areas are also highly susceptible to job automation, though places with universities tend to be an exception. Cities — especially ones that are tech-focused and contain a highly educated populace, like New York; San Jose, California; and Chapel Hill, North Carolina — have the lowest automation potential of all.

See how your county could fare on the map below — the darker purple colors represent higher potential for automation:

Note that in none of the charts above are the percentages of tasks that could be automated very small — in most cases, the Brookings study estimates, at least 20 percent of any given demographic will see changes to their tasks due to automation. Of course, none of this means the end of work for any one group, but rather a transition in the way we work that won’t be felt equally.

“The fact that some of the groups struggling most now are among the groups that may face most challenges is a sobering thought,” said Mark Muro, a senior fellow at Brookings’s Metropolitan Policy Program.

In the worst-case scenario, automation will cause unemployment in the US to soar and exacerbate existing social divides. Depending on the estimate, anywhere from 3 million to 80 million people in the US could lose their jobs, so the implications could be dire.

“The Mad Max thing is possible, maybe not here but the impact on developing countries could be a lot worse as there was less stability to begin with,” said Martin Ford, author of Rise of the Robots and Architects of Intelligence. “Ultimately, it depends on the choices we make, what we do, how we can adapt.”

Fortunately, there are a number of potential solutions. The Brookings study and others lay out ways to mitigate job loss, and maybe even make the jobs of the future better and more attainable. The hardest part will be getting the government and private sector to agree on and pay for them. The Brookings policy recommendations include:

  • Create a universal adjustment benefit to laid-off workers. This involves offering career counseling, education, and training in new, relevant skills, and giving displaced workers financial support while they work on getting a new job. But as we know from the first manufacturing revolution, it’s difficult if not impossible to get government and corporations on board with aiding and reeducating displaced low-skilled workers. Indeed, many cities across the Rust Belt have yet to recover from the automation of car and steel plants in the last century. Government universal adjustment programs, which vary in cost based on their size and scope, provide a template but have had their own failings. Some suggest a carbon taxcould be a way to create billions of dollars in revenue for universal benefits or even universal basic income. Additionally, taxing income as opposed to labor — which could become scarcer with automation — provides other ways to fund universal benefits.
  • Maintain a full-employment economy. A focus on creating new jobs through subsidized employment programs will help create jobs for all who want them. Being employed will cushion some of the blow associated with transitioning jobs. Progressive Democrats’ proposed Green New Deal, which would create jobs geared toward lessening the United States’ dependence on fossil fuels, could be one way of getting to full employment. Brookings also recommends a federal monetary policy that prioritizes full employment over fighting inflation — a feasible action, but one that would require a meaningful change to the fed’s longstanding priorities.
  • Introduce portable benefits programs. This would give workers access to traditional employment benefits like health care, regardless of if or where they’re employed. If people are taken care of in the meantime, some of the stress of transitioning to new jobs would be lessened. These benefits also allow the possibility of part-time jobs or gig work — something that has lately become more of a necessity for many Americans. Currently, half of Americans get their health care through their jobs, and doctors and politicians have historically fought against government-run systems. The concept of portable benefits has recently been popular among freelance unions as well as among contract workers employed in gig economy jobs like Uber.
  • Pay special attention to communities that are hardest-hit. As we know from the charts above, some parts of America will have it way worse than others. But there are already a number of programs in place that provide regional protection for at-risk communities that could be expanded upon to deal with disruption from automation. The Department of Defense already does this on a smaller scale, with programs to help communities adjust after base closures or other program cancellations. Automation aid efforts would provide a variety of support, including grants and project management, as well as funding to convert facilities into new uses. Additionally, “Opportunity Zones” in the tax code — popular among the tech set — give companies tax breaks for investing in low-income areas. These investments in turn create jobs and stimulate spending in areas where it’s most needed.
  • Increased investment in AI, automation, and related technology. This may seem counterintuitive, seeing as automation is causing many of these problems in the first place, but Brookings believes that embracing this new tech — not erecting barriers to the inevitable — will generate the economic productivity needed to increase both standards of living and jobs outside of those that will be automated. “We are not vilifying these technologies; we are calling attention to positive side effects,” Brookings’s Muro said. “These technologies will be integral in boosting American productivity, which is dragging.”

None of these solutions, of course, is a silver bullet, but in conjunction, they could help mitigate some of the pain Americans will face from increased automation — if we act soon. Additionally, many of these ideas currently seem rather progressive, so they could be difficult to implement in a Republican-led government.

“I’m a long-run optimist. I think we will work it out. We have to — we have no choice,” Ford told Recode, emphasizing that humanity also stands to gain huge benefits from using AI and robotics to solve our biggest problems, like climate change and disease.

“The short term, though, could be tough — I worry about our ability to react in that time frame,” Ford said, especial given the current political climate. “But there comes a point when the cost of not adapting exceeds the cost of change.”

Source: The robot revolution will be worse for men

Islamic religious education in Europe and the United States | Brookings Institution

From the Brookings Institute, an interesting comparative study on Publicly Funded Islamic Education in Europe and the United States:

In Germany and Austria, many public schools teach Islam to Muslims as a subject within a broader religious curriculum in which parents can choose their students’ religious courses. In the United Kingdom and Sweden, public schools teach Islam as an academic subject, and train teachers through comparative religious studies departments in universities. French and U.S. public schools do not teach religion, although students can lean about Islam in subjects such as art, history, or literature.

Despite the diversity of these approaches, Berglund notes three good practices that apply across the board:

  • Establishing rigorous academic standards of training for teachers of religious education courses.
  • Providing factual textbooks informed by academic scholarship, both for Islamic religious education and non-confessional school subjects that teach about Islam.
  • Building upon current curricular and pedagological best practices through international exchange and dialogue of scholars.

By adopting these practices, Berglund argues, governments can further their citizens’ knowledge of important aspects of the human experience and promote inclusive citizenship and respect.

Islamic religious education in Europe and the United States | Brookings Institution.