Environics Institute: Do students with immigrant backgrounds in Canada do as well in educational achievement as non-immigrants students?
2015/11/26 Leave a comment
 Good study from the Environics Institute on education outcomes. Excerpt from Chapter 8, immigrant backgrounds:
Yes; Canada is one of only a very few countries that combines overall high achievement, a larger than average immigrant population, and no significant achievement gap between immigrants and non-immigrants.
One of the main reasons that explains Canada’s good overall performance in education is that it is successful in ensuring the educational achievement of children with immigrant backgrounds. Given the comparatively large proportion of students in Canadian schools, colleges and universities that are first and second generation immigrants, the country simply could not post high overall achievements scores if there was a significant gap between these students and non-immigrants.
The PIRLS study of Grade Four students does not report data regarding immigrant students, but does examine results for those who did not speak the language of the test prior to starting school (in Canada, this would be those whose spoke a language other than English or French). While internationally the average gap between students who did and did not speak the language of the test prior to starting school was 37 points, Hong Kong, Australia and Canada all had gaps of 5 points or less (and in each case, the gap was not statistically significant). This demonstrates the ability of schools in high immigration countries such as Australia and Canada to quickly integrate students from immigrant families in the early years of schooling.
There is extensive data from PISA regarding students with immigrant backgrounds. The proportion of students with immigrant backgrounds in Canada is much higher than average, and indeed higher than in almost all other OECD countries.

- 29 percent of Canadian 15-year old students have an immigrant background (meaning they are either first or second generation immigrants), compared to the OECD average of 11 percent. Among OECD countries, only Luxembourg (46 percent) has a higher proportion. New Zealand (26 percent), Switzerland (24 percent), Australia (23 percent), and the US (22 percent) are the other OECD countries where the proportion of students with immigrant backgrounds is greater that one in five.
- 13 percent of Canadians students are first-generation immigrants, compared with the OECD average of 5 percent. Among OECD countries, only Luxembourg and New Zealand (17 percent each) have a higher proportion.
- Among OECD countries, Canada (14 percent) has the second highest proportion of students who have an immigrant background (first or second generation) and who speak a language at home that is different from the language of the PISA assessment, after Luxembourg (32 percent). The average for the OECD is 6 percent.There is no significant gap between the academic achievement of immigrant (first and second generation) and non-immigrant students in Canada, as measured by PISA 2012 (mean math scores).
- The two point gap in favour of non-immigrant students in Canada is not statistically significant, and compares with an average gap for all OECD countries of 34 points. New Zealand and Ireland resemble Canada in having no gap between immigrant and non-immigrant students, while in Australia there is a significant gap in favour of immigrant students.
- There is also no noticeable gap between students in Canada who are first-generation immigrants and non-immigrant students (in fact, the former group has a slight 6 point edge).
- Similarly, students in Canada who have both an immigrant background (first or second generation) and who speak a language at home that is different from the language of the PISA assessment perform about as well as non-immigrants with the same language as the assessment (again, the former group has a slight 7 point edge).In fact, Canada is one of only a few OECD countries that combine a number of important attributes: high overall performance, a high proportion of students from immigrant families, and a low or non-existent performance gap between immigrants and non-immigrants. This is illustrated in Table 6.37
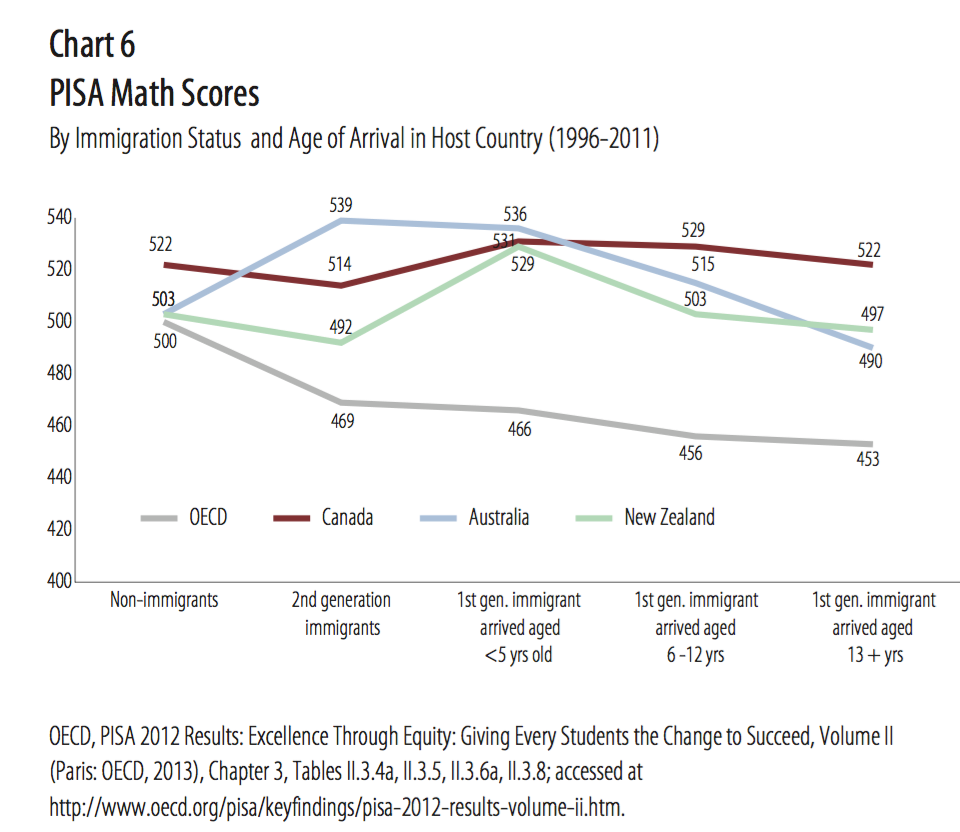
Canada’s success in this area is also evident by the fact that even those first generation immigrant students who arrived in Canada after age 12 perform relatively well: in fact, the PISA math scores for this group are no different than those of non-immigrant students. As Chart 6 illustrates, there is no significant drop-off in scores for immigrants students based on how long they have been in the country, in marked contrast to the international average.
Immigrants in Canada have also been successful in postsecondary education.
- Of course, data on educational attainment for first- generation immigrants generally reflects the educational backgrounds that immigrants had before arriving in Canada rather than their education experience in this country (immigrants to Canada on the whole are more likely to have a university degree than domestically born Canadians).
- The experience of second generation immigrants is more revealing. 84 percent of second generation immigrants in Canada enroll in a postsecondary education course by the age of 21, including 54 percent who pursue a university degree, compared with 72 percent for non-immigrants (38 percent for university).
- Not all immigrant groups are equally successful, however. While over 80 percent of second generation immigrants whose parents came from Africa or China pursue university studies by the age of 21, only 36 percent of those from central and southern America and the Caribbean do.

