Settlement Services: 2024 data
2025/05/22 Leave a comment
For some reason, IRCC does not regularly publish use of settlement services on open data and thus I submit annual requests. The following slides contrast 2024 with previous years by service, region and province.
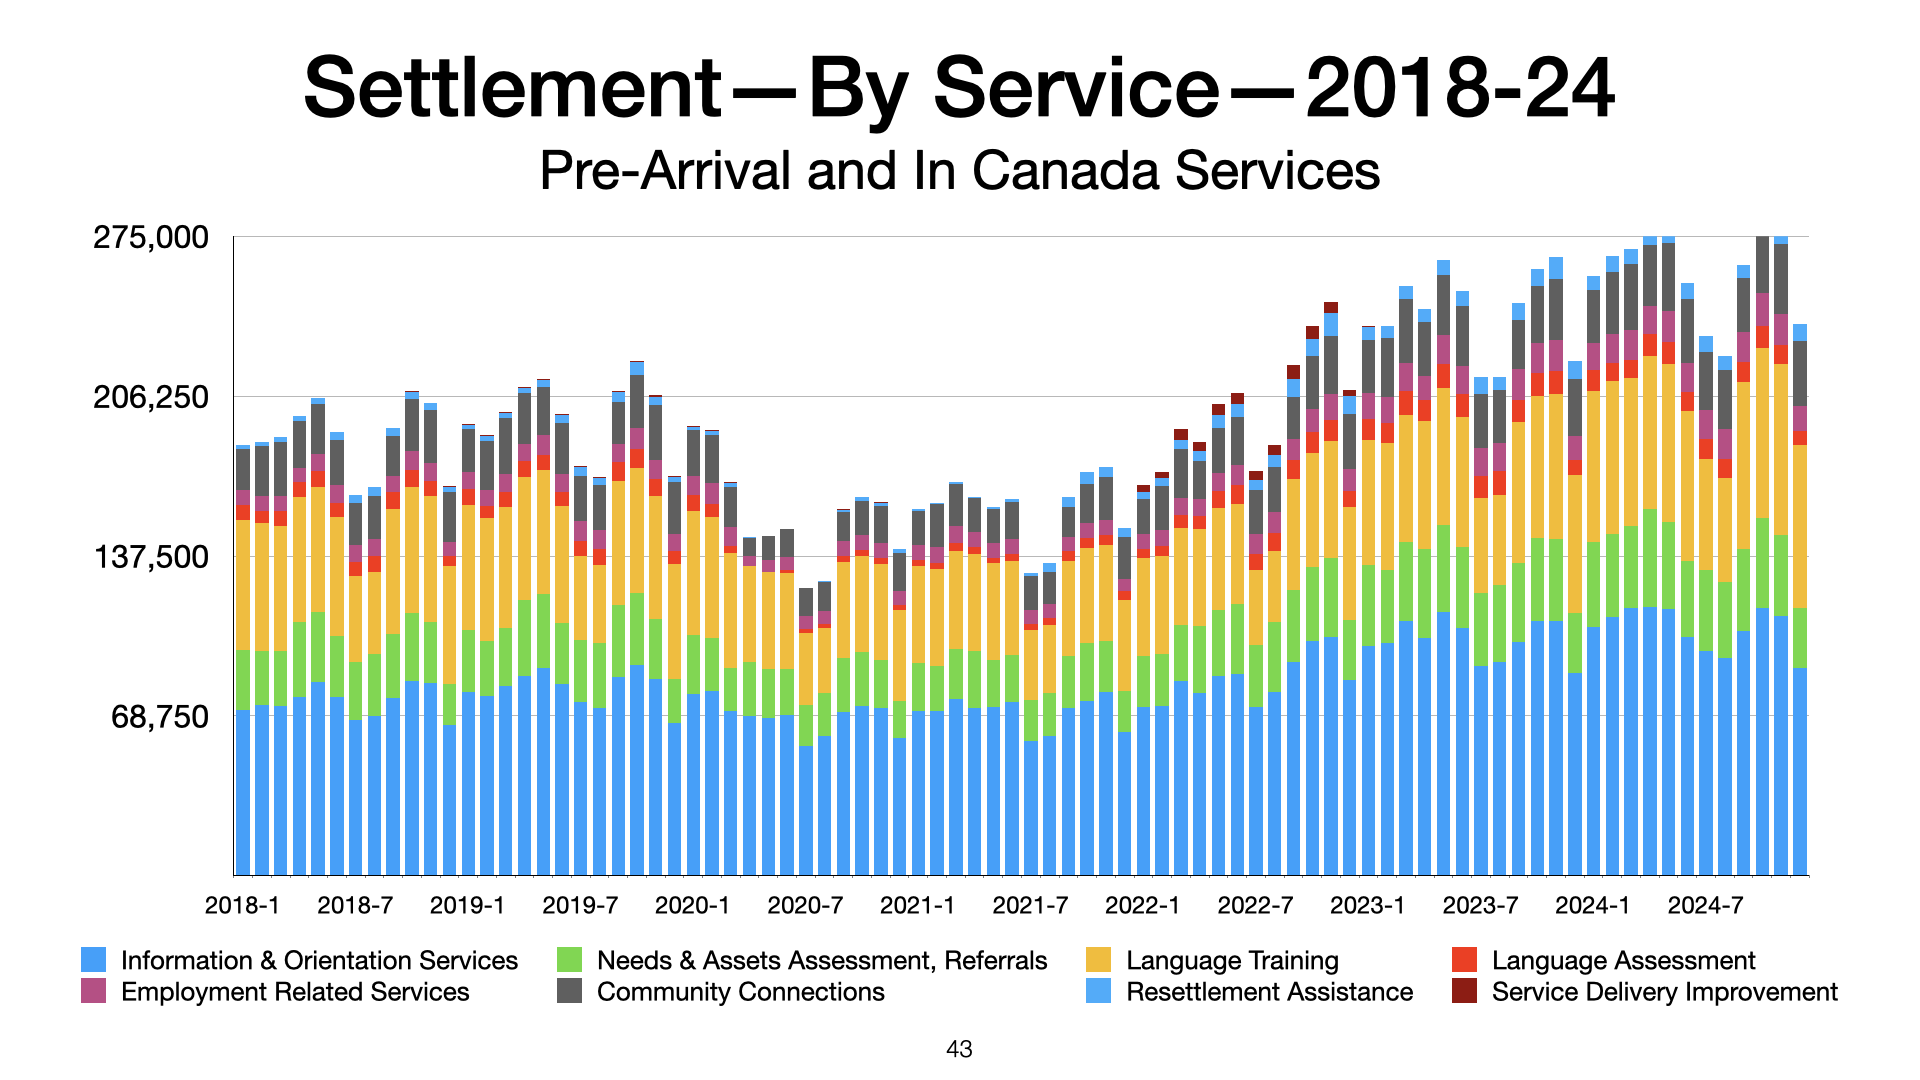
Starting with monthly data, the first chart shows the pandemic dip has been completely eclipsed by post pandemic growth:
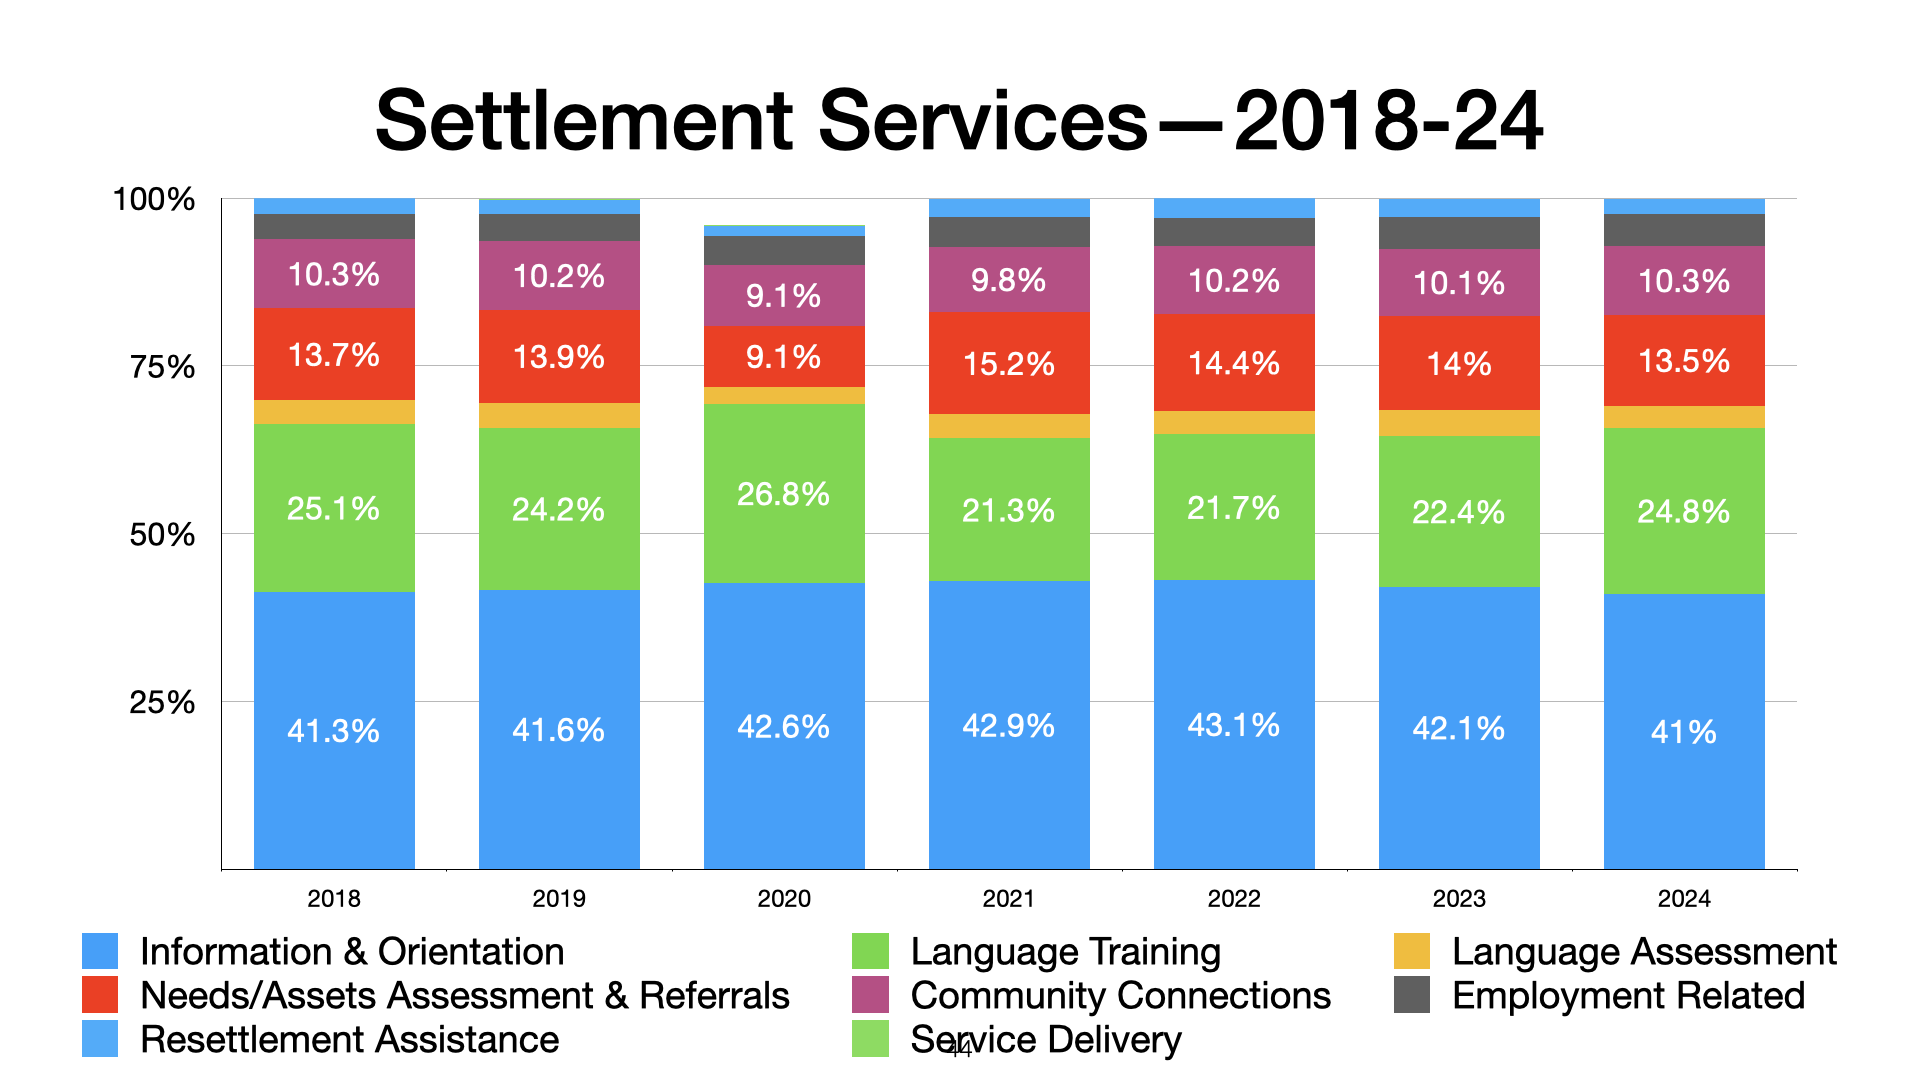
The next chart shows how the proportion of different services has remained relatively constant:
The regional breakdown highlights the sharp increase in settlement services to Europe, driven entirely by those from Ukraine:

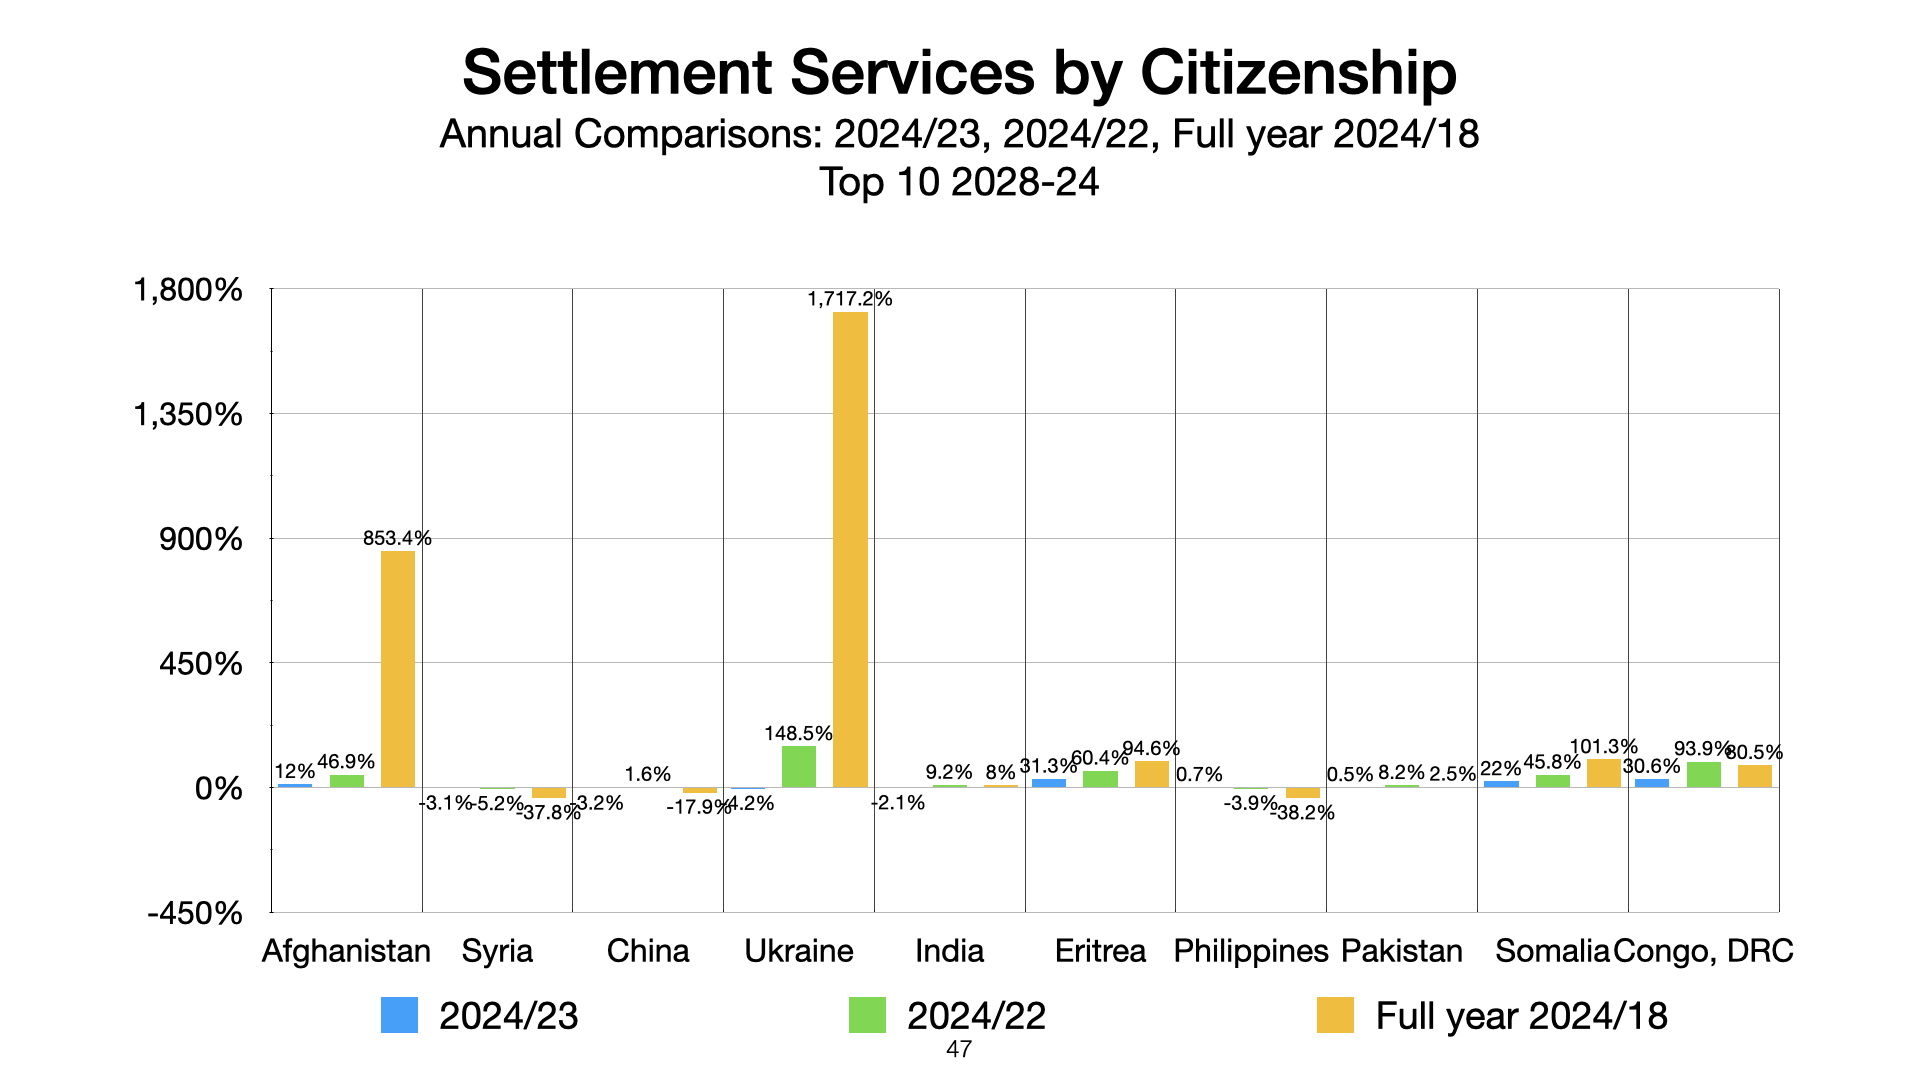
The country view shows not unsurprisingly that it has been Ukraine and Afghanistan where growth has been greatest:
Lastly, usage by province, comparing recent and overall period changes, with Atlantic Canada and Ontario having the largest increase since 2018 (most Quebec settlement services are delivered by the province, not the federal government so hard to compare trends):


