USA: Here’s the economic impact of immigration in each state in 2018
2018/02/01 Leave a comment
Nice map which has some overlaps with support for immigration (e.g West and East Coast) and opposition to immigration (e.g., Florida and Texas) in terms of states that voted for Trump: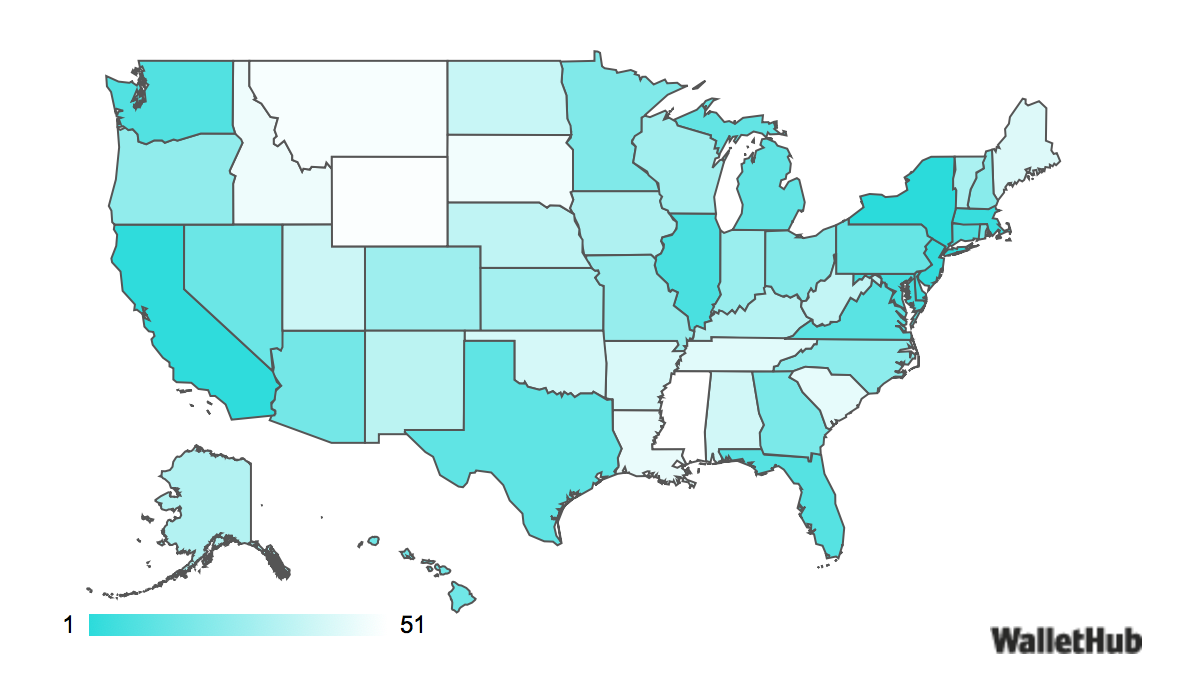
As the national conversation about Dreamers, DACA, and Trump’s Wall continues, WalletHub decided to sit down and map out the economic impact of immigration on the United States. They looked at 19 metrics including median household income of foreign-born populations, immigrant-owned businesses, homeownership rates, and Fortune 500 companies founded by immigrants or their children.
The TL; DR of the report is that the states that traditionally have high levels of immigration (California, New York, New Jersey) also reap the greatest economic benefit. In California, 27% of residents are foreign-born, which is 17.2 times higher than in West Virginia, the lowest at 1.57%. Unsurprisingly, immigrants make very little economic impact on West Virginia. Check out the full report here to start doling out facts and figures along with the many opinions about immigration.
Source: WalletHub
via Here’s the economic impact of immigration in each state in 2018

