StatsCan – Police-reported hate crime in Canada, 2016 – Analytical Note
2018/04/26 Leave a comment

Given the government’s diversity and inclusion focus, StatsCan has vastly improved the analytical note on hate crimes, including age and gender data on those accused. While personally I prefer longer-term comparisons rather than year-to-year as in the above charts, this analysis is nevertheless helpful (StatsCan summary below):
- In 2016, police reported 1,409 criminal incidents in Canada that were motivated by hate, an increase of 3% or 47 more incidents than reported the previous year. Accounting for the population, this amounted to a rate of 3.9 hate crimes per 100,000 Canadians in 2016.
- The increase in the total number of incidents was largely attributable to an increase in police-reported hate crimes motivated by hatred of a sexual orientation (+35 incidents) or of a race or ethnicity (+25 incidents). Hate crimes accounted for less than 0.1% of the nearly 1.9 million police-reported crimes in 2016 (excluding traffic offences).
- Police-reported hate crimes targeting sexual orientation rose 25% in 2016 to 176 incidents, compared with 141 incidents in 2015. These incidents accounted for 13% of hate crimes reported in 2016 and 11% of hate crimes reported in 2015.
- Between 2015 and 2016, the number of police-reported crimes motivated by hatred of a race or ethnicity increased 4% (from 641 to 666). In all, 48% of all police-reported hate crimes in 2016 were motivated by hatred of a race or ethnicity. Much of this increase was a result of more hate crimes targeting South Asians (+24 incidents) and Arabs and West Asians (+20 incidents). Despite posting a decrease in 2016, crimes targeting Black populations remained one of the most common types of hate crimes (15% of all hate crimes).
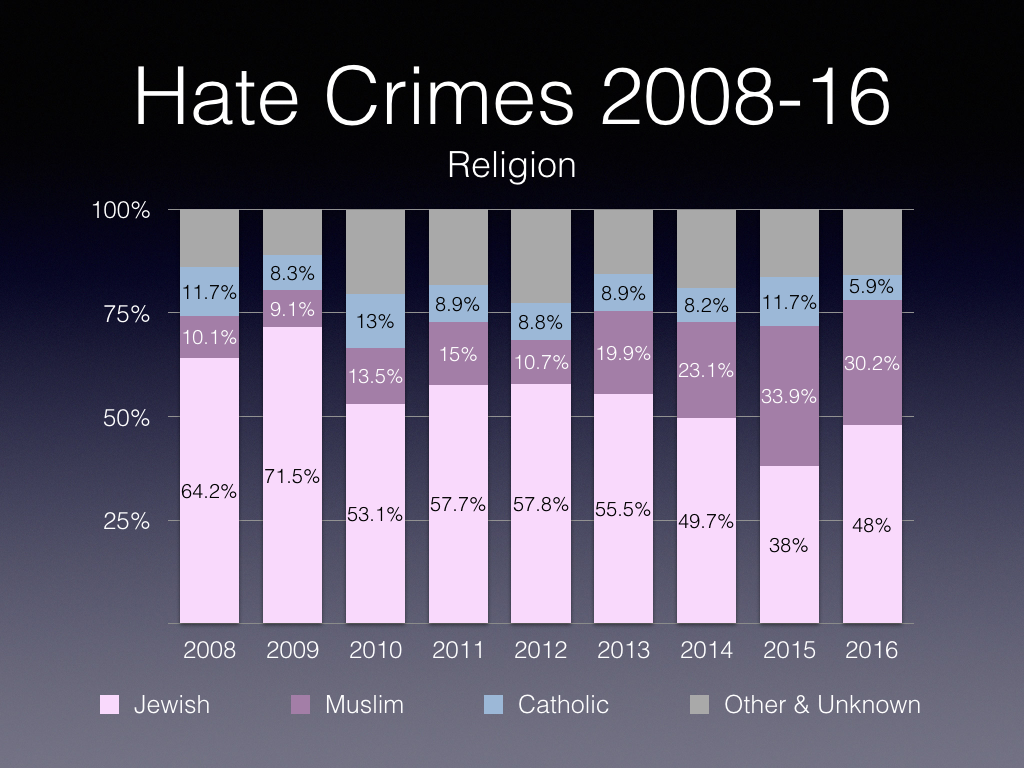
- Overall, 33% of hate crimes reported in 2016 were motivated by hatred of religion. Compared with 2015, the number of hate crimes motivated by religion decreased 2% in 2016 (from 469 in 2015 to 460 in 2016). Police-reported crimes motivated by hate against the Jewish population rose from 178 incidents in 2015 to 221 incidents in 2016 (+24%). In contrast, the number of crimes targeting the Catholic population fell from 55 to 27 incidents. Similarly, crimes targeting the Muslim population decreased 13% (from 159 incidents in 2015 to 139 incidents in 2016).
- The provinces of Quebec and British Columbia, and more specifically Vancouver (+30 incidents), Québec (+29 incidents), and Montréal (+25 incidents), were the census metropolitan areas where hate crimes increased the most in 2016. The increases in Montréal and Québec are associated with a rise in hate crimes targeting the Jewish, Arab and West Asian, and gay and lesbian populations. The increase in Vancouver was primarily explained by a rise in hate crimes against the East Asian, Southeast Asian and South Asian populations.
- Based on data from police services that reported characteristics of hate crimes, 43% of police-reported hate crimes in 2016 were violent offences. Violent offences included, for example, assault, uttering threats and criminal harassment. Overall, the number of violent hate crimes rose 16% from the previous year (from 487 to 563 violent incidents), driven by increases in common assault, criminal harassment and uttering threats.
Crimes motivated by hatred of a sexual orientation continued to be among the most violent hate crimes. In 2016, 71% of these types of police-reported hate crimes were violent, compared with 45% of crimes motivated by hatred of a race or ethnicity and 27% of hate crimes targeting a religion.- Non-violent offences made up 57% of police-reported hate crimes in 2016. Mischief, which includes vandalism and graffiti, was the most commonly reported offence among police-reported hate crimes and accounted for 41% of all hate crime incidents in 2016. Between 2015 and 2016, the total number of non-violent hate crime incidents fell 6%. In 2016, 73% of crimes targeting religion were non-violent. This proportion was 55% for non-violent crimes motivated by hatred of a race or ethnicity. Conversely, hate crimes motivated by sexual orientation were less often non-violent (29%).

