Neat Data Visualization: Net Neutrality
2014/08/14 Leave a comment
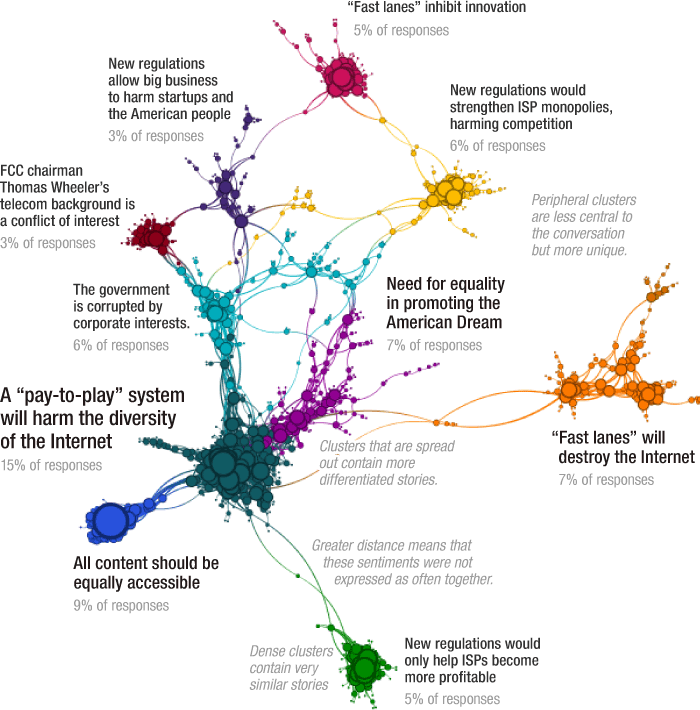 A good visualization that helps one understand relationships and relative weight of comments.
A Fascinating Look Inside Those 1.1 Million Open-Internet Comments
Working site on citizenship and multiculturalism issues.
2014/08/14 Leave a comment
A good visualization that helps one understand relationships and relative weight of comments.
A Fascinating Look Inside Those 1.1 Million Open-Internet Comments
2014/08/14 Leave a comment
Good piece in iPolitics on the influence of sponsored travel, focussing on Israel but not unique (i.e., Taiwan):
Independent MP Brent Rathgeber says he enthusiastically accepted the chance to visit Israel when he was invited in 2010.
“It was a fascinating trip. It was a great trip. I learned a great deal on all aspects of it. I grew up in a Christian home and it was fascinating to visit the holy sites.”
Rathgeber says the trips deliver value for the CIJA and could be having an effect on the reaction of Canada’s MPs to the current conflict.
“The sponsors of these trips, although in fairness they try to provide some balance on the conflict, obviously have a goal in mind in the education that they provide by taking you there. So, I am not surprised that all of the major parties seem to have a certain perspective with respect to this ongoing conflict in Gaza.”
Norman Spector, a former Canadian ambassador to Israel, is among those who have met with MPs on trips sponsored at the time by the Canada Israel Committee.
Spector said he also set up meetings and tours for MPs when he was ambassador but his tours included elements he suspects the CIJA tours are lacking – like a wide range of Palestinian views including members of Hamas before it was declared a terrorist organization and some of the far right voices in Israel.
“I doubt that many MPs have been taken on these missions to a refugee camp in Nablus or if any has seen raw sewage flowing at Jabalya camp in Gaza.”
Sponsored travel helping Israel win over Canadian MPs. (pay wall)
2014/08/14 Leave a comment
 No surprise and in line with its competitors as above graphic shows (although its ads generally portray diversity well):
Apple, the latest tech company to reveal its workforce demographics, said Tuesday that its U.S. staff is 55% white, 15% Asian, 11% Hispanic and 7% black. Two percent of workers are multiracial, and another 9% did not declare their race.
In regards to gender, Apple’s global workforce is 70% male and 30% female. Within tech-related jobs specifically, the disparity is 80% male and 20% female.
Apple’s employee demographic trends are similar to those of other major tech companies, several of whom, like Google, Facebook and Twitter, have also recently released diversity reports. Like the other firms, Apple included in its report a public commitment to increase the diversity of its workforce.
“As CEO, I’m not satisfied with the numbers on this page,” Apple head Tim Cook said in a letter accompanying the figures. “We are making progress, and we’re committed to being as innovative in advancing diversity as we are in developing our products.”
In addition to race and gender, Cook said that Apple celebrates other types of diversity, such as people with disabilities as well as varying sexual orientations.
2014/08/14 Leave a comment
More bad news re StatsCan regarding its having to redo job numbers:
The incident will add fuel to a continuing debate over the quality of the federal government’s labour market data, which, economists contend, has generally been more volatile in recent years.
Peter Buchanan, senior economist with CIBC World Markets, said the error reinforces the fact that markets and policy makers need reliable information.
“Obviously, this does add to concerns on that front,” he said. “Good data is essential to steer the economic ship in the right direction.”
Federal departments – including Finance Canada – have recently used alternative private sector surveys based on Internet job postings to produce job vacancy statistics. That approach led to criticism after the Parliamentary Budget Officer pointed out that the government’s claim of rising job vacancies was almost entirely due to methodological problems associated with using job postings on the classified site Kijiji.
Partly as a response to that criticism, the government announced in June that it would give Statistics Canada an additional $14-million a year starting next year to produce a new job vacancy survey and a new survey on wages.
One of my doctors commented, regarding the cancellation of the Census, that “there is nothing more costly than ignorance.” The government is paying the price for not having valued good quality data and statistics.
Statistics Canada rushing to redo July job numbers – The Globe and Mail.
2014/08/14 Leave a comment
Vignette from the Gulf and the Kuwaiti approach to citizenship and revocation. Given the large number of expatriate workers, both lower and higher skilled in the region, all states there have restrictive citizenship rights and depend largely on guest workers.
The Canadian government did not cite Kuwait as one of its models for revocation (Canada does, unlike recent UK measures, have an exception for those who would be left stateless):
Nationality has long been a fraught subject in Kuwait, home to an estimated 100,000 stateless individuals. The country’s so-called bidoon from the Arabic word for without, or stateless persons are unable to find legal work or access social services; some find odd jobs on the black market but most live in abject poverty. Many were born in Kuwait and claim that their parents – bedouins or members of other nomadic communities – were not able or aware that they needed to register to obtain citizenship when Kuwait became independent. While the government admits some of these residents deserve citizenship, it says others have arrived from third countries in hopes of accessing the country’s generous welfare system.
The creation of a new stateless class could complicate things further. None of the individuals who have lost their passports so far have other nationalities, meaning they have effectively joined the ranks for the bidoon.
2014/08/13 Leave a comment
As regular readers of this blog know, I contribute regularly to New Canadian Media.
Given the financial realities of publishing and being a start-up, NCM has launched a crowd funding campaign with FundRazr, with the following message:
New Canadian Media is Canada’s premier website dedicated to bringing news and views from an immigrant perspective – bringing you original content from an immigrant perspective.
Established as a non-profit in 2012, we are proudly pioneering a new pan-Canadian form of immigrant journalism founded on the premise that all Canadians need to know what’s on the minds of immigrants … so we can all have a better conversation. If you haven’t already, take a look at our site, and see how we are changing the national conversation
At this time, we need your help to continue producing great multimedia content. Every dollar you donate will go towards content: great content that makes a difference to our national conversation and the digital technology that enables this great content to be accessible, responsive, and easy-to-view.
Help champion NCM’s pioneering journalism.
While I have no financial interest, it is somewhat self-interested of me to support this campaign.
Please take a look at their site and stories and, if you like what you see, please consider making a contribution.
Andrew
2014/08/13 Leave a comment
An increasingly common trend, retirement homes for specific communities, given language and food issues, among others:
Almost four decades ago, the first Vietnamese refugees began arriving in Toronto, traumatized and penniless, following the Communist takeover of South Vietnam.
Today, many of those refugees are aging, including about 100 living in nursing homes scattered across the GTA.
As a community volunteer, Thanhnha Nguyen often visits elderly Vietnamese in those homes. She will never forget one woman — the only Vietnamese resident in one of the largest nursing homes in the GTA.
Like many Vietnamese of that generation, the tiny woman spoke no English. Unable to eat the pasta and meat-based meals that the home provided, she weighed only about 90 pounds. “She was just bones and skin,” recalls Thanhnha.
Many Vietnamese seniors feel like outsiders in these retirement homes, says Thanhnha, but for this particular woman the sense of isolation was so devastating that she had tried to end her life.
Thanhnha recalls asking the elderly woman why her face was so pale and blue. “She told me she had tried to bang her head against the wall to try to kill herself,” says Thanhnha.
For Thanhnha, it was a turning point. “That’s when I said, we have to do something for our community — for our parents.”
Retirement home a tribute to a generation of Vietnamese – Toronto – CBC News.
2014/08/13 Leave a comment
Not sure the numbers are as bad as portrayed as they cover a three-month period, and the numbers are very low in terms of total number of tweets.
Compare this to comments in newspaper columns on immigration and multiculturalism, where my anecdotal observations indicate a fair number of offensive comments, depending on the article:
“In Canada, we’re so reluctant to talk about race and racism specifically so often times in public discourse it’s rarely ever brought up but when you shift to the online realm people are … freely being racist,” said Chaudhry, who will present his findings at the Social Media and Society International Conference in Toronto next month.
To conduct his research, Chaudhry flagged common racist terms coming out of Calgary, Edmonton, Vancouver, Winnipeg, Toronto and Montreal.
In Calgary, as well as Edmonton and Winnipeg, the majority of comments were directed at the aboriginal community.
About 50 per cent of all the racist tweets were real-time observations, said Chaudhry.
“I’d always notice people complaining to Calgary transit about aboriginals in public spaces,” he said.
Overall, he said the number of Calgary-based racist tweets was low. Toronto accounted for 434; Vancouver had 99; Winnipeg had 78; Edmonton had 60; and Montreal had 43. In Toronto, Vancouver and Montreal, the n-word was the most common racist term.
Darren Lund, a professor at the U of C’s the Werklund School of Education who researches social justice issues, said he was disheartened but not surprised by the findings.
“It seems that most of us have been raised in a way that even if we’re really nice, well-intentioned people, we’re still taught in some ways to think of aboriginal people as less than, or as flawed,” he said.
Tracked tweets reflect racist attitudes online, says of U of A researcher.
2014/08/13 2 Comments
More on the flyer by Immigration Watch (Anti-immigration flyers single out Sikh community in Brampton):
Michael Chan says in a statement that he is “disgusted” by the flyers in the city northwest of Toronto and that “there is no room in our province for intolerance, hatred or division on cultural or racial lines.
The document shows a crossed-out picture of a man wearing a turban alongside text asking readers to “Say ‘No’ to the massive Third World invasion of Canada.”
Ont. minister denounces ‘hateful’ anti-immigrant flyers; police investigating – The Globe and Mail.
2014/08/13 Leave a comment
Unfortunately, all too typical of shallow economic analysis, aligned with ideology.
Of course, one can and should always question value for money with respect to taxation, as well as reviewing the need for government intervention and programs.
But an increase in the share of taxation from 33.5 percent in 1961 (pre-medicare) to 41.8 percent in 2013 without a corresponding analysis of the change in government services is the kind of sloppy “stop the gravy train” Rob Ford unsubstantiated bumper sticker.
A more serious approach would be to compare the increase in program spending with the increase in programs and services, and focus the discussion on whether or not the existing policy rationales and needs are still appropriate:
“Telling people that almost 42% of their income goes on taxes, that’s the first important takeaway. Then people can say, ‘Hold on, that’s one area that can be scaled back.’ We want to start that conversation and this is the data to do that,” he said.
Given that incomes have increased substantially since 1961, it’s inevitable taxes would also rise in terms of the amounts paid, but tax rates have increased because governments provide a wider range of services.
Since 1961, the average family’s tax bill rose by 1,832%, dwarfing increases in the costs of housing, clothing and food.Last year, the average family earned $77,381 and paid $32,369 in total taxes, or 41.8%. Food, shelter and clothing ate up another 36.1%.
For 1961, the numbers were $5,000 in income, $1,675 on taxes (33.5%) and food, shelter and clothing 56.5%.

Click image for book purchase
